I consume quite a lot of market related news and stories. I’m a regular listener of few high-quality podcasts, I watch YouTube videos, read investment books and news articles, etc. Lately, I’ve been thinking about the mental image that we have about the markets, and what could possibly be “The Secret of Trading”.
Due to my professional experience, I like thinking in frameworks or mental models. They provide me with the foundational principles to guide my thinking processes, methods, and routines. To come up with these frameworks, I like to question everything, to deconstruct the problem to its essence, and check the hidden assumptions that we, sometimes involuntarily, make.
When it comes to the Stock Market, I believe that the first, and one of the major, assumptions is to think about the act of “trading shares of public companies in an open exchange” is similar to a market. Yes, I do not agree with the word market. I prefer think about trading and investing more as a the Stock Relay Races or, for short, the Stock Races.
Once you think about the investing and trading as relay races, it is more natural to reach to the conclusion that “The Secret of Trading” is “buy high and sell higher”. You can read about my thoughts in this short page in my site:
The Secret of Trading

We call it the stock “market” and they tell you to “buy low and sell high”. Both of these are simply not correct. The exchanges are not markets and buying low is most probably a bad idea. Let me explain.
And now let’s do the weekly review.
Context: Why is it happening?
Economic Production: ISM PMI vs. SPX
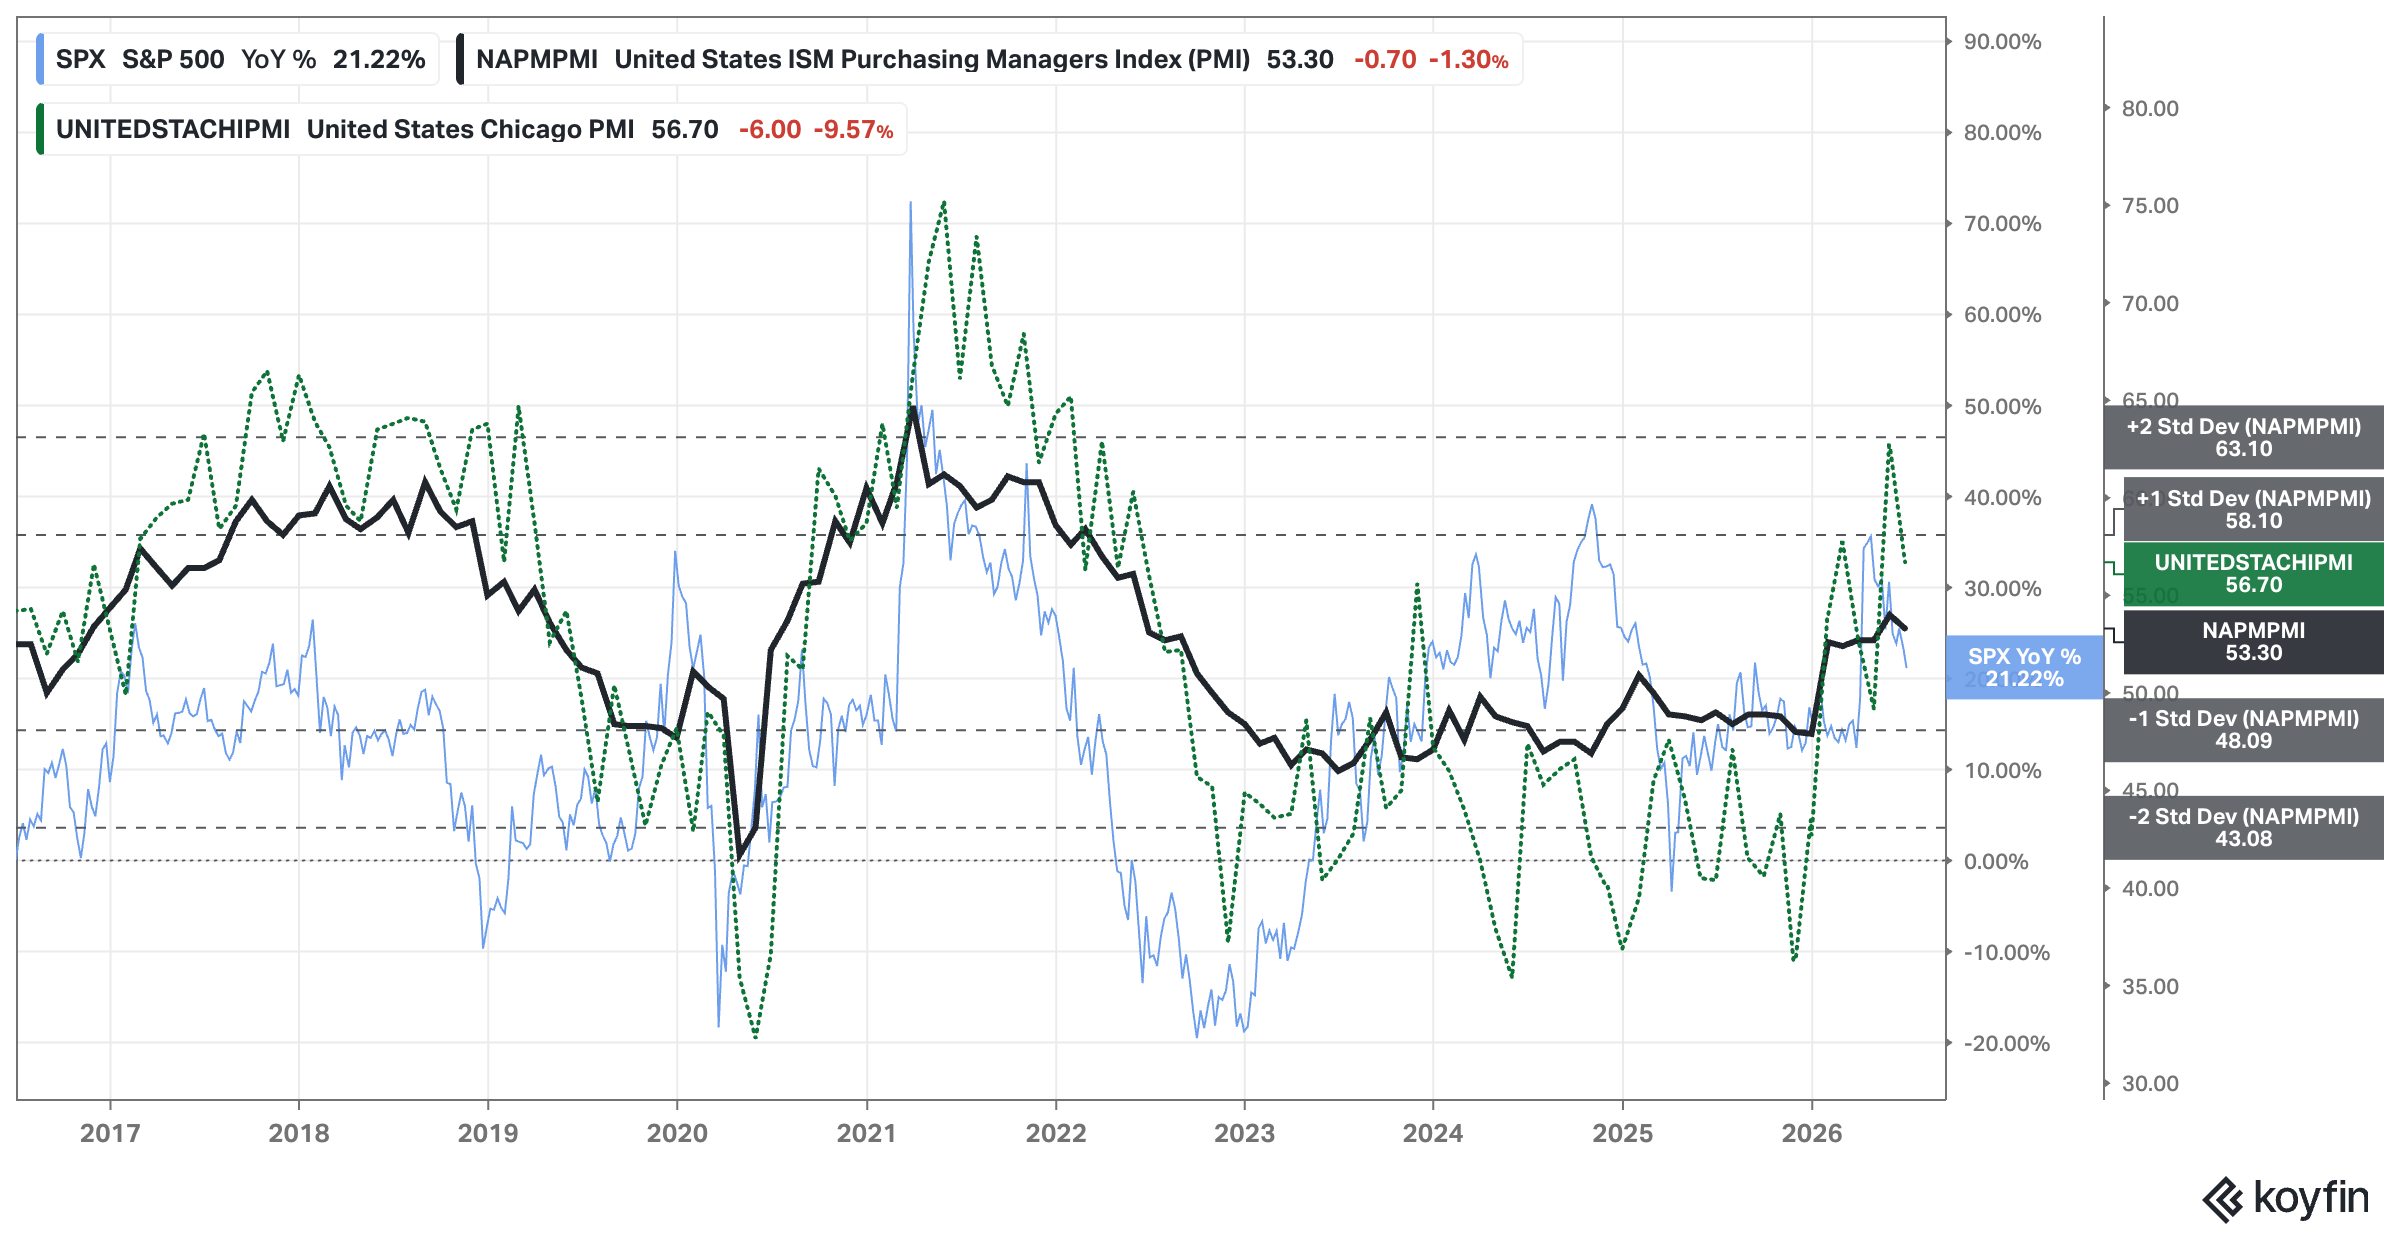
Analysis: No changes since last week.
Outlook: Bullish
Economic Activity: Regional Banks Performance
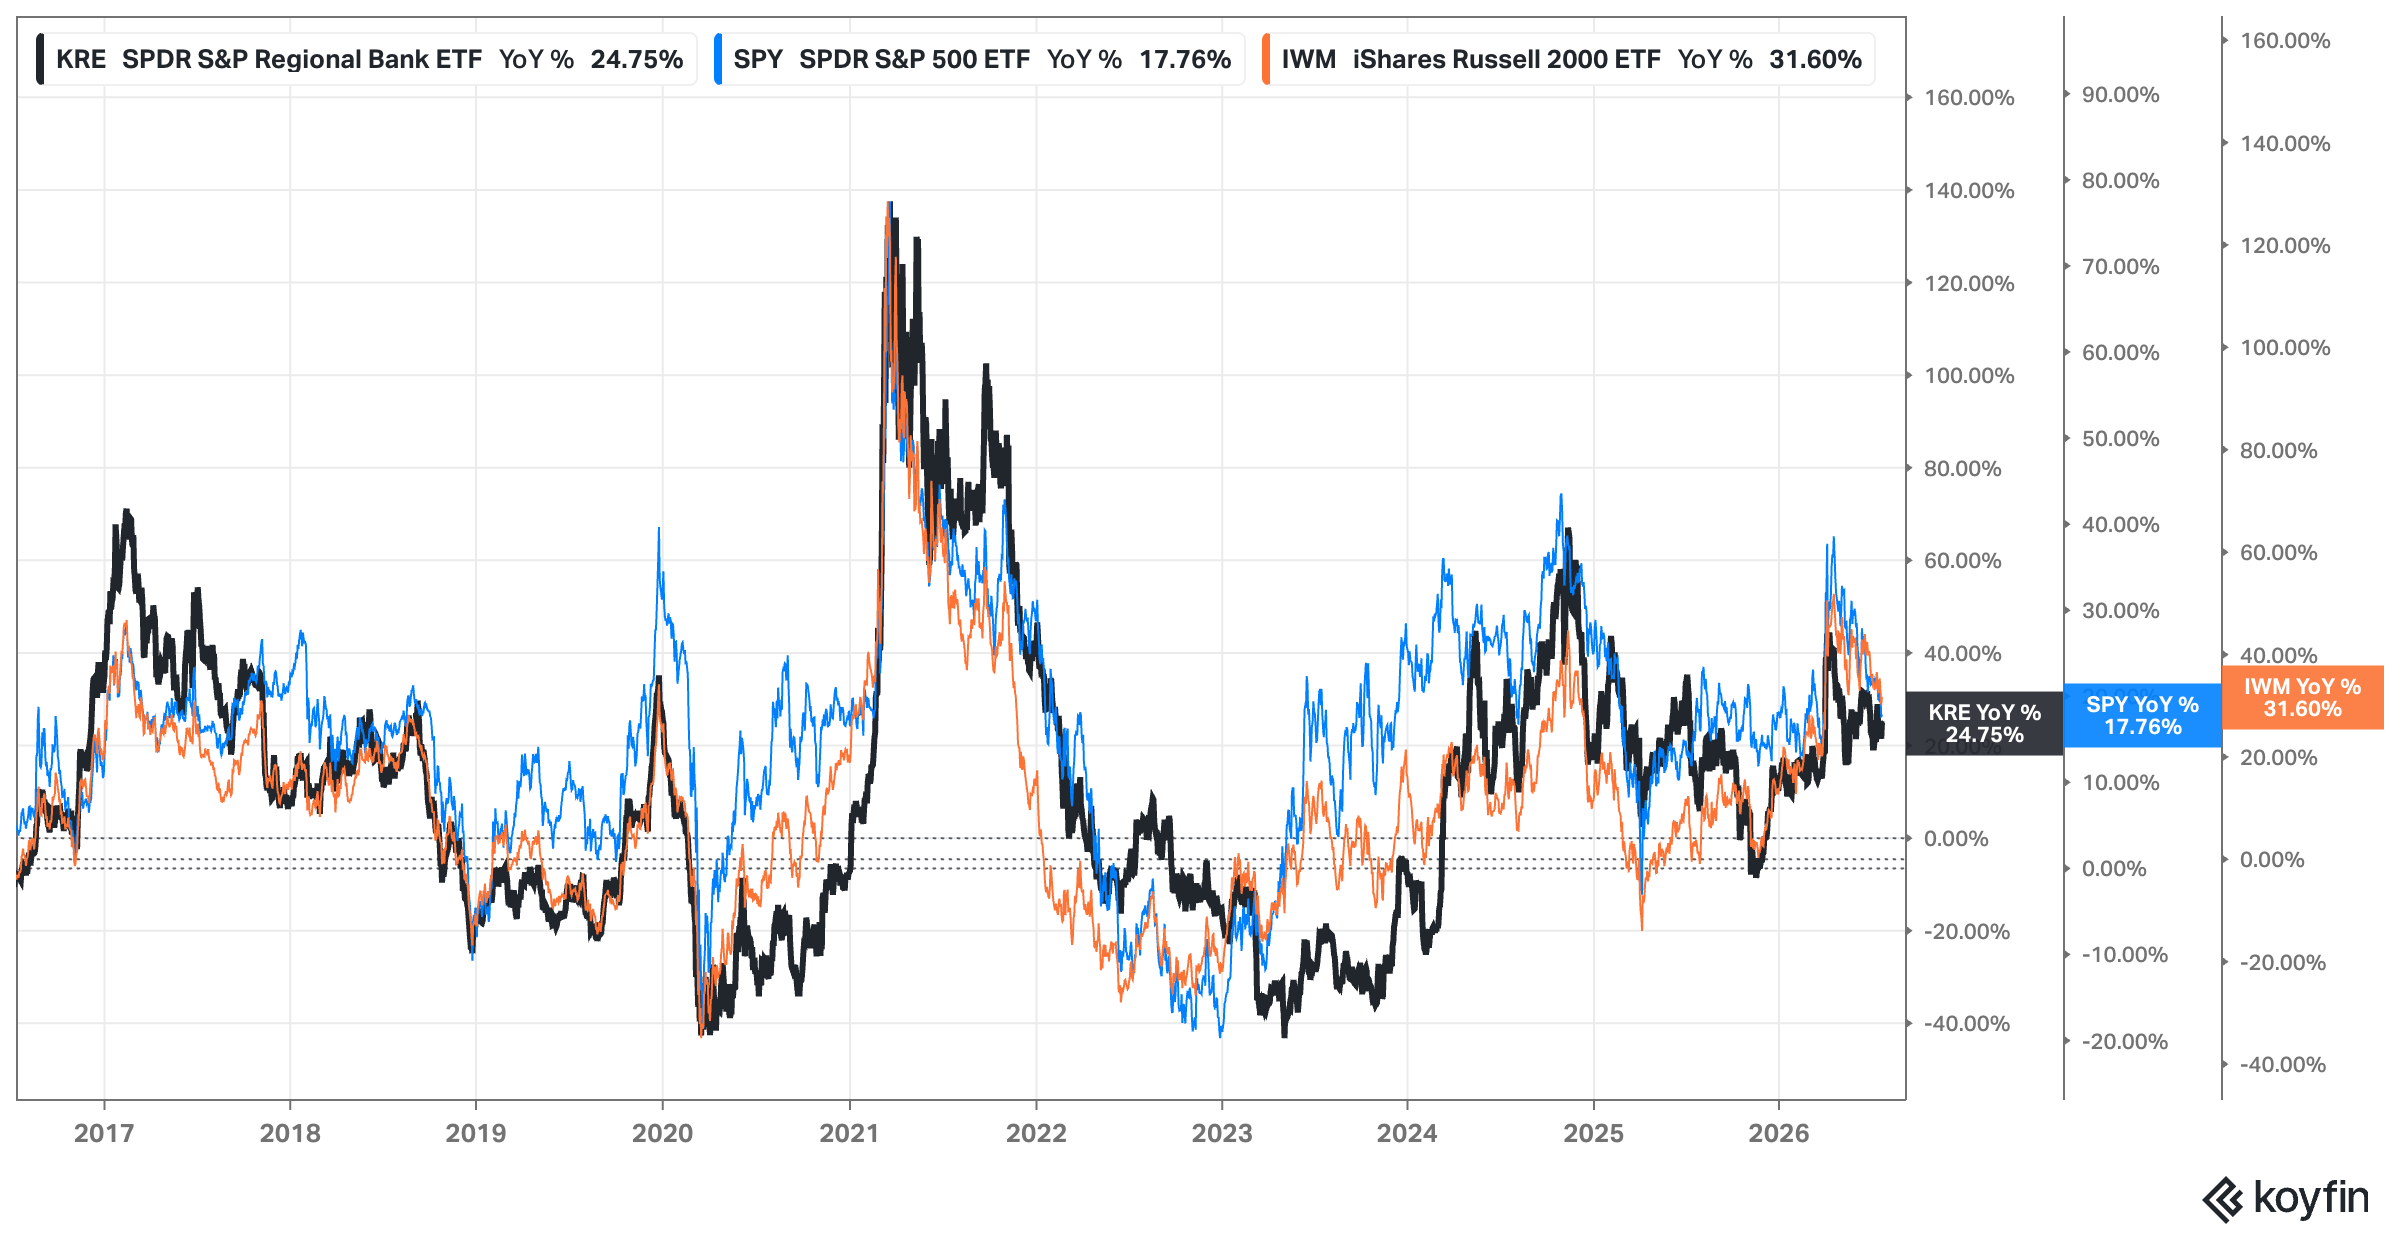
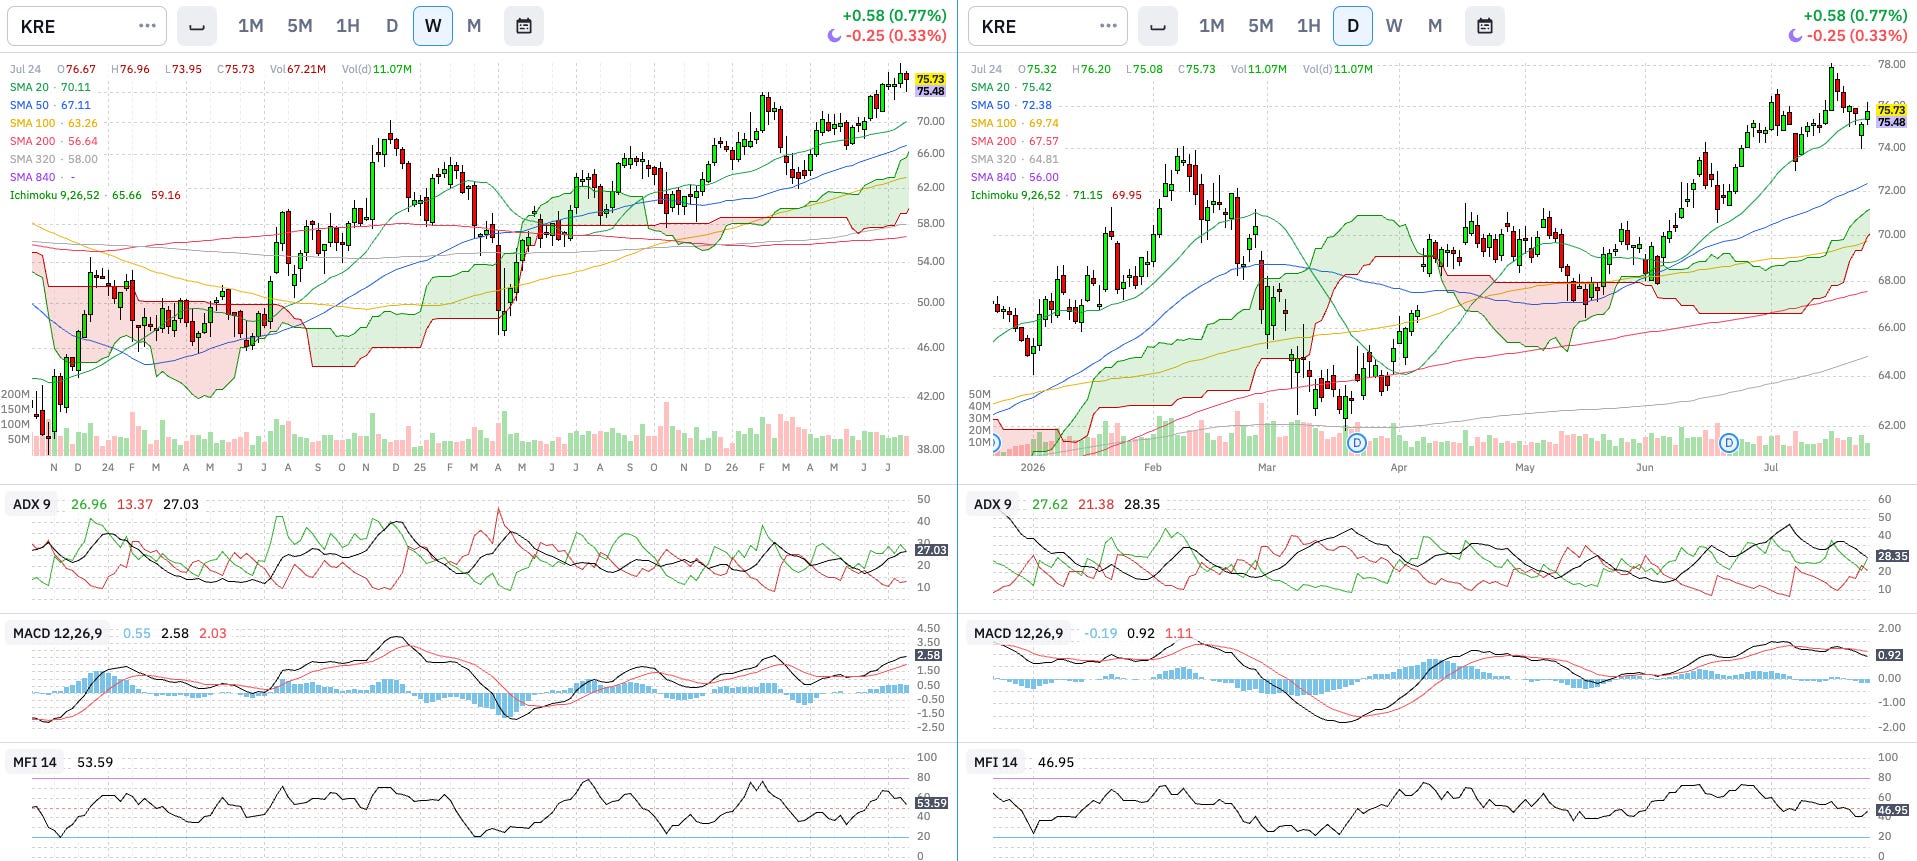
Analysis: KRE weekly Money Flow has a bearish divergence more clearly seen in the daily chart, where we also see that the trend is losing strength in ADX. Momentum in the daily chart is also showing a bearish divergence between MACD and price. All of this indicates near-term bearish forces but we shall still be confident on the long-term bullish trend that remain well in place in both weekly and daily charts.
Outlook: Bullish
Interest Rates: FED, 2yr, 10yr, and 30yr Rates
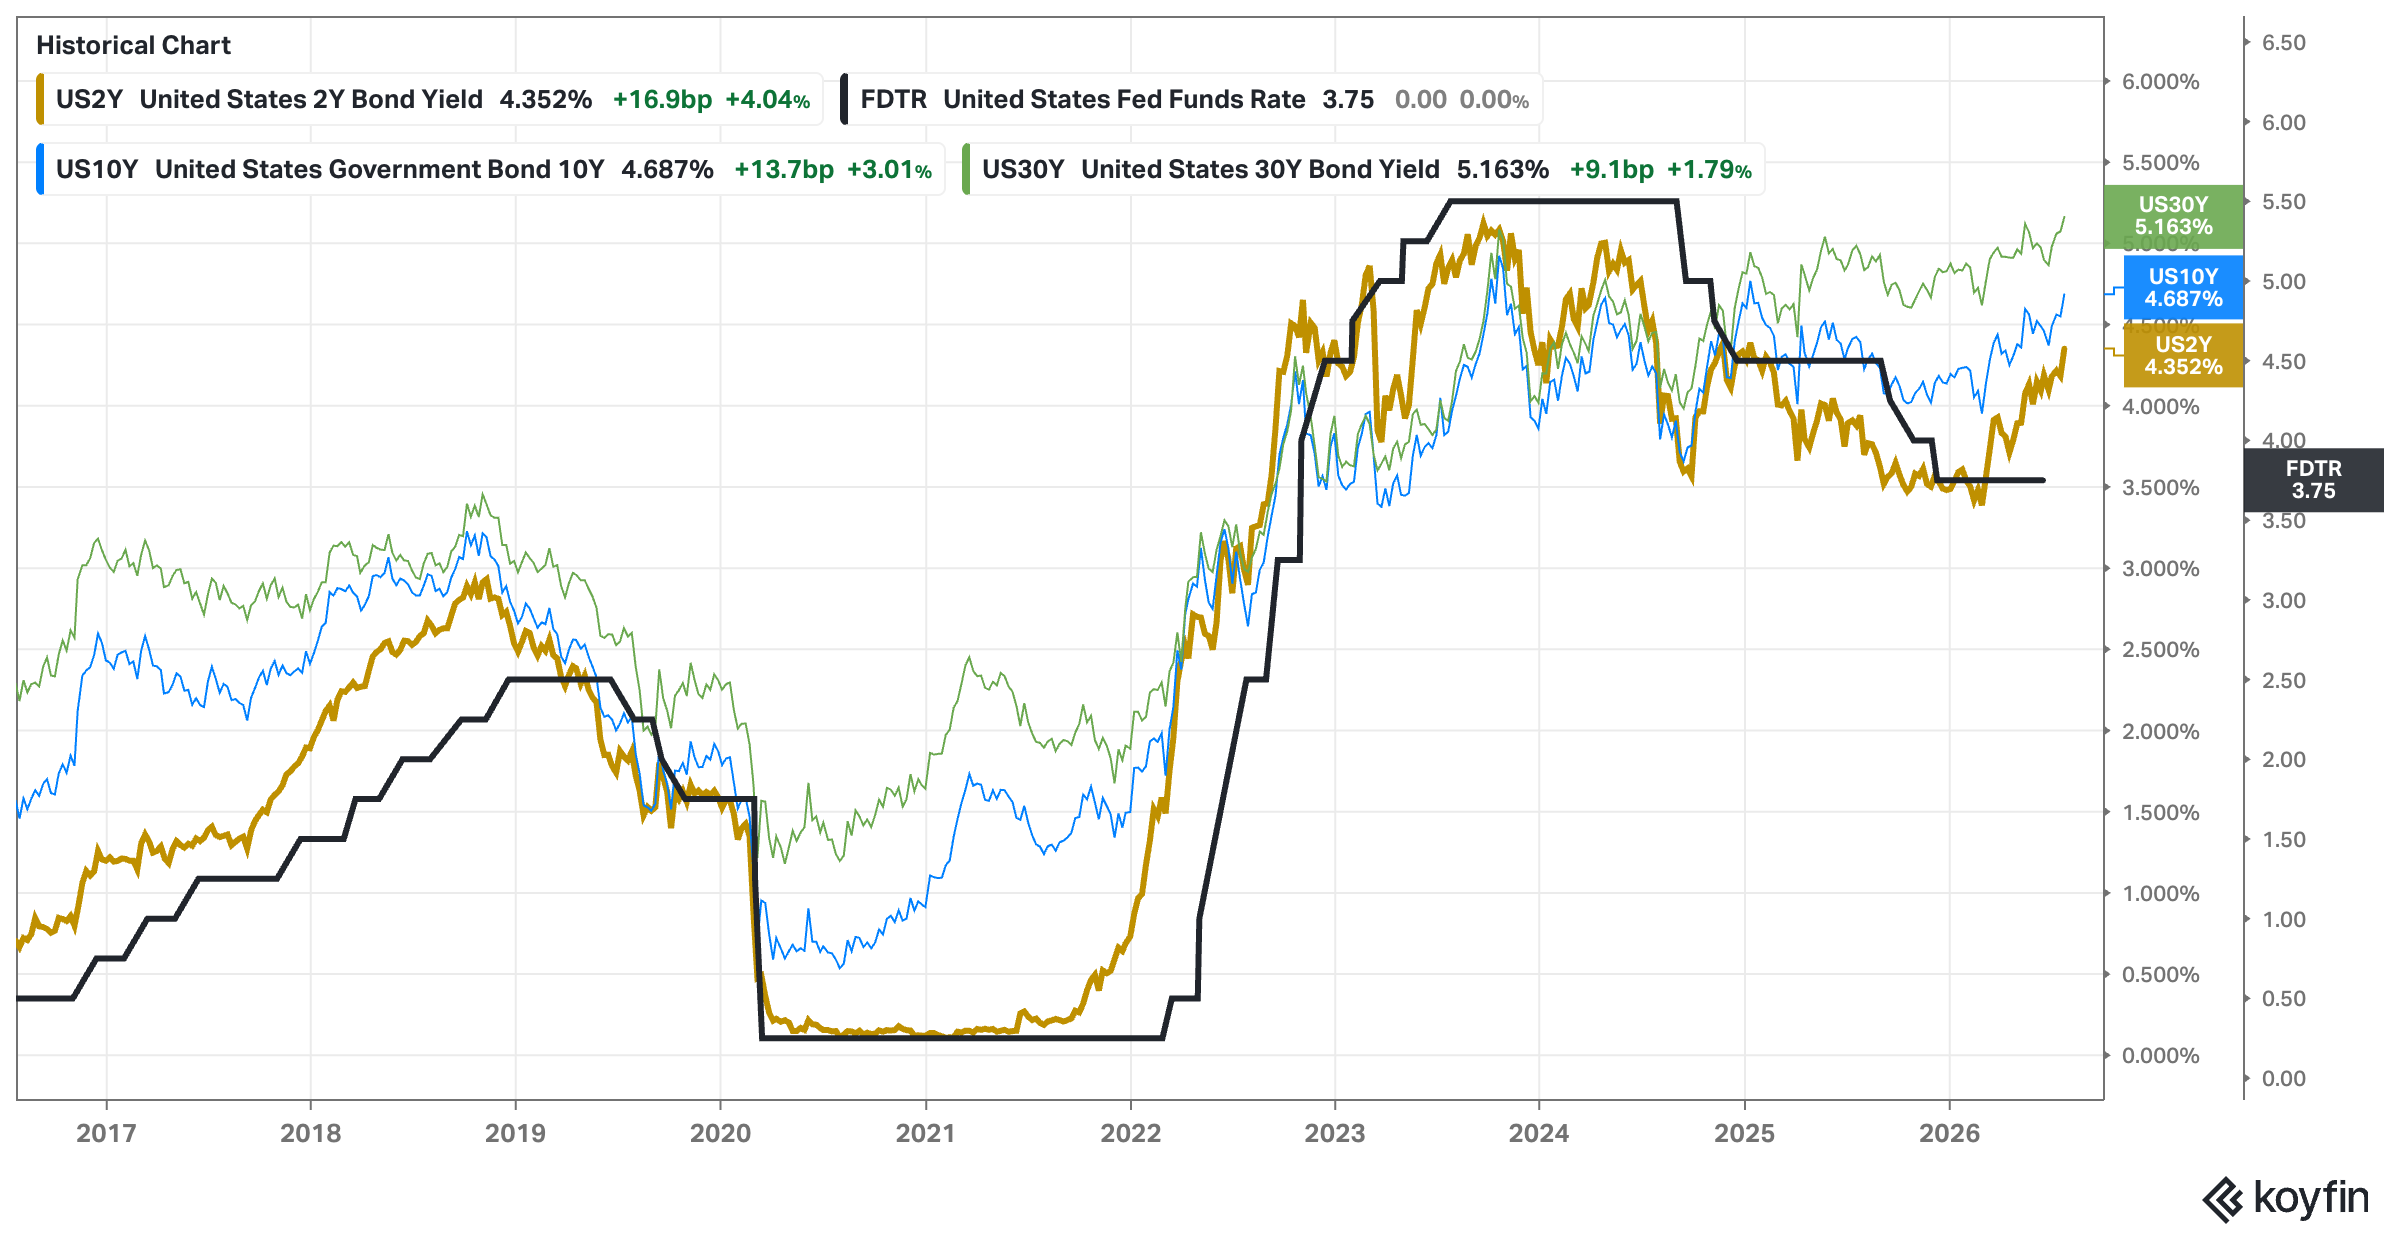
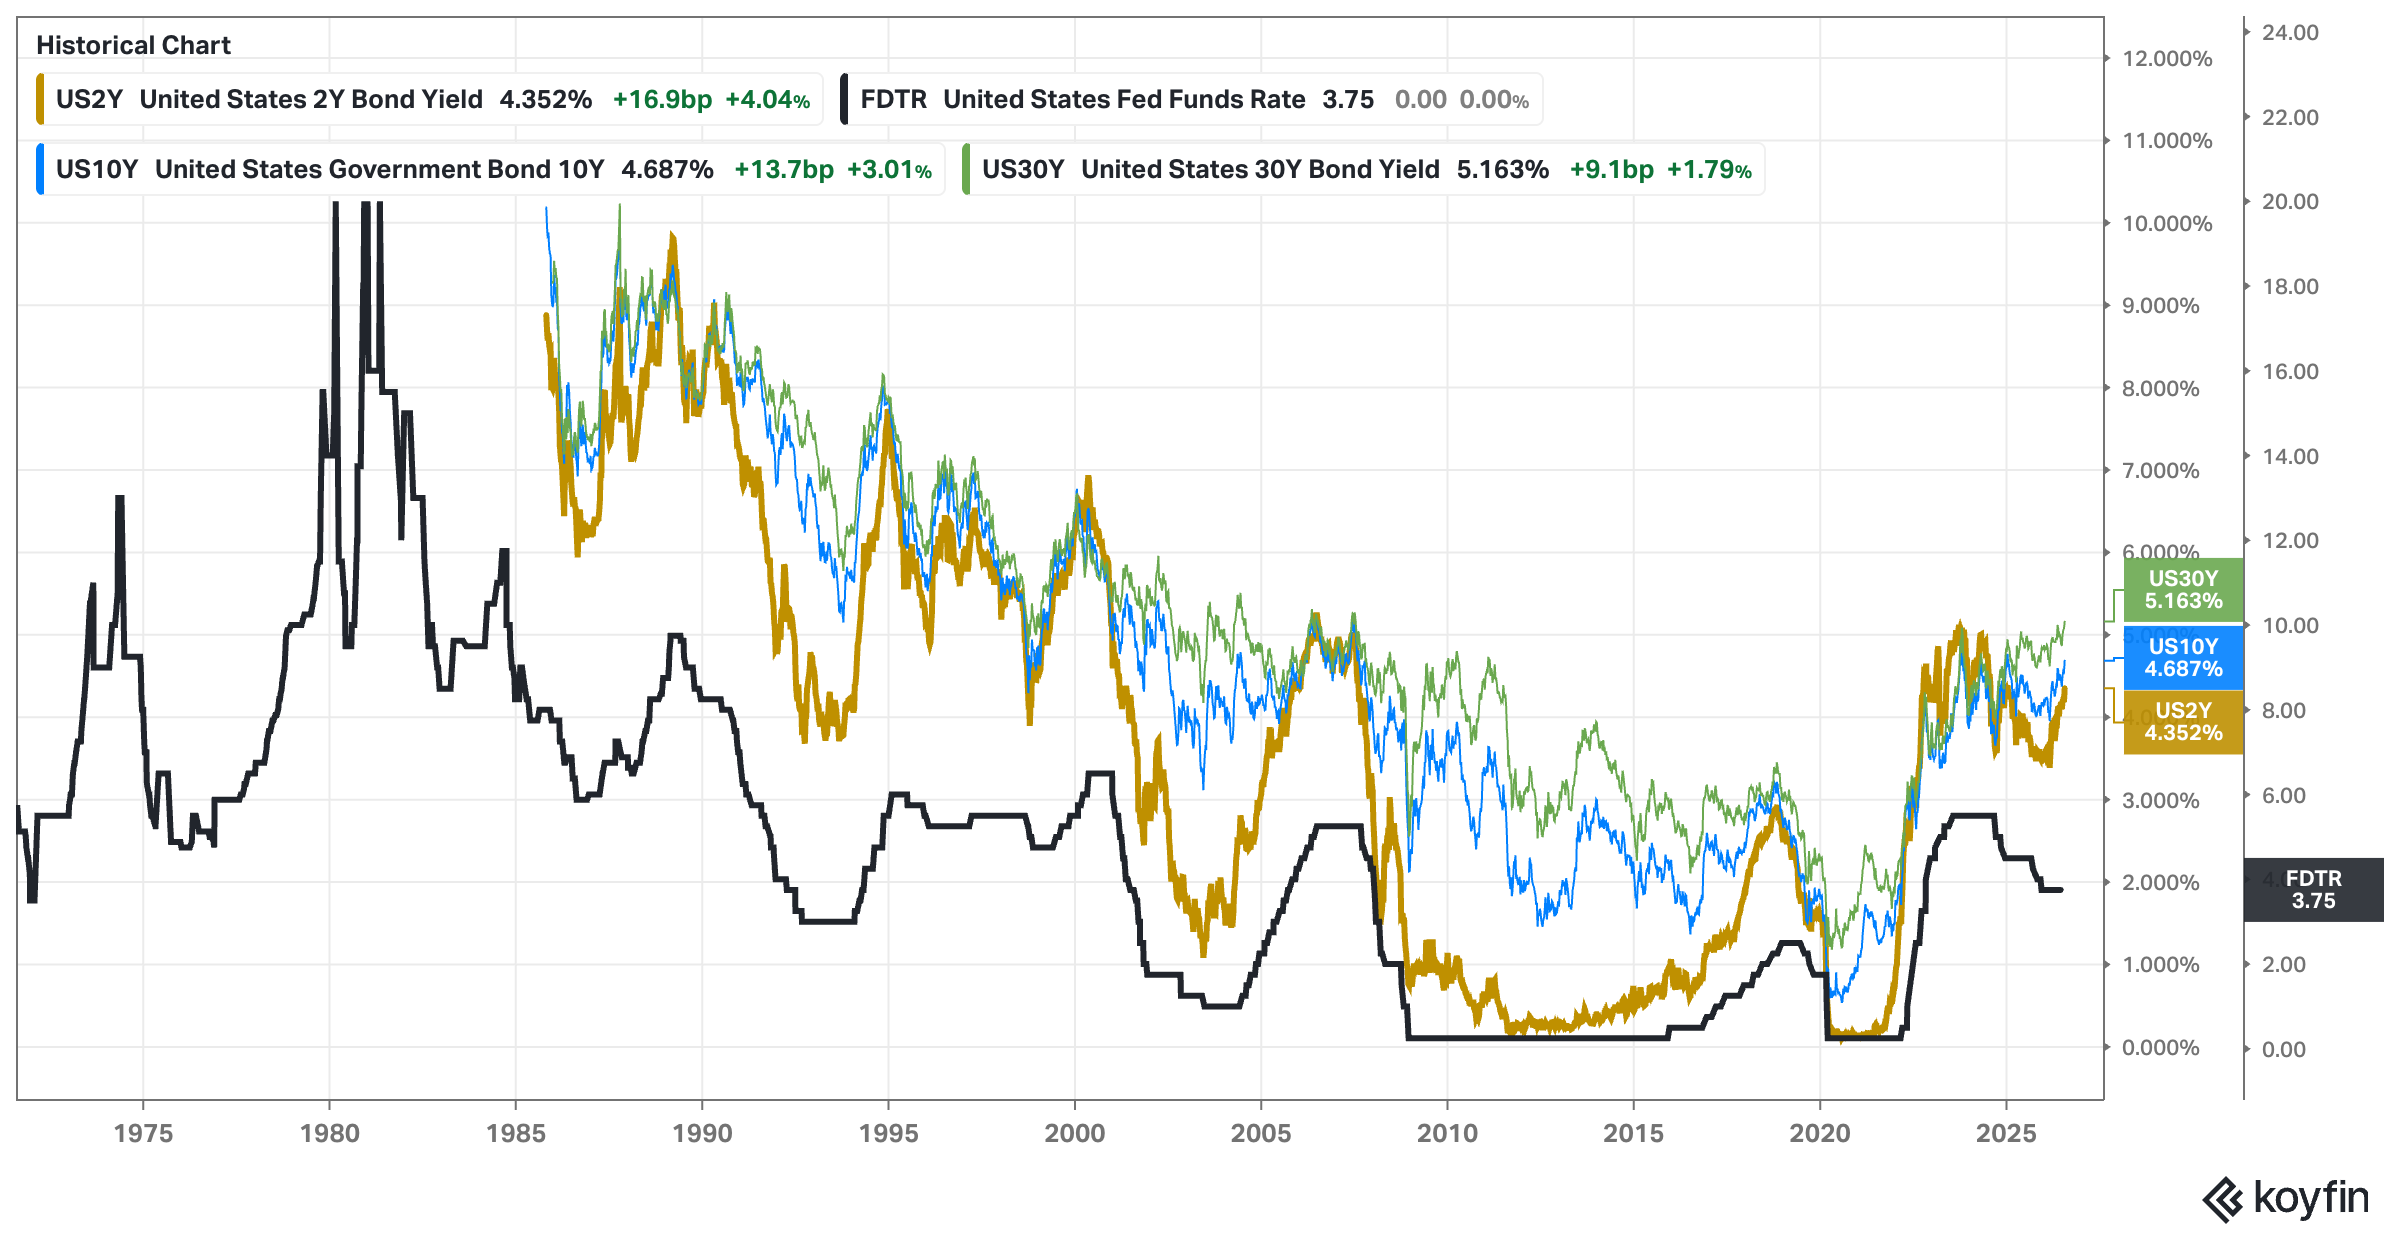
Analysis: Strong uptick in all interest rates. Zooming further out, we haven’t seen these 30Y levels since 2007.
Outlook: Neutral
Context: Why is it happening? Summary
Economic Production: Bullish
Economic Activity: Bullish
Interest Rates: Neutral
Market: What is happening?
Price Action: Weekly & Daily SPY, QQQ, and IWM
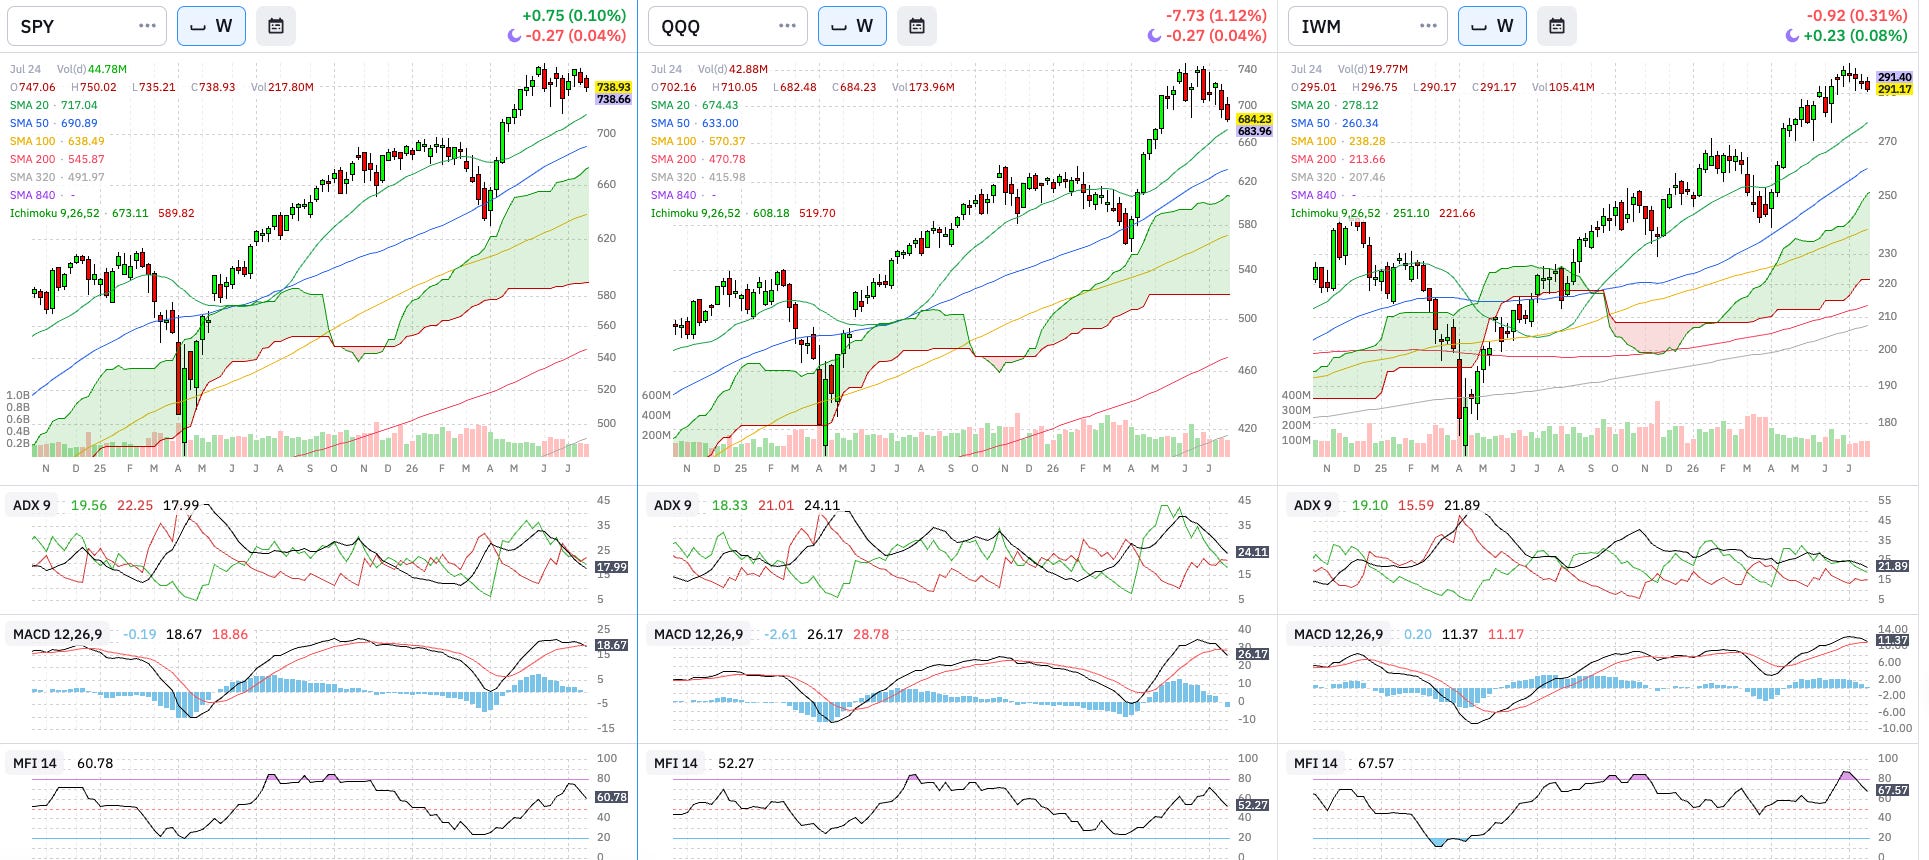
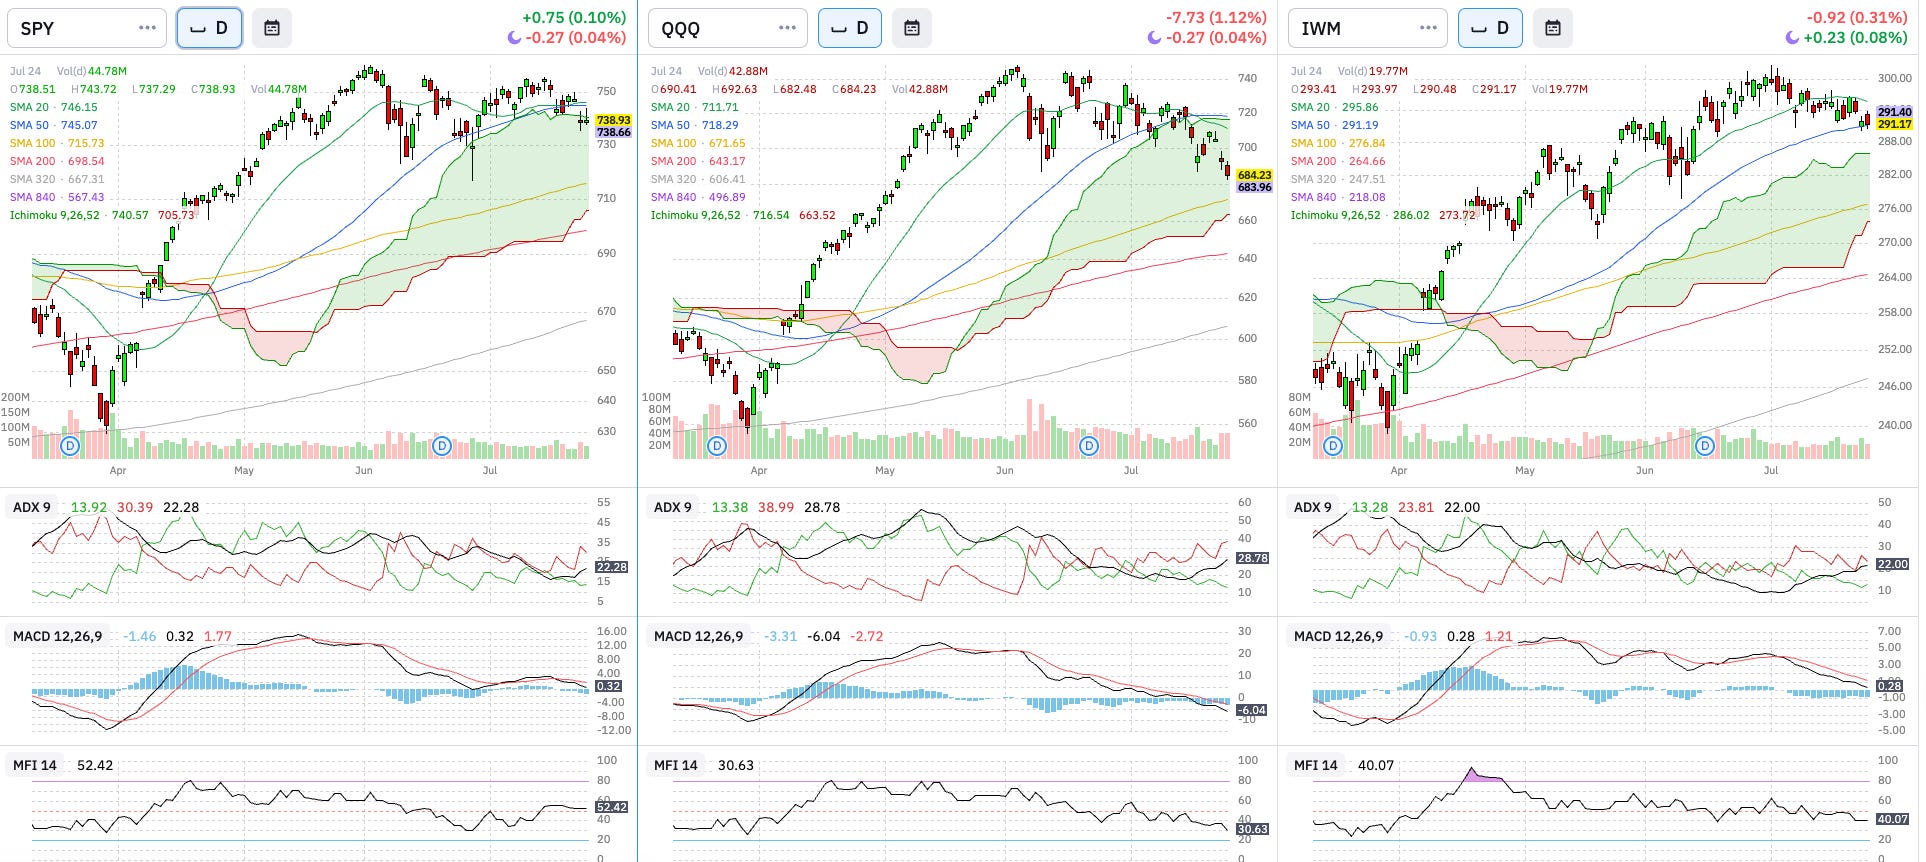
Analysis: All three index are in clear downtrends confirmed by ADX and Moving Averages, bear momentum by MACD, and under selling pressure volumes as seen in the MFI indicator.
Wyckoff Stage: Distribution
Breadth: % Stocks above SMAs
Above 200 Daily SMA
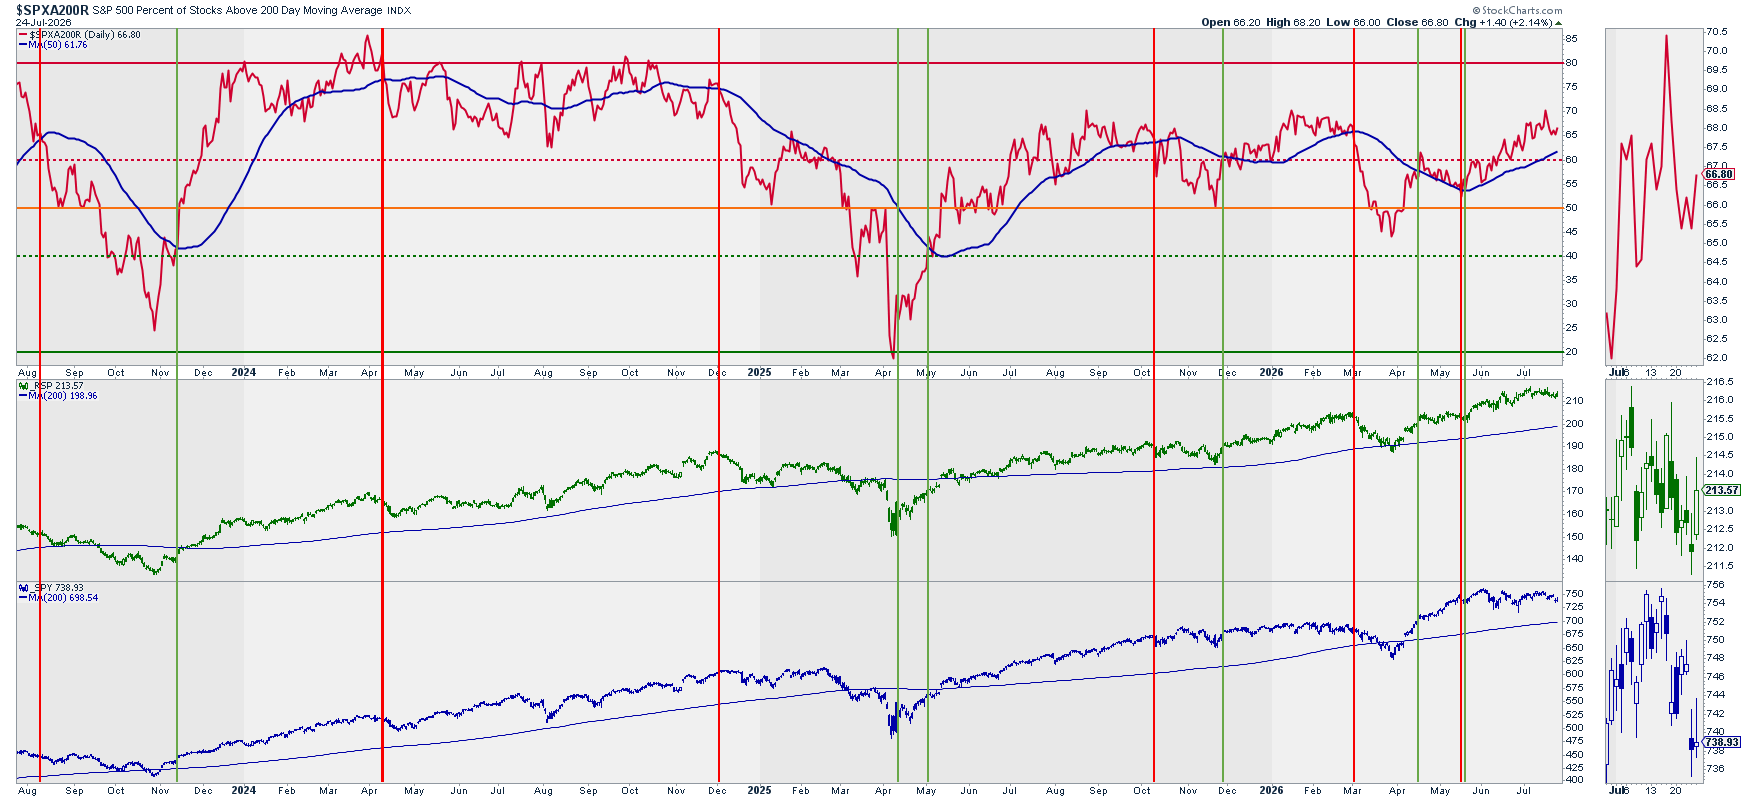
Above 20, 50, and 200 Daily SMAs vs. RSP
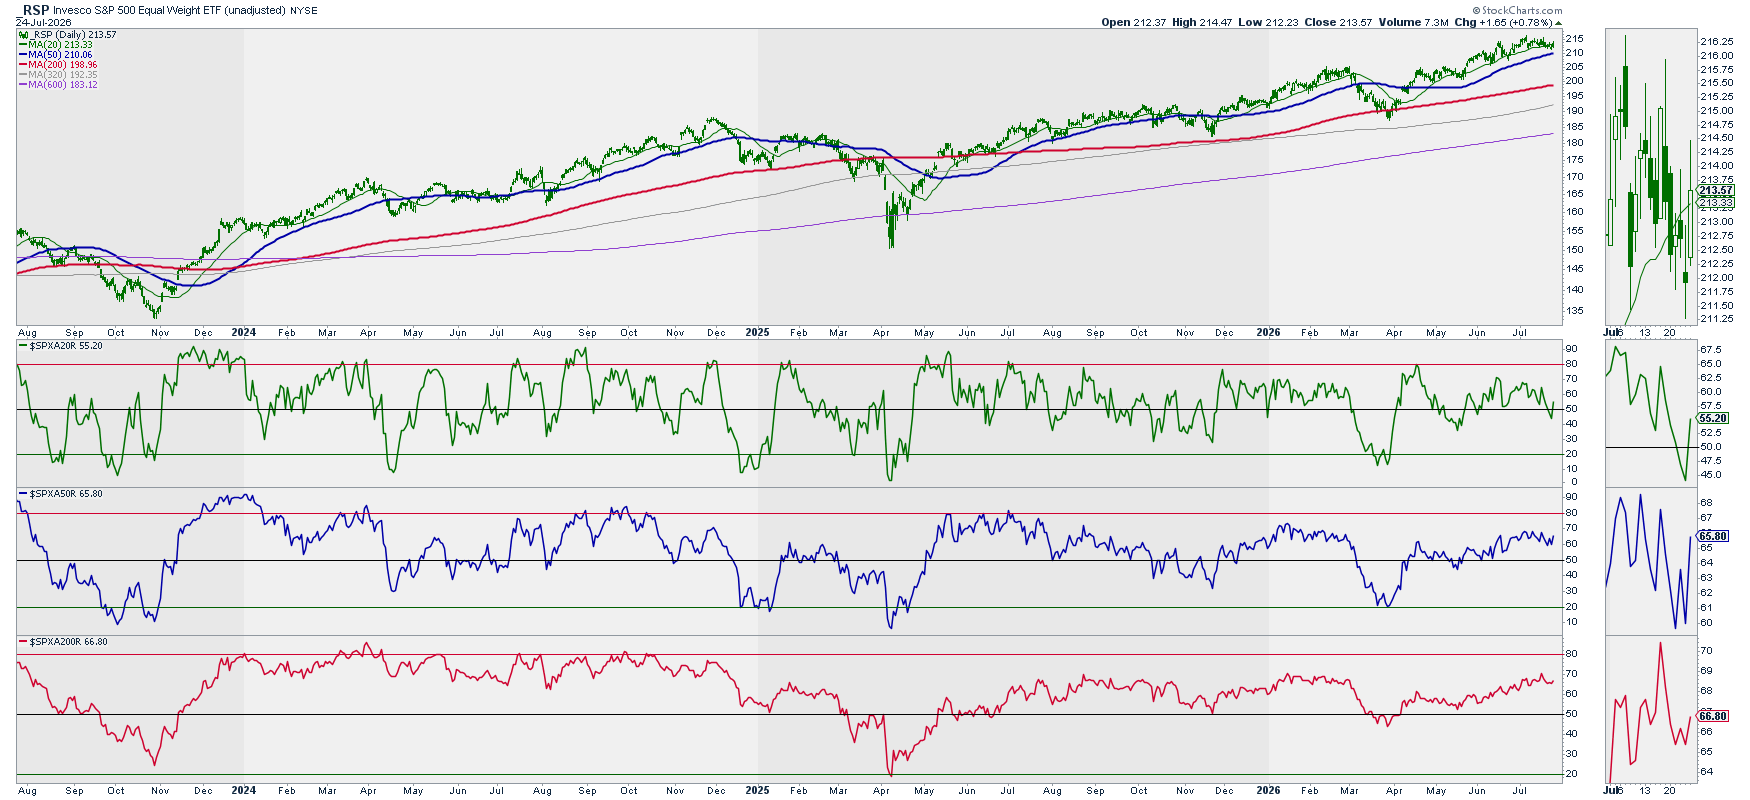
Analysis: % stocks above their 200D and 50D remains elevated. 20D numbers reflect the current downtrends in the indexes.
Outlook: Broadening.
Volatility: Ratio Low Vol. Stocks / SPY vs. RSP & SPY
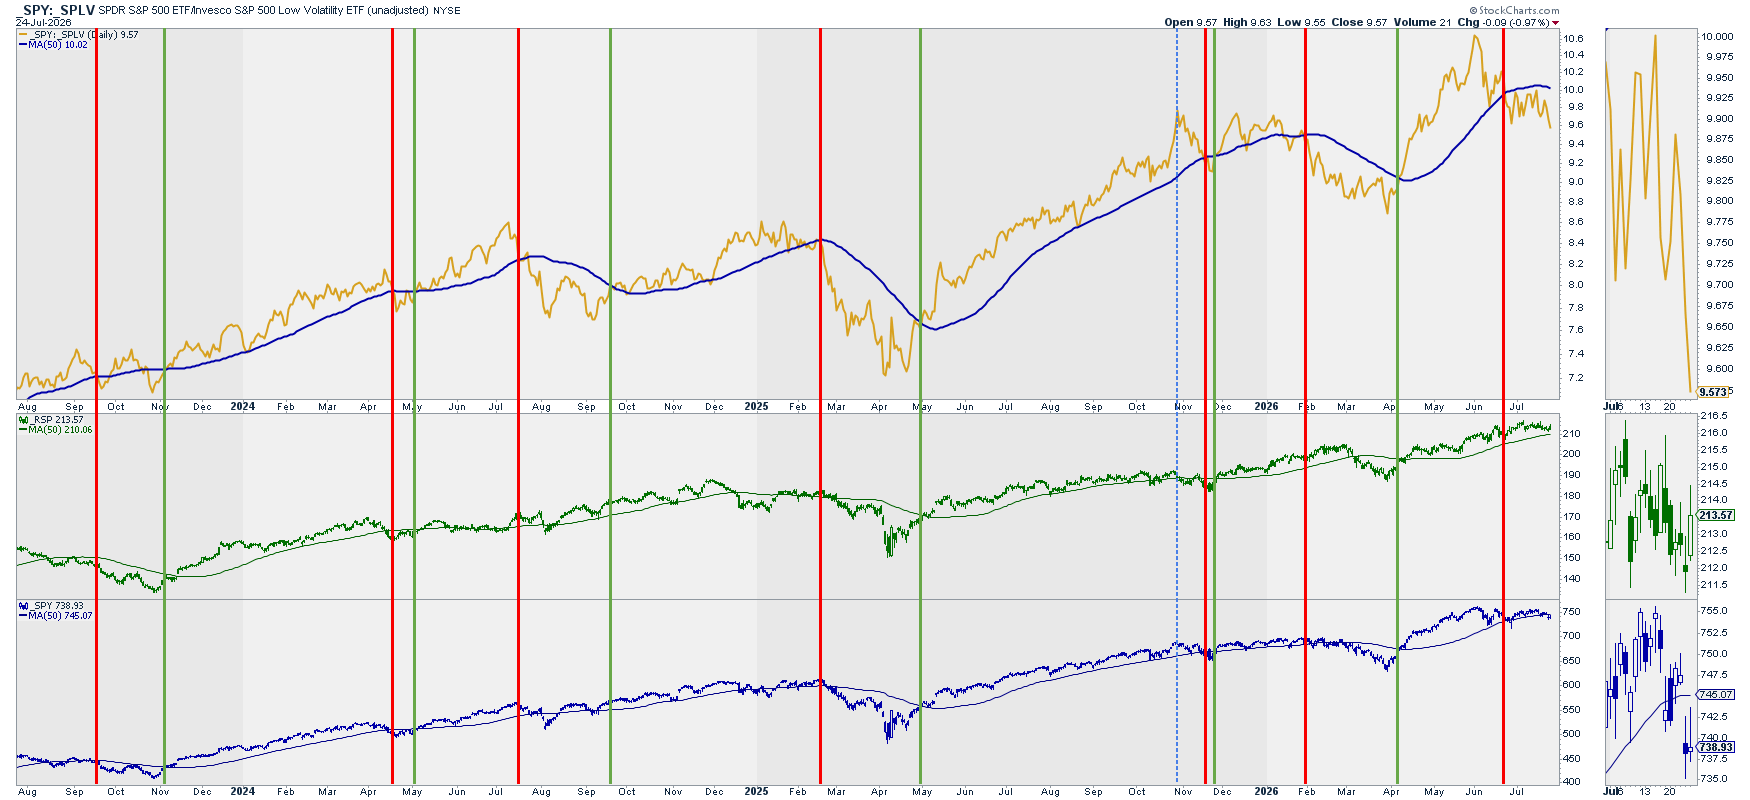
Analysis: The bearish signal is clear now with the ratio falling further away from its 50D SMA.
Outlook: Bearish
Volatility: VIX vs. RSP & SPY
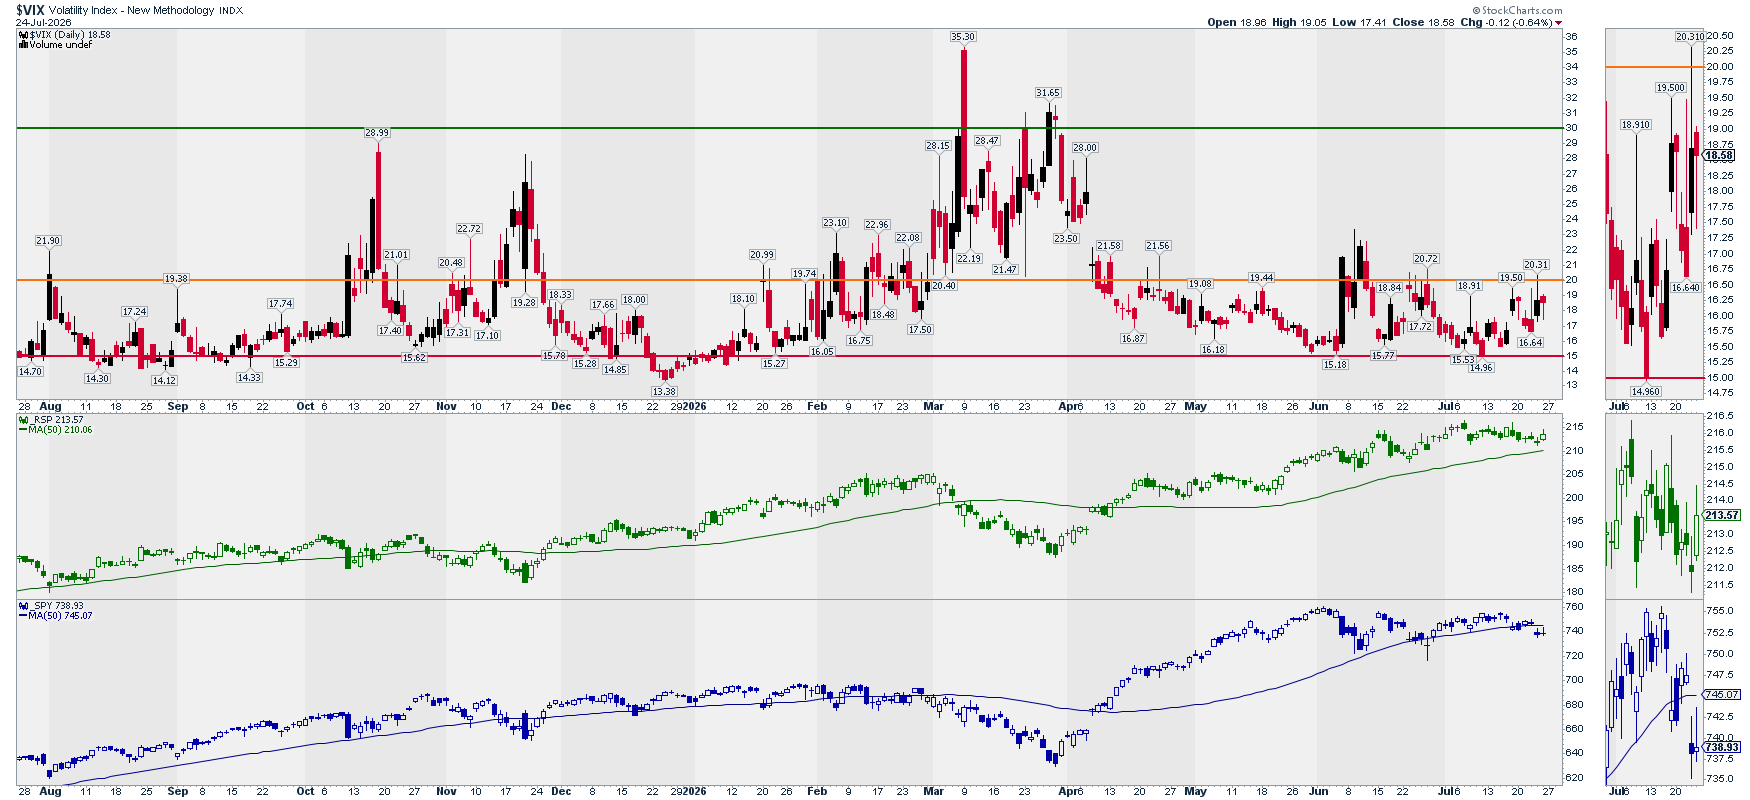
Note: This chart is mainly to detect extreme volatility situations that, once they reverse, offer great long opportunities in the market.
Analysis: VIX bounce back up to the 19 level. Elevated volatility shall be expected if the observed price trends continue bearish.
Options: (Inverted) Put/Call Ratio vs. SPY
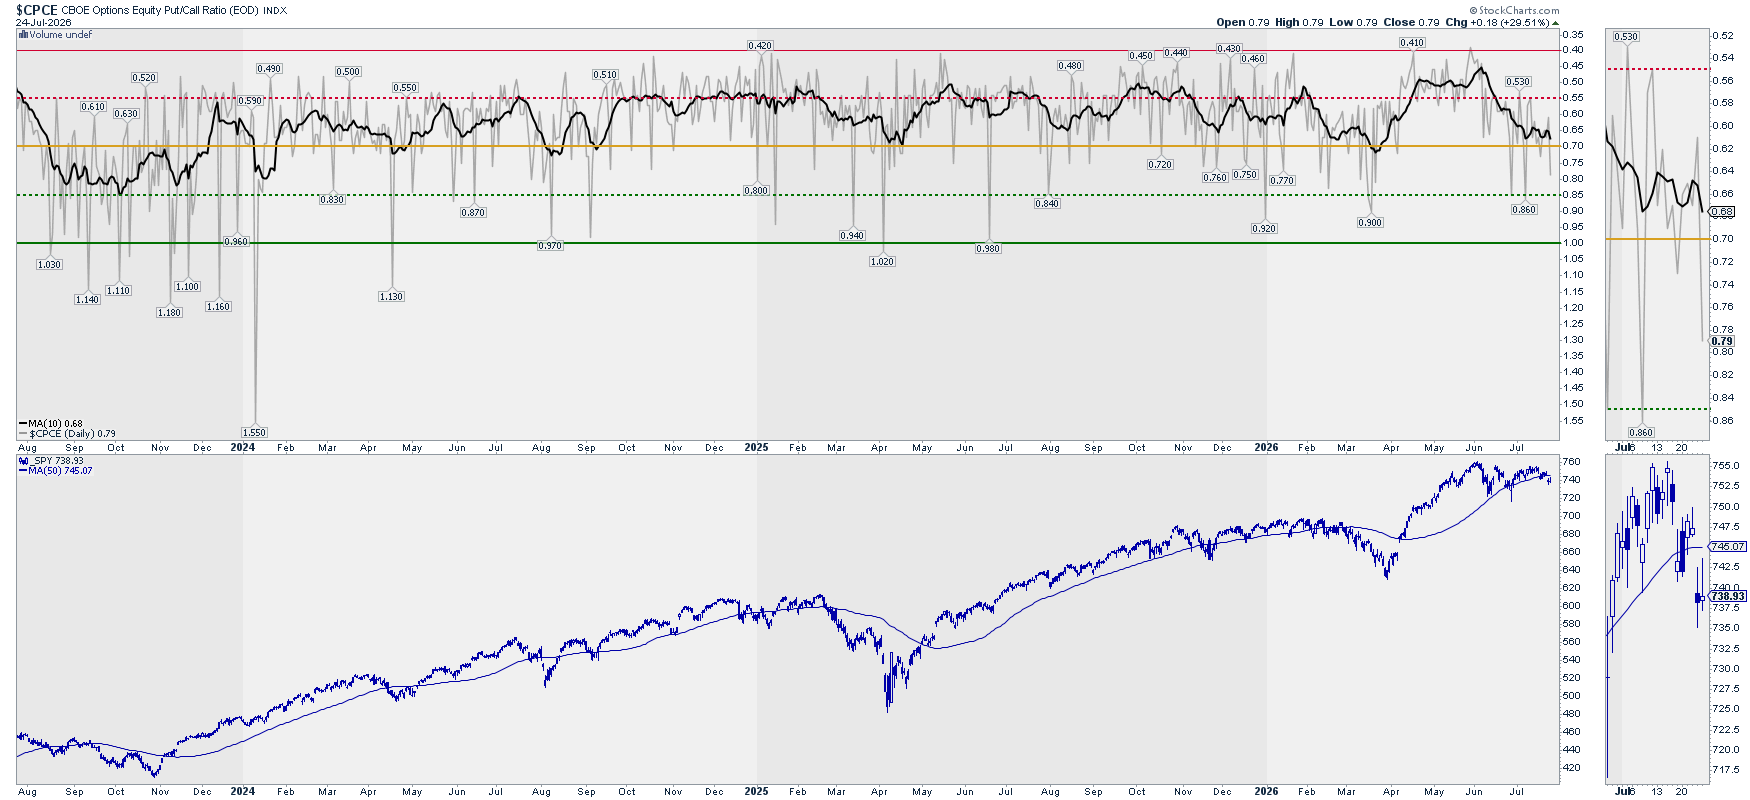
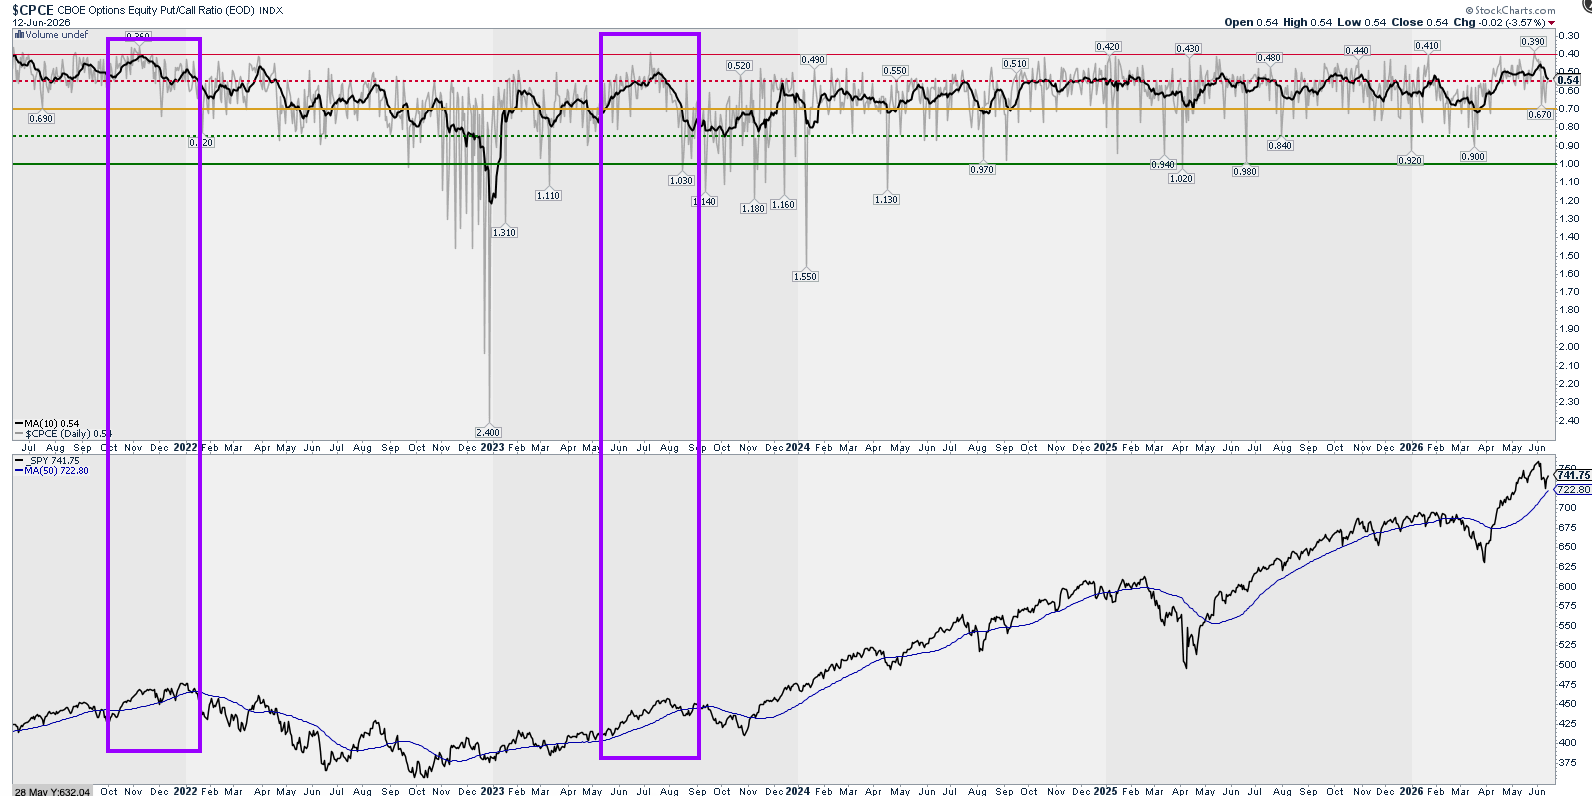
Analysis: P/C ratio continues its downward trend, as predicted. We will remain bearish until we don’t see this ratio improving.
Outlook: Bearish
Options: Gamma Exposure – SPY
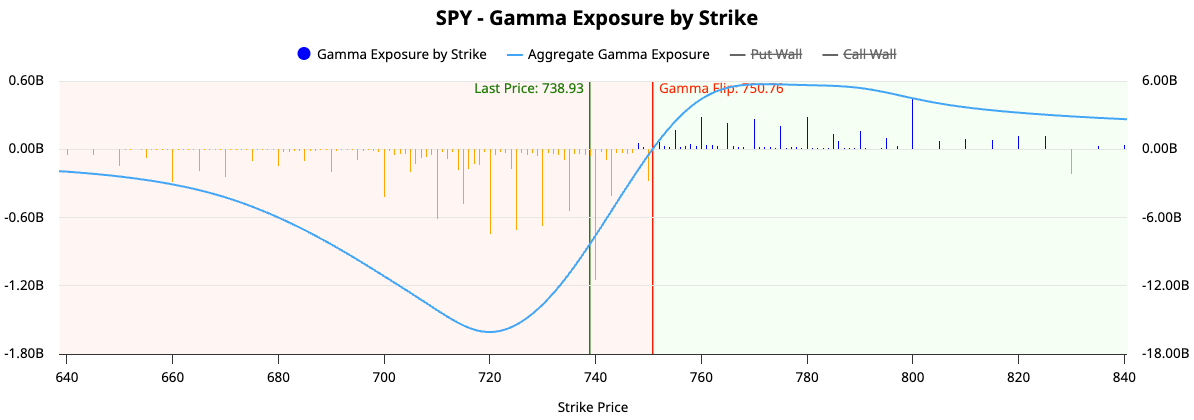
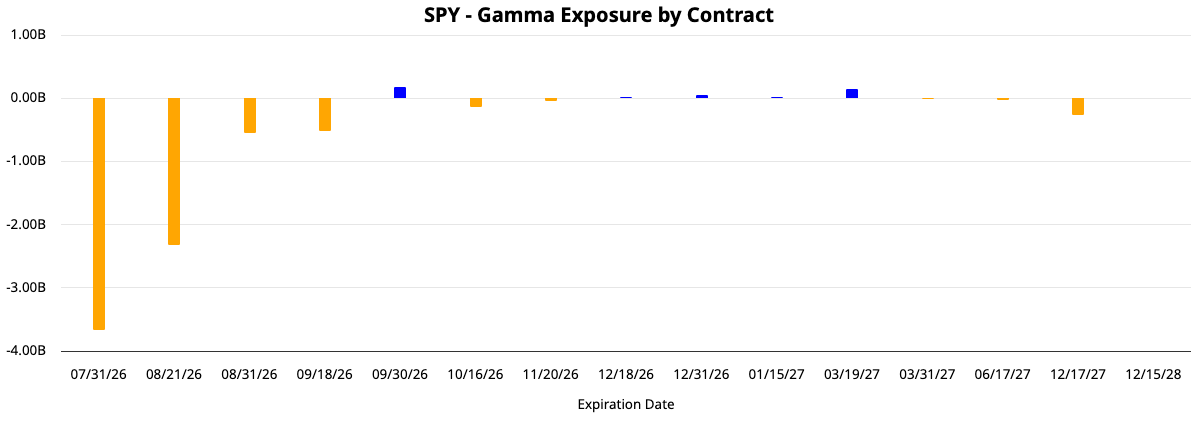
Analysis: GEX in clear negative territory with negative outlook for August.
Outlook: Bearish
Market: What is happening? Summary
Price Action: Distribution (Bearish trend, momentum, and money flow)
Breadth: Broadening
Volatility: Bearish
Options: Bearish
Sectors: Where is it happening?
Sectors Rotation
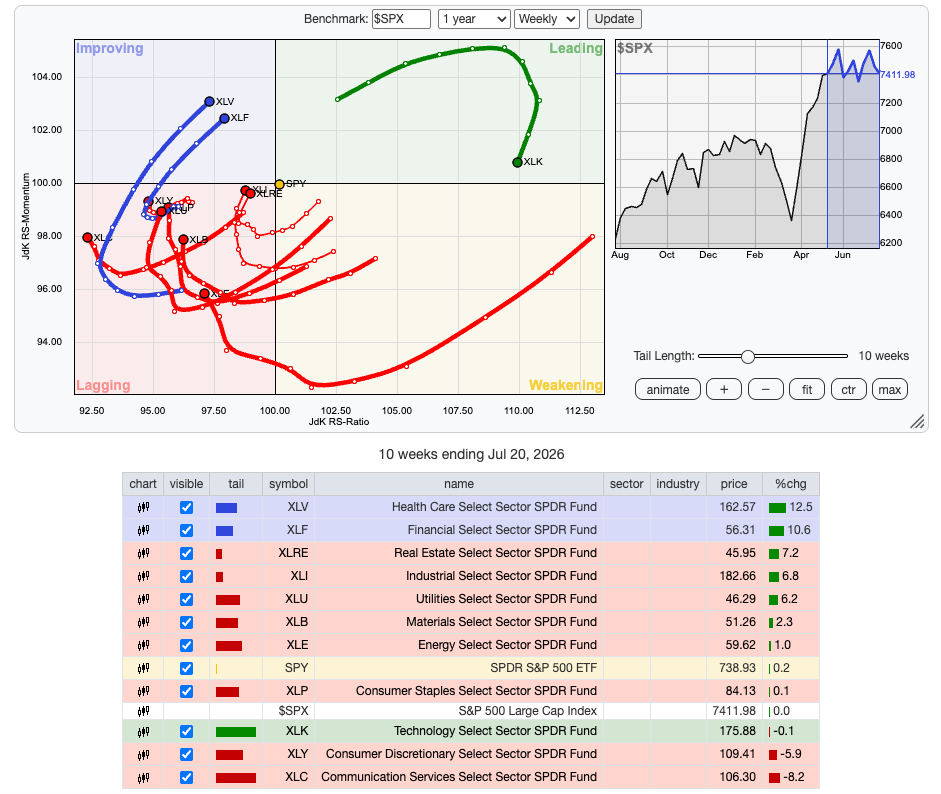
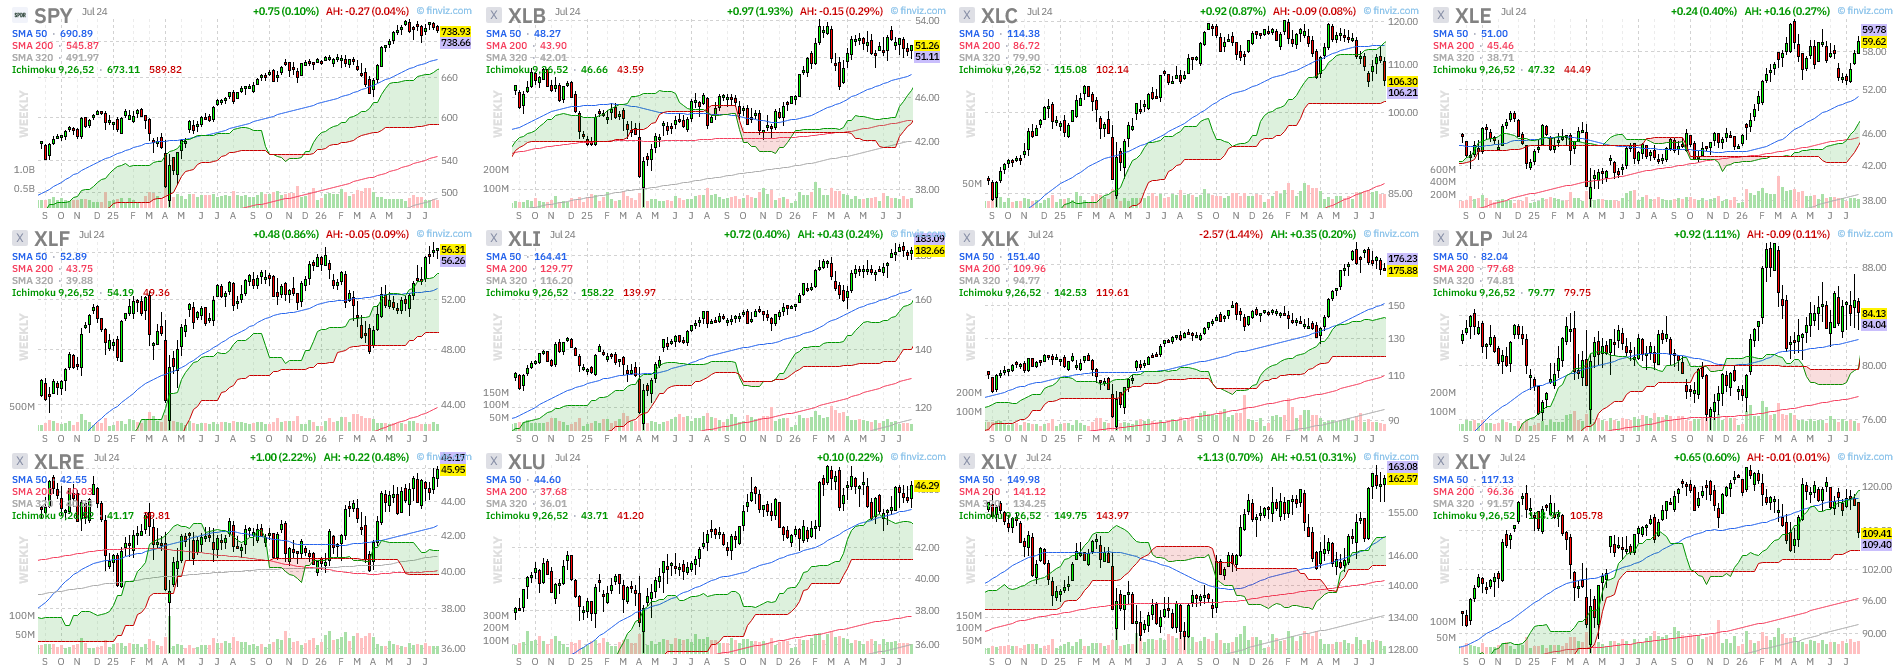
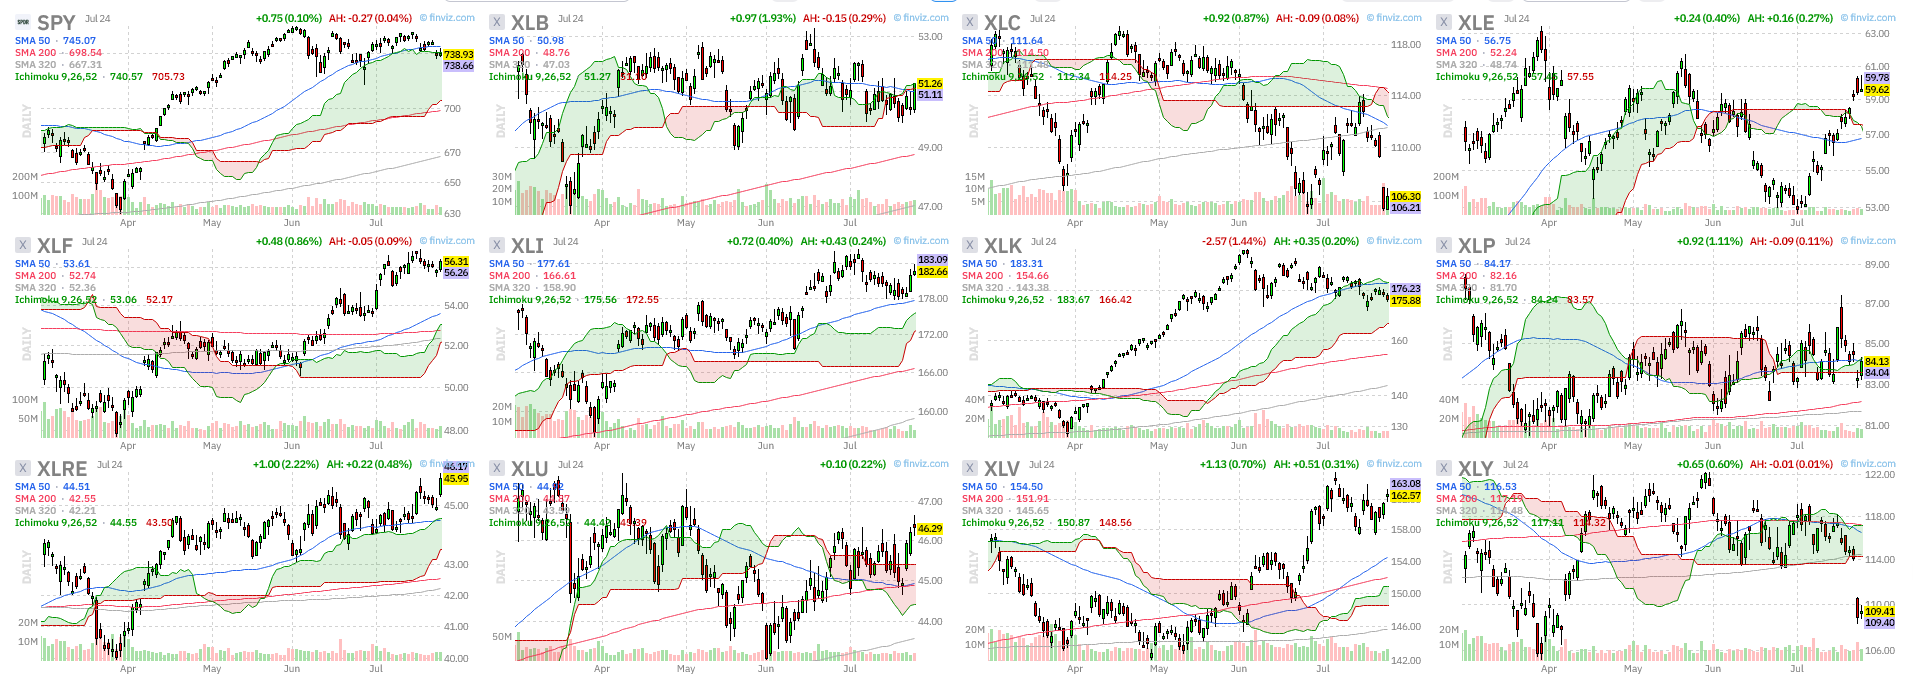
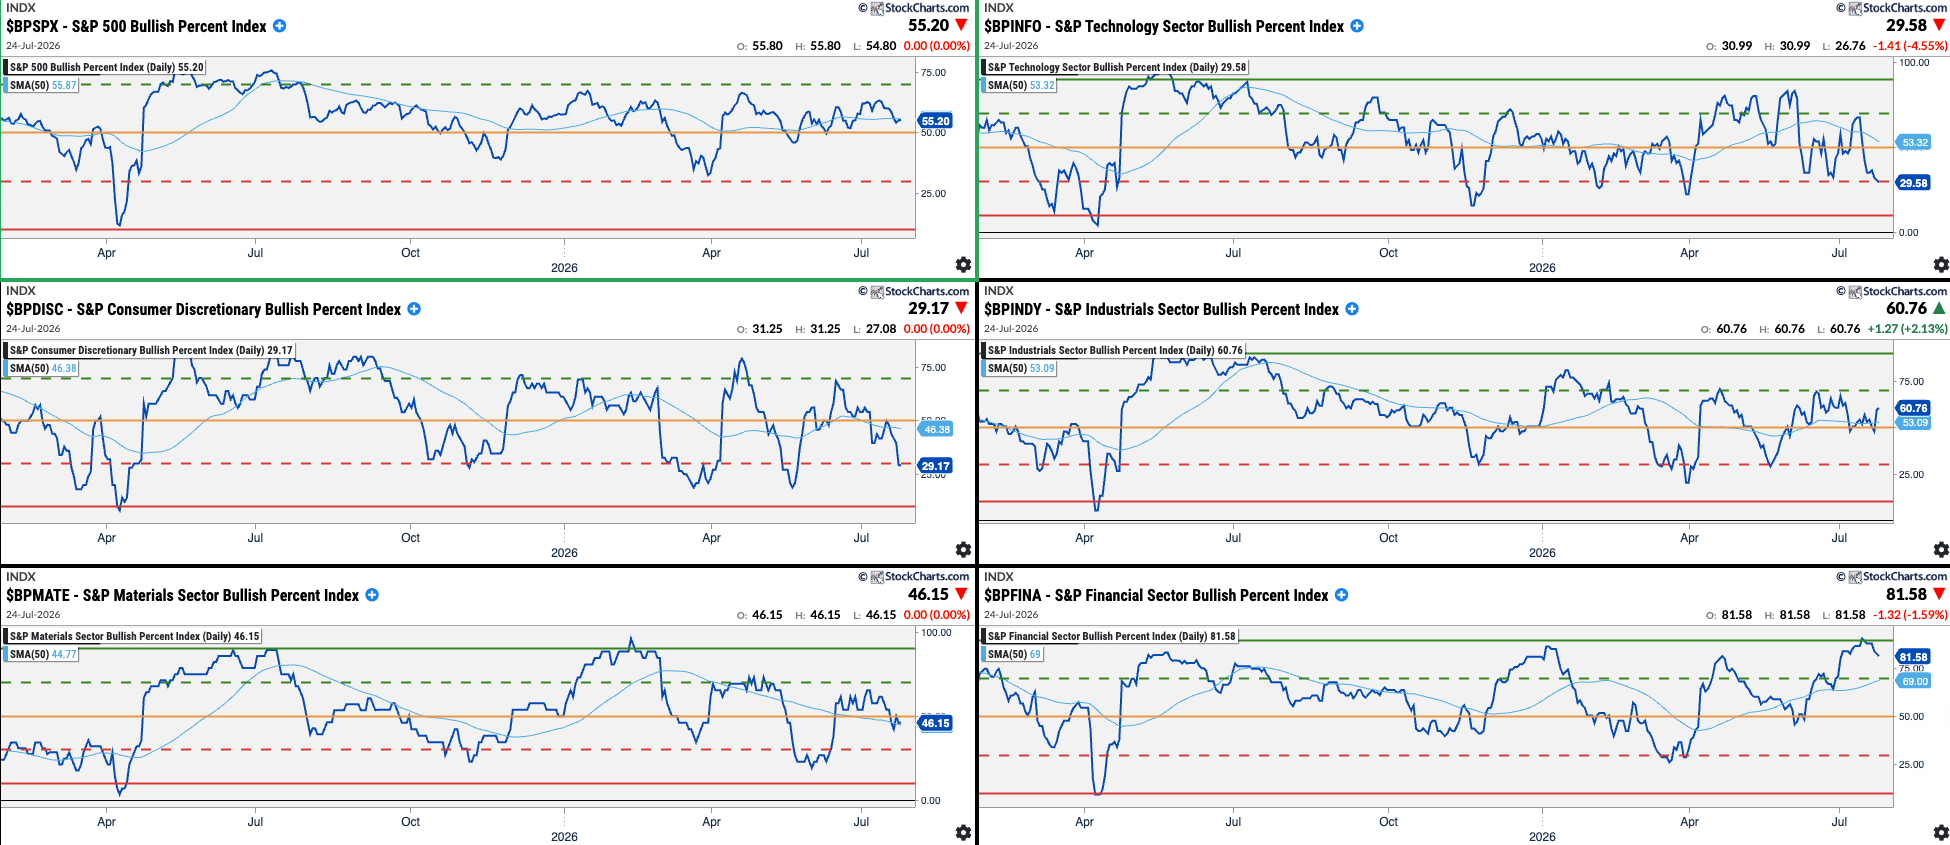
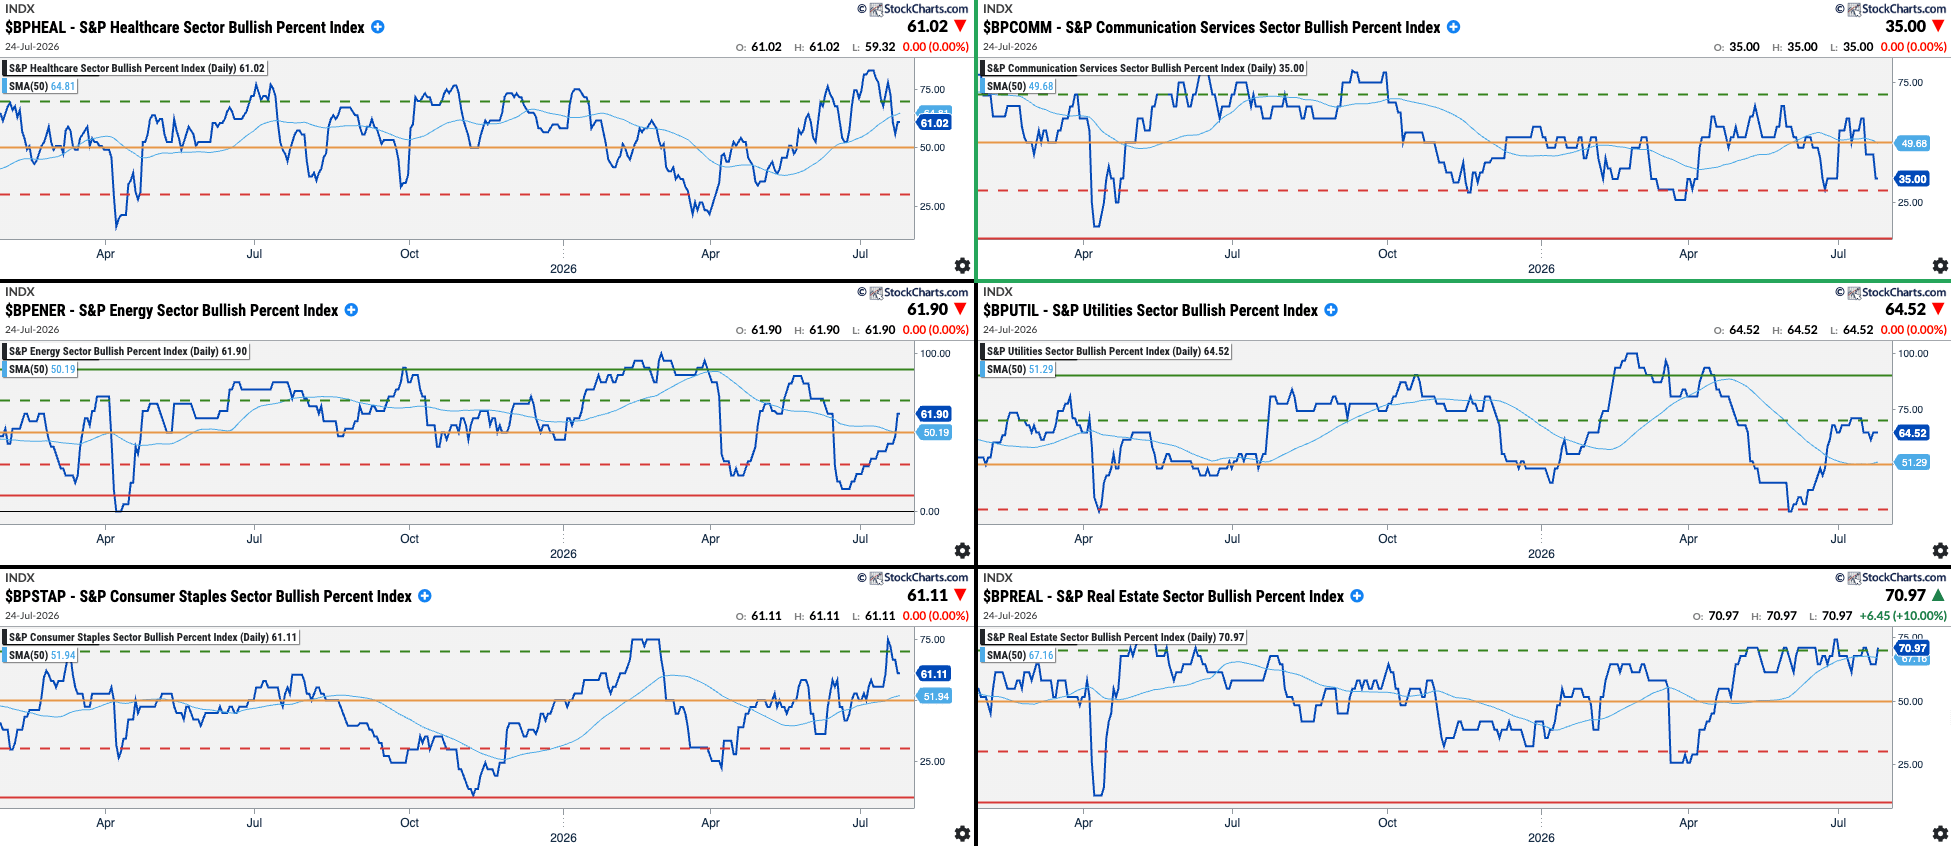
Analysis: Focus on XLV and XLF for mid- to long-term opportunities. XLE is heavily influenced by Iran’s war and oil’s price.
SPX Pct. Bullish Indicator shows us a Bullish Outlook.
Scanners: Scanning for opportunities
S&P500 and Nasdaq New Highs in Leading Sectors
Descriptive
Index: S&P 500 and Nasdaq | Market Cap.: +Mid (+$2B) | Option/Short: Yes/Yes
Avg. Volume: >1M | Price: >$10
(order by Market Cap desc.)
Technical
50-Day New High
XLV: Healthcare:
None
XLF: Financials:

Disclaimer: The content on AMAT Investing is strictly for educational and learning purposes. The author is not a licensed financial advisor and holds no formal financial education. This post does not constitute professional financial advice. All investing involves risk of loss. Always conduct your own research and consult a licensed professional before making any investment decisions.