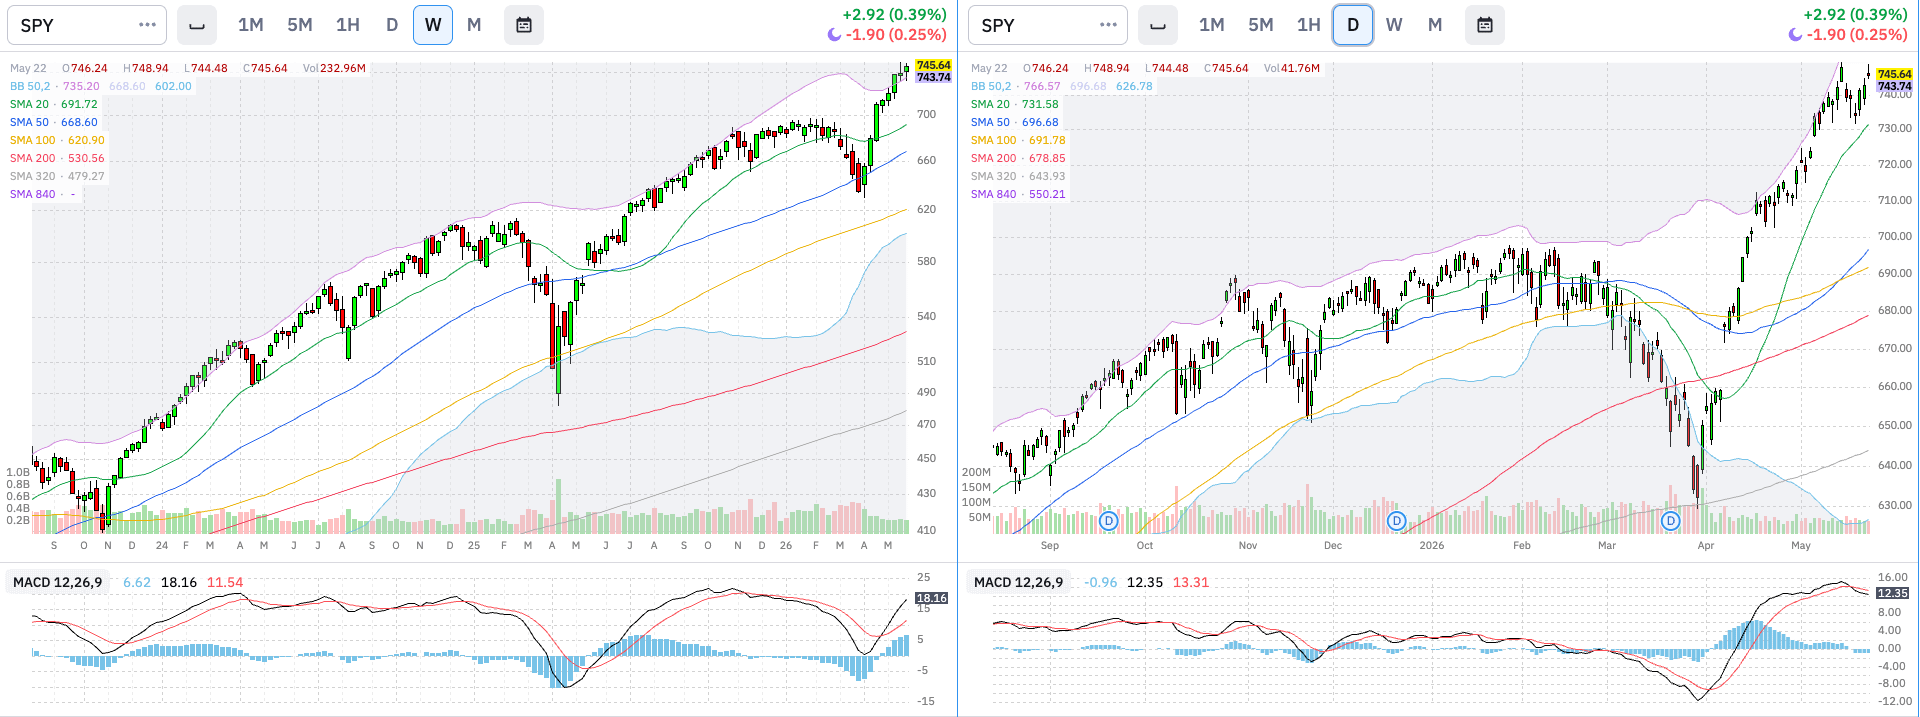
Last Week’s Comment: A MACD on a bear setup and a double top occurring at ATH on a rally with lower volume than average… but trends go longer than anyone expects.
Level 1: Why is it happening?
Economic Data: Production: ISM PMI vs. SPX
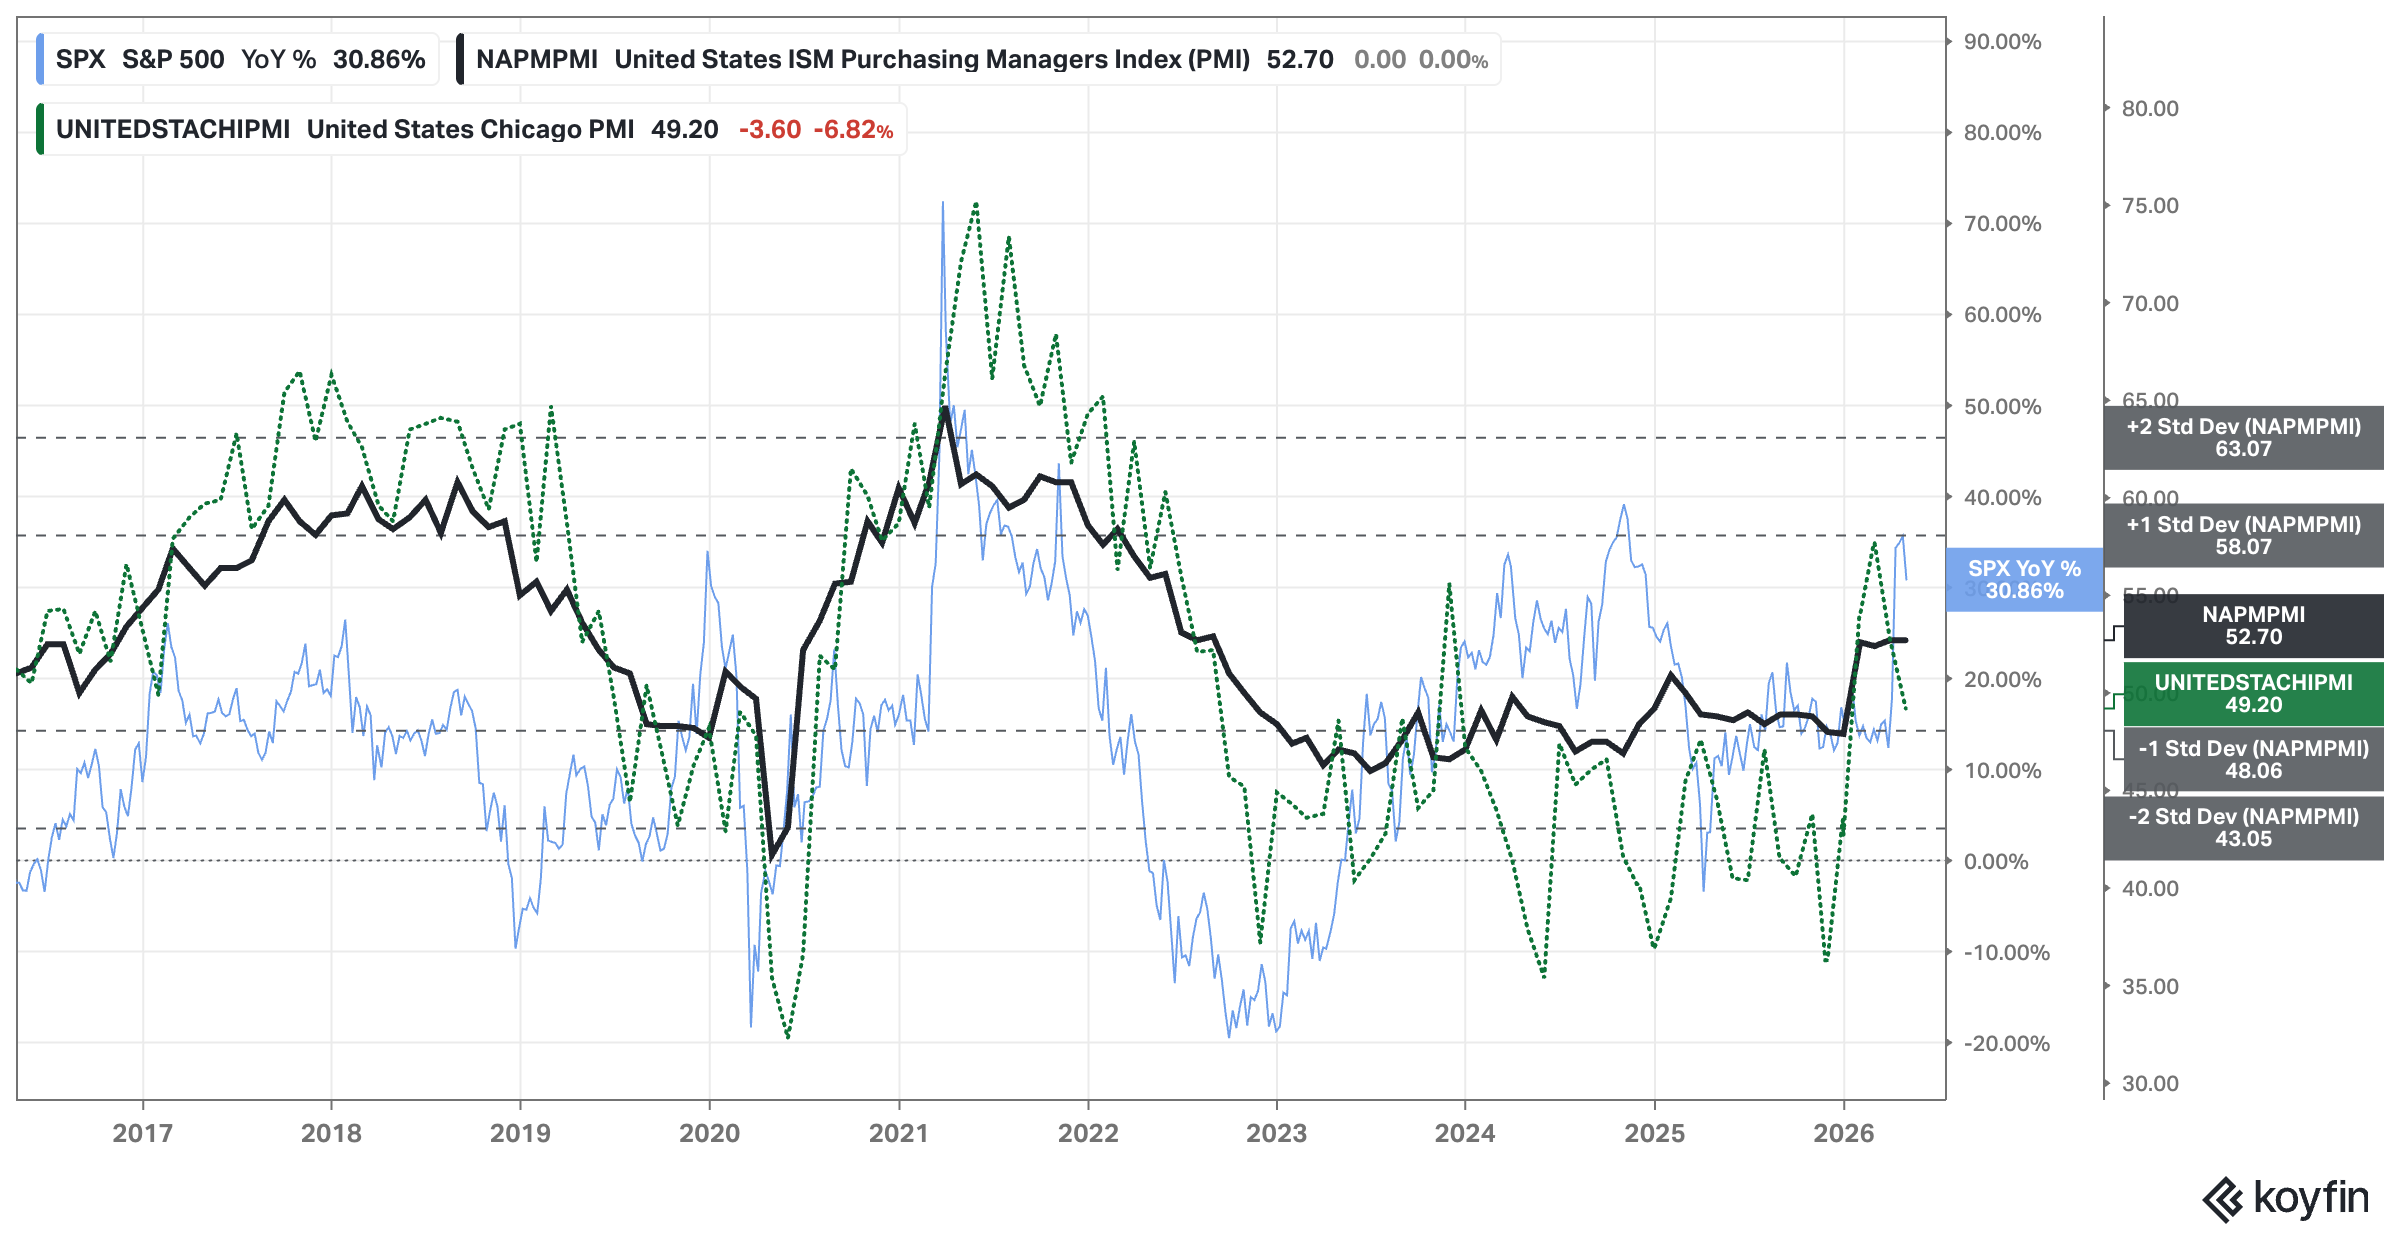
Analysis: No changes since last week.
Outlook: Bullish
Economic Data: Production: Dallas & Philadelphia Manufacturing vs. SPX
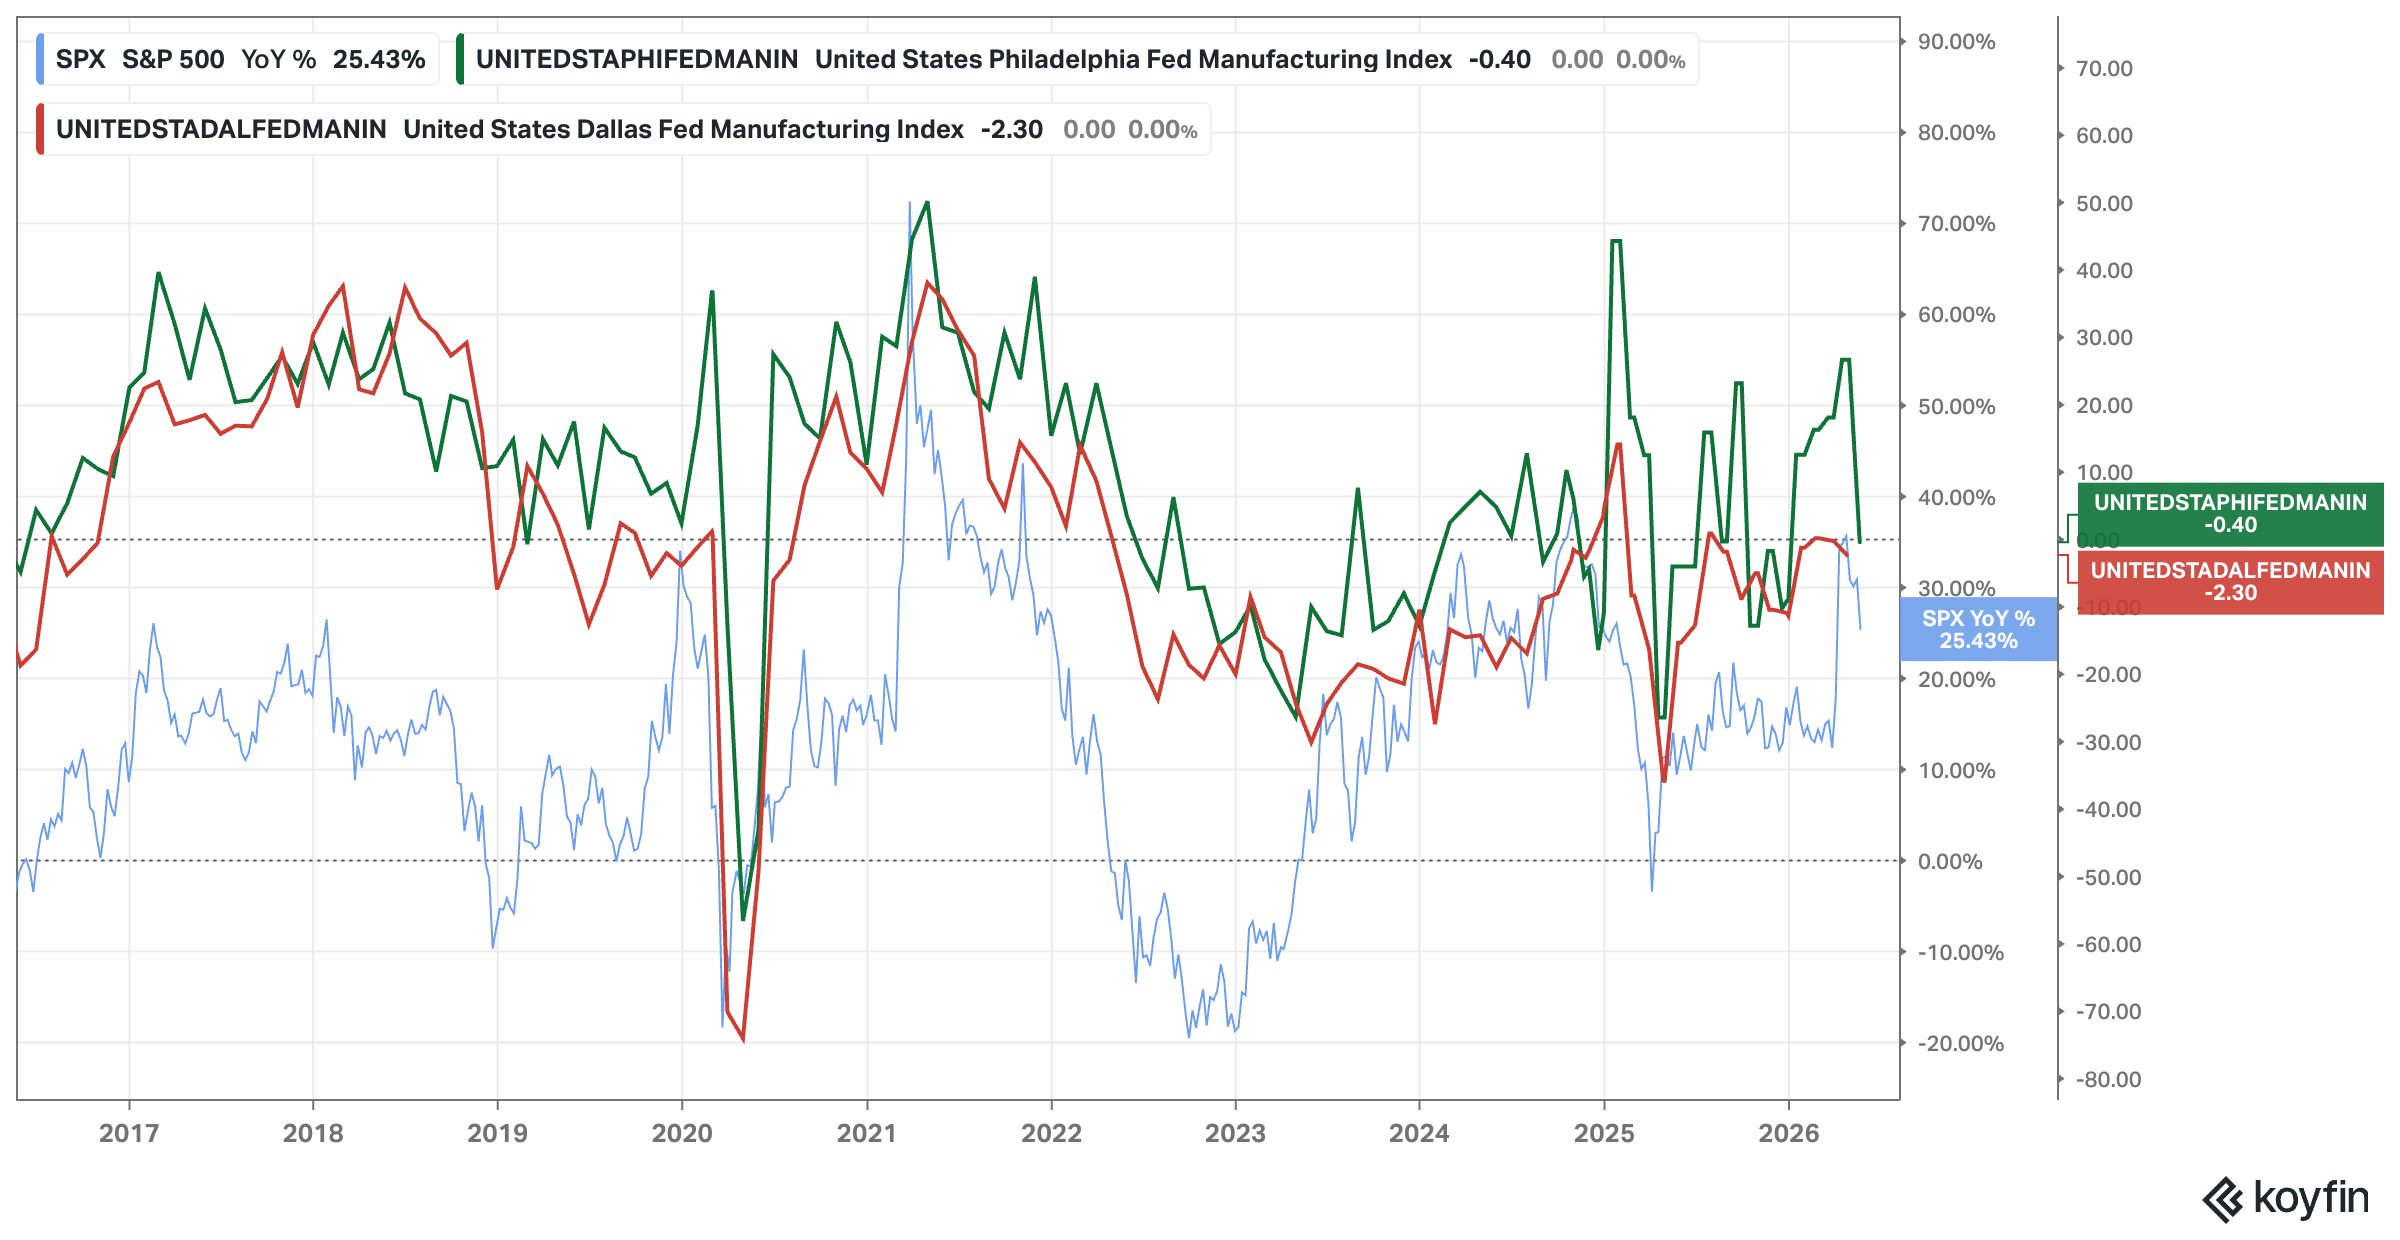
Analysis: Sharp decline in Philadelphia’s manufacturing index.
Outlook: Neutral to Bearish
Economic Data: Consumption: Consumer Sentiment
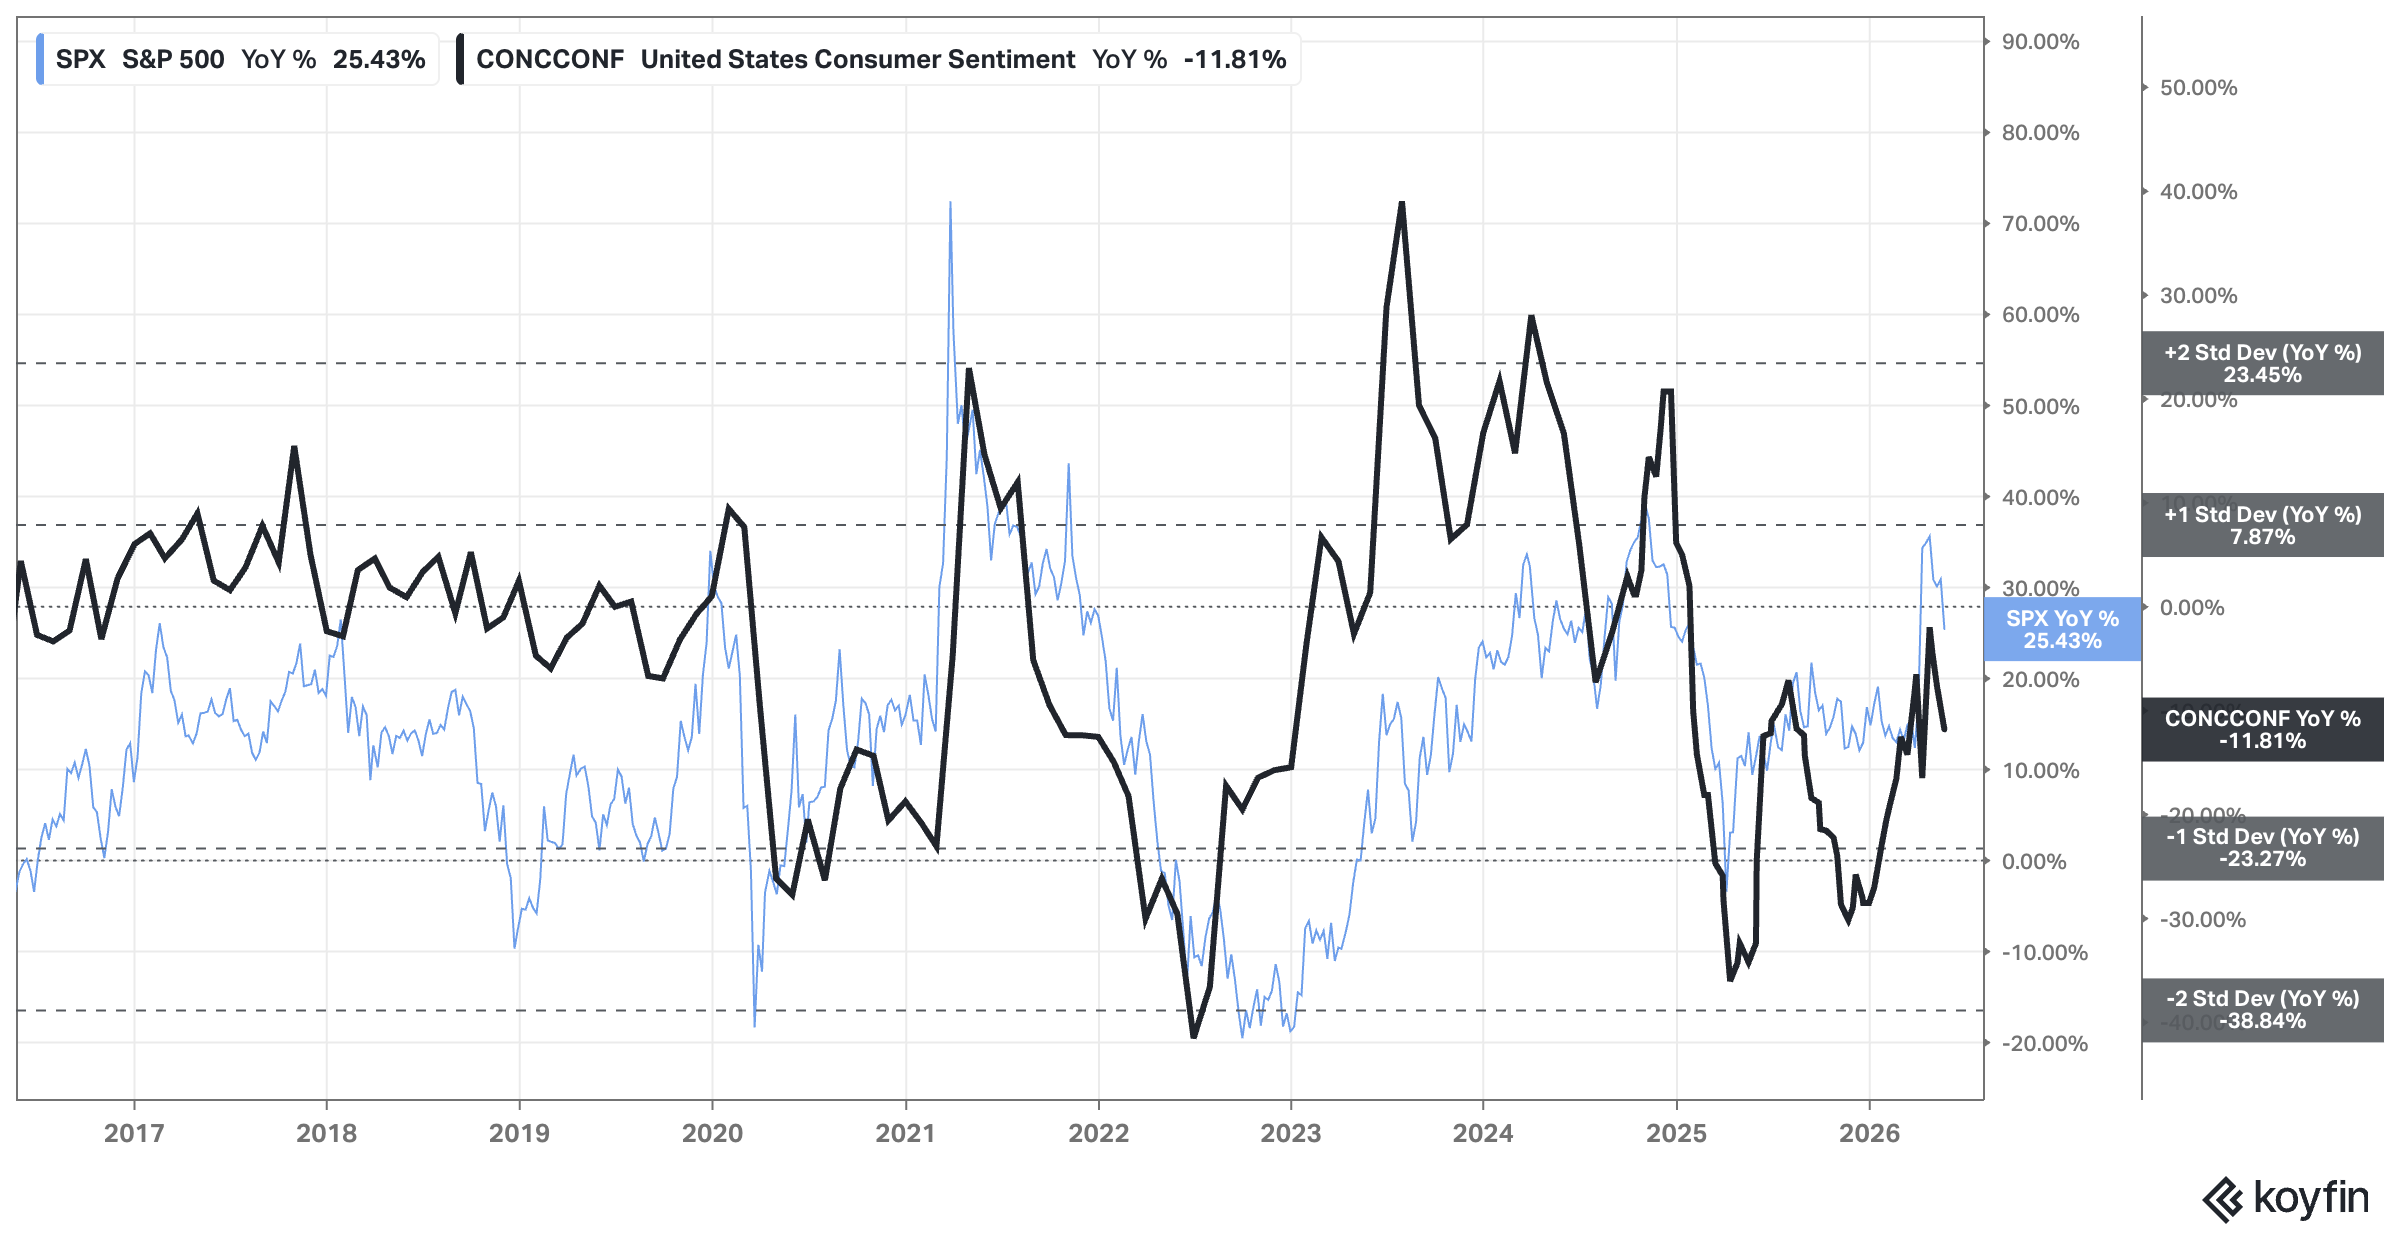
Analysis: Sentiment continues to decrease (yet this data series is based on online surveys and heavily politically biased). Yet this week we had bad forward guidance by Walmart, warning about the pain the consumer is experiencing due to inflation.
Outlook: Neutral
USD & Interest Rates: FED, 2yr, 10yr, and 30yr Rates
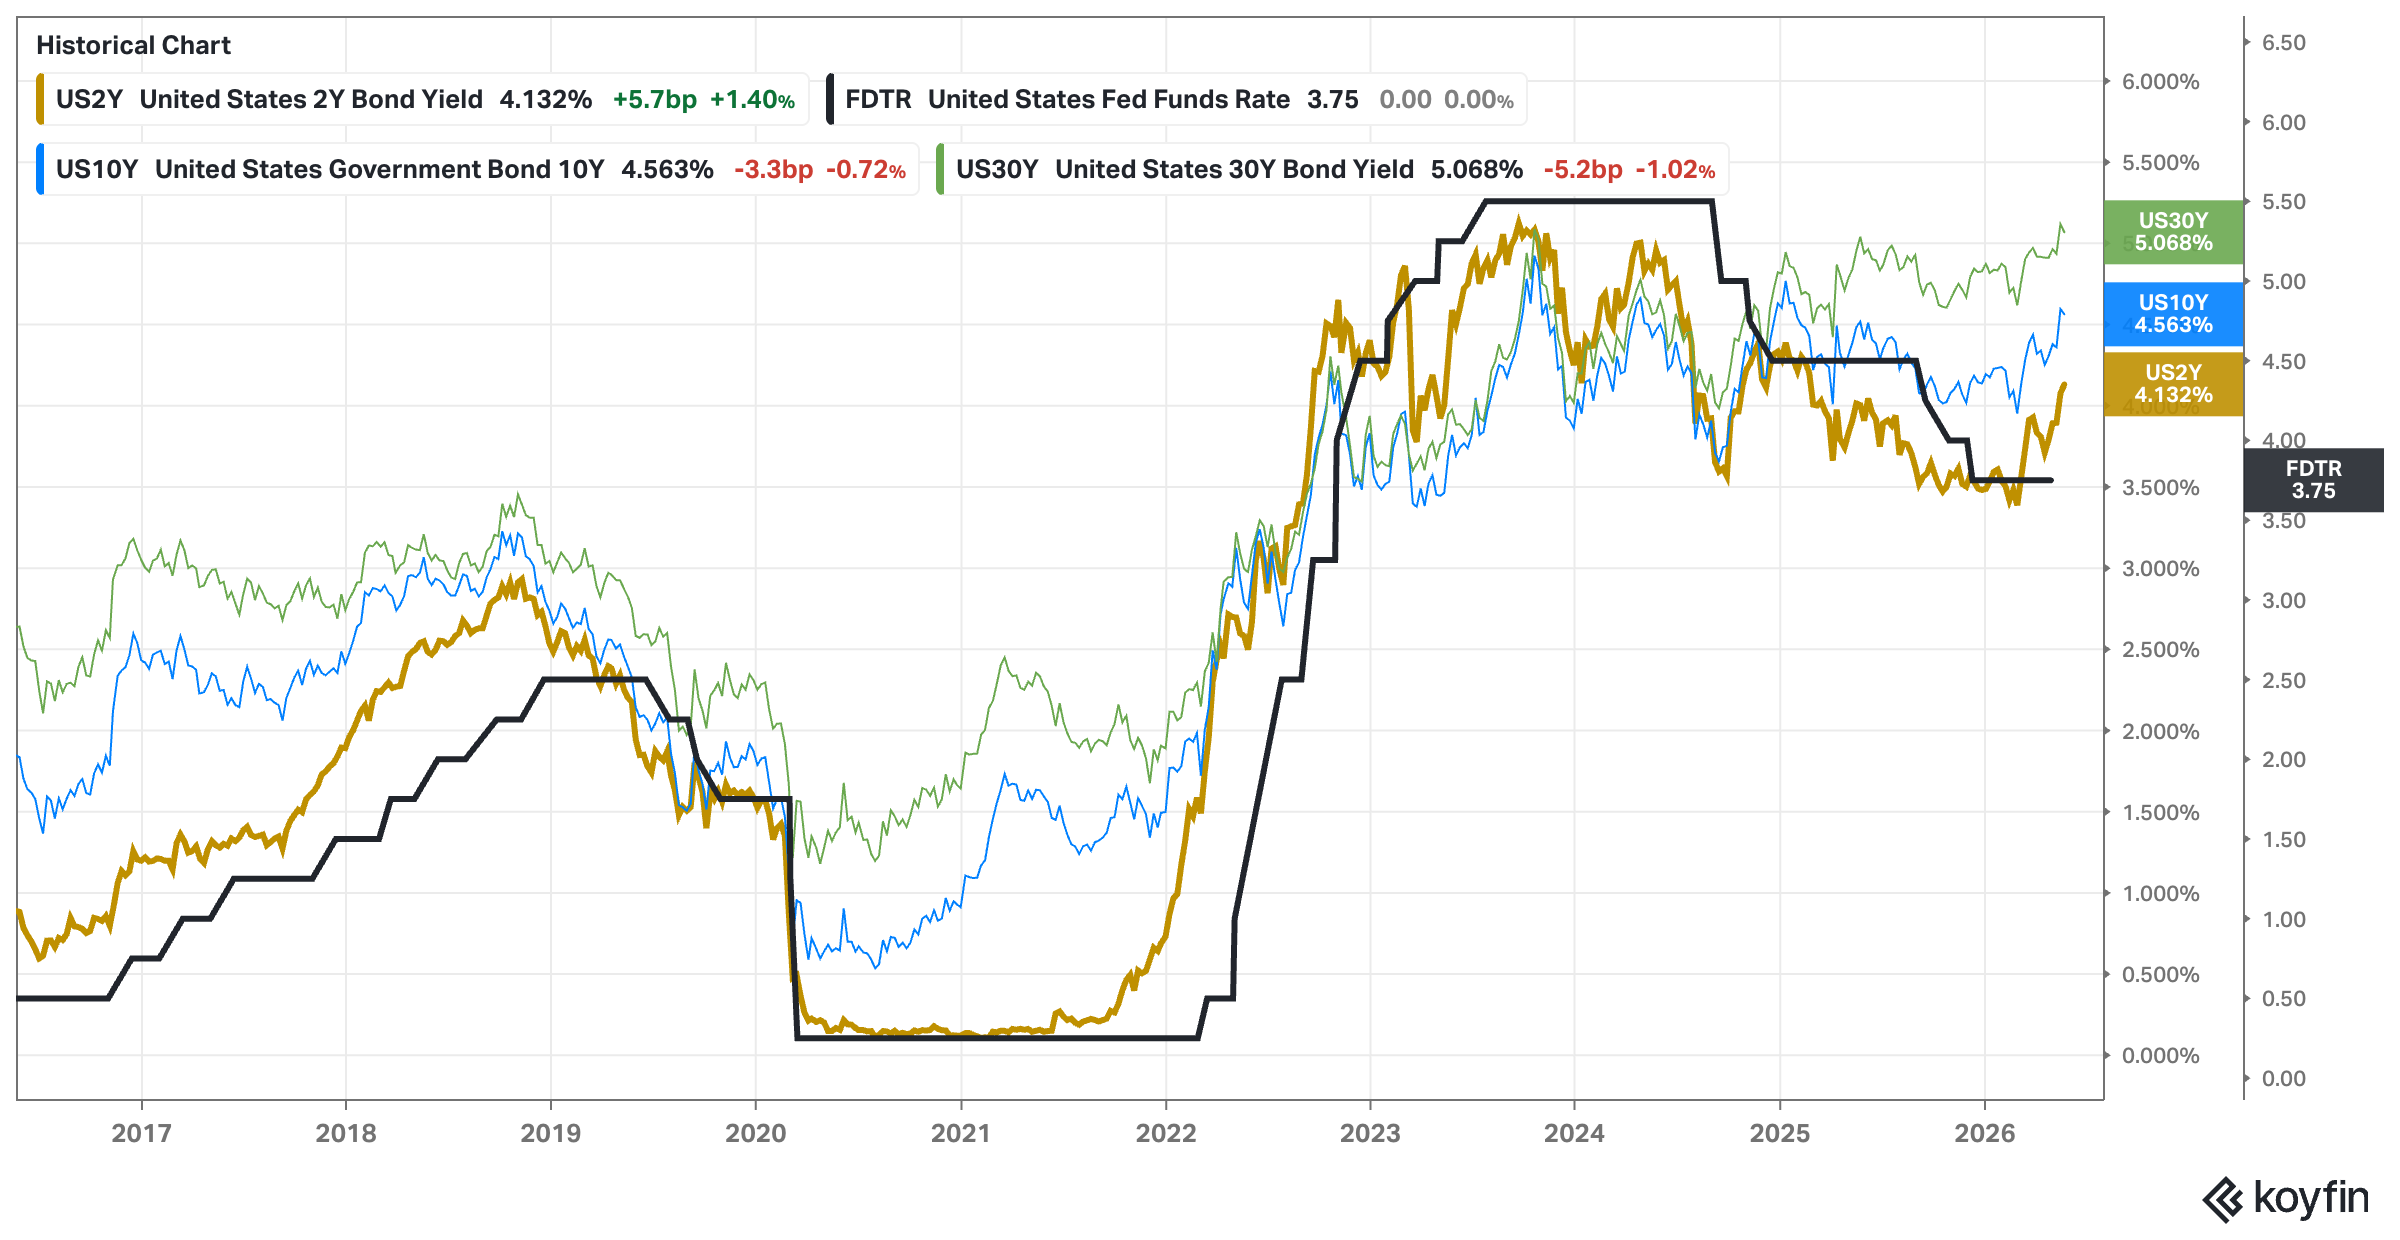
Analysis: Slight reduction on rates, yet elevated in comparison with Fed’s reference rate. If the Fed is forced to elevate the rates it could be bad for stocks.
Outlook: Bearish
USD & Interest Rates: USD vs EEM ILF and S&P500
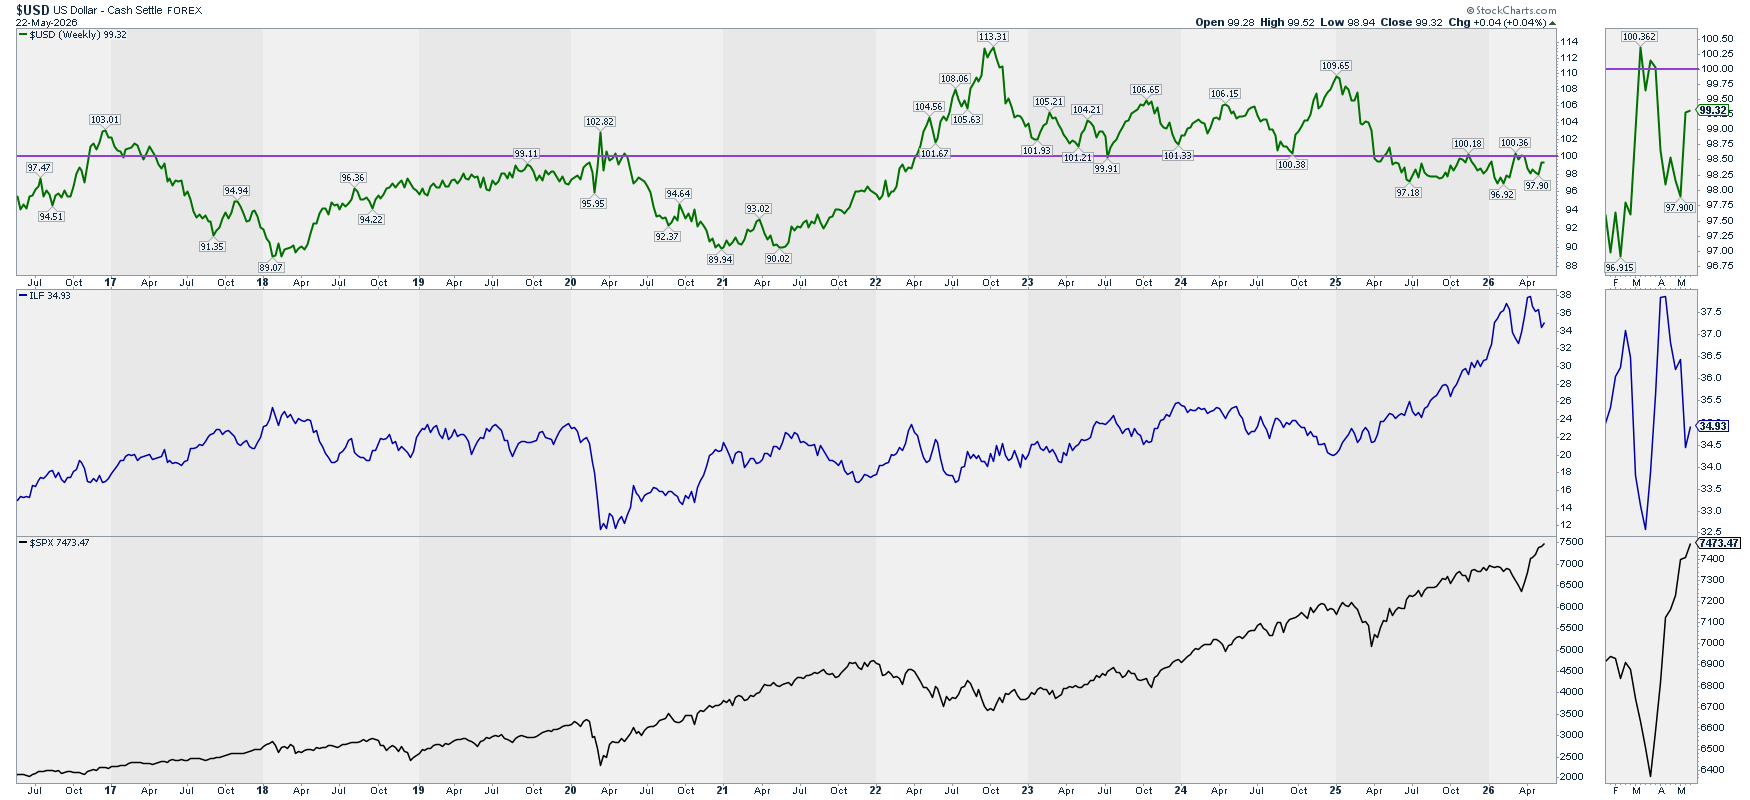
Analysis: USD up = ILF down. A long war is not a great outlook for ILF.
Outlook: Neutral (the longer the war the higher the oil & gas disruption)
Context Investors Sentiment: Credit Spreads
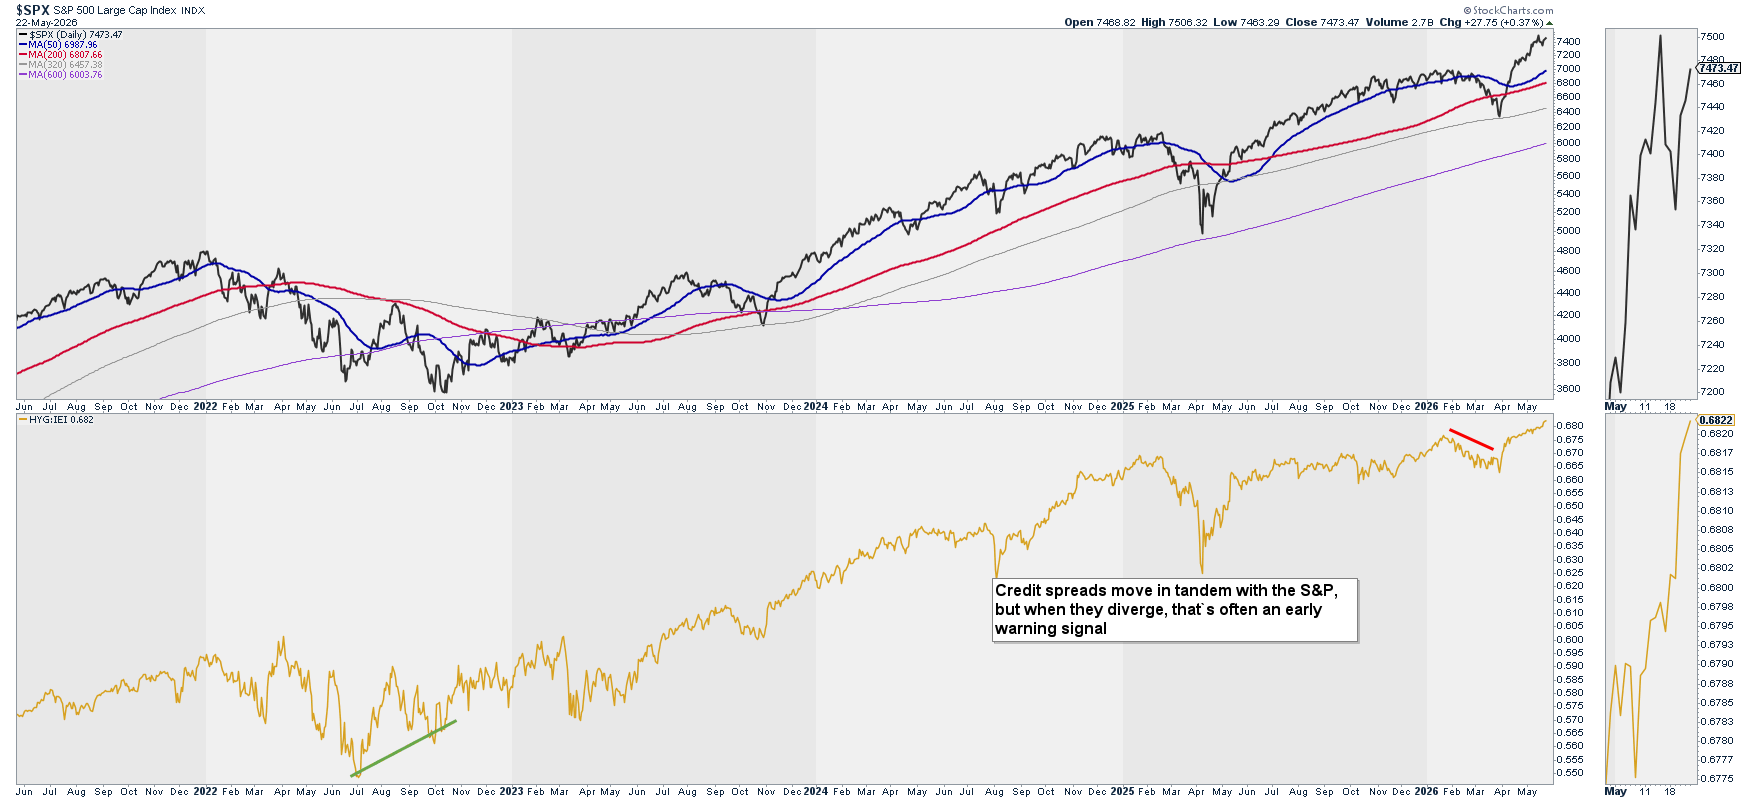
Credit spreads move in tandem with the S&P, but when they diverge, that’s often an early warning signal.
Analysis: Sharp increase in Spreads. I keep the bullish outlook.
Outlook: Bullish
Level 1: Why is it happening? Summary
Economic Data (long-term): Neutral
USD & Interest Rates: Bearish (due to Interest Rates)
Investors Sentiment: Bullish
What is happening? – Level 2
Price Action: SPX – Long Trend – 20 & 10 years
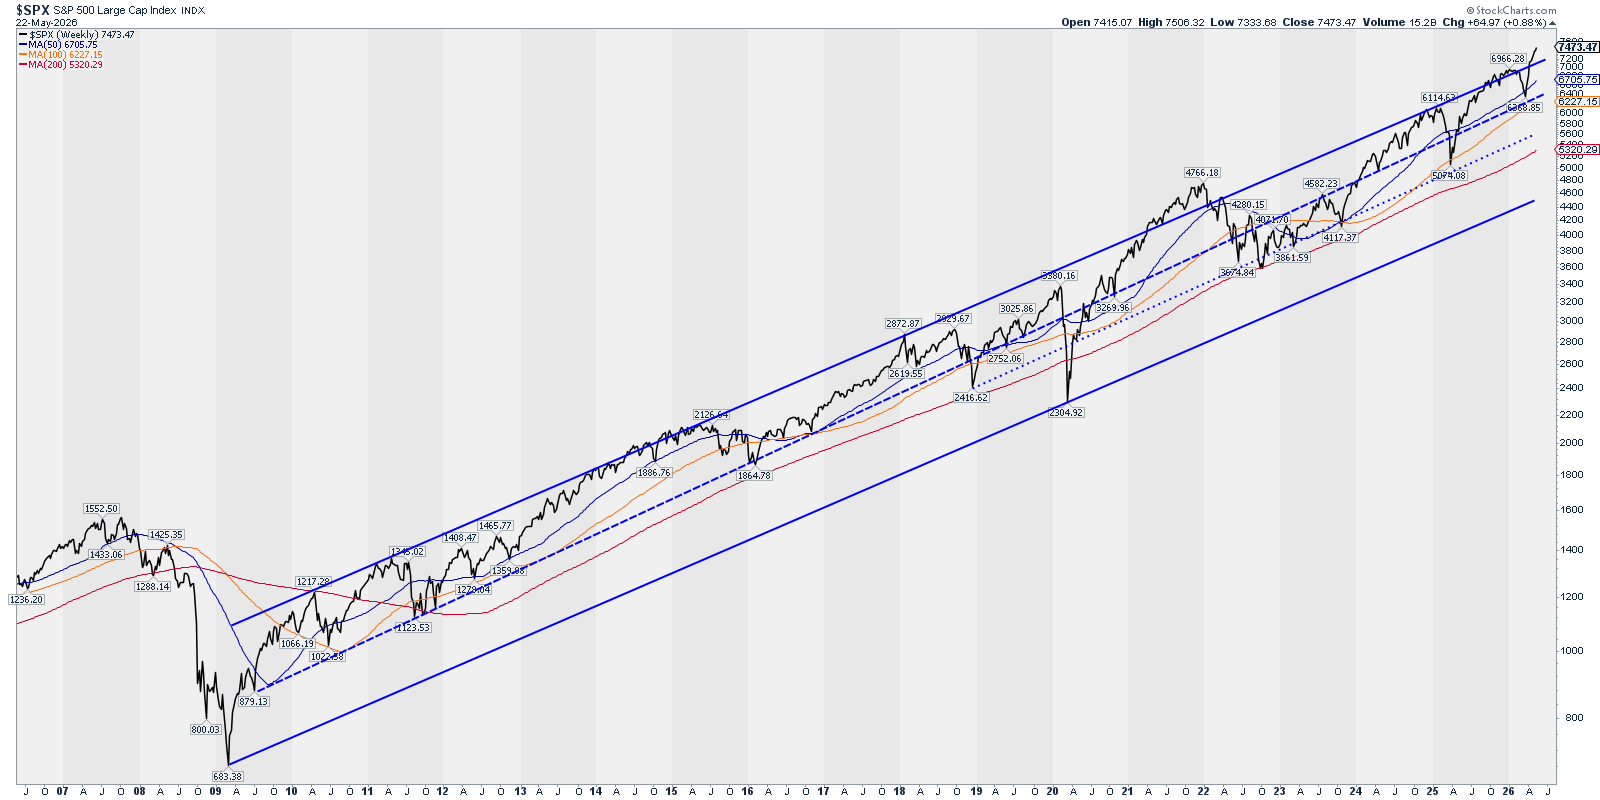
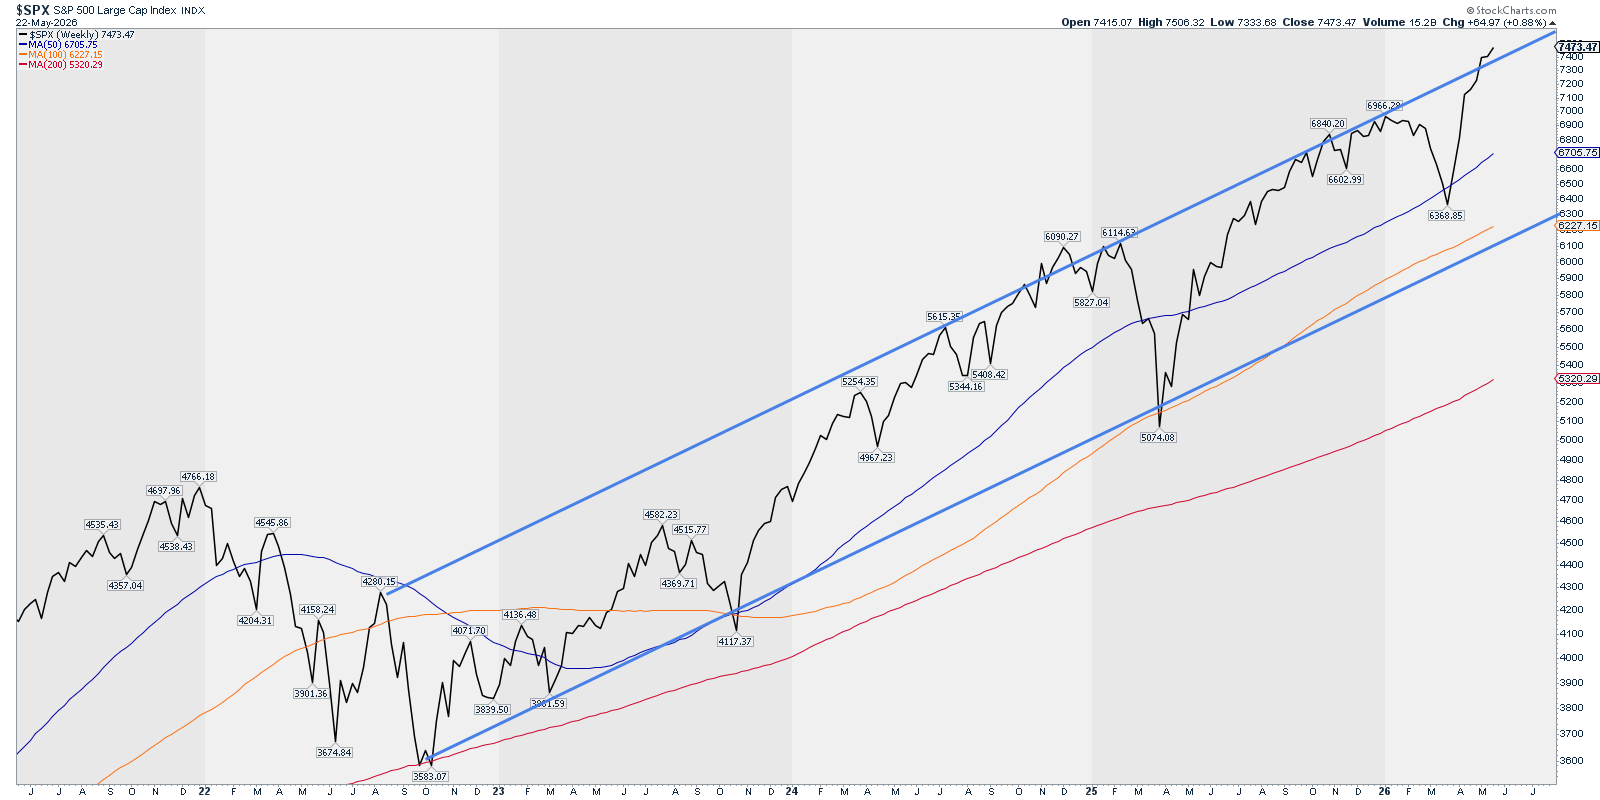
Analysis: Both channels broken on the upper side. Despite the action being bullish, this shall be considered late in the cycle and our outlook shall be bearish. We shall be selling positions here, not entering new ones.
Outlook: Bearish
Price Action: RSP – Trend – Weekly & Daily
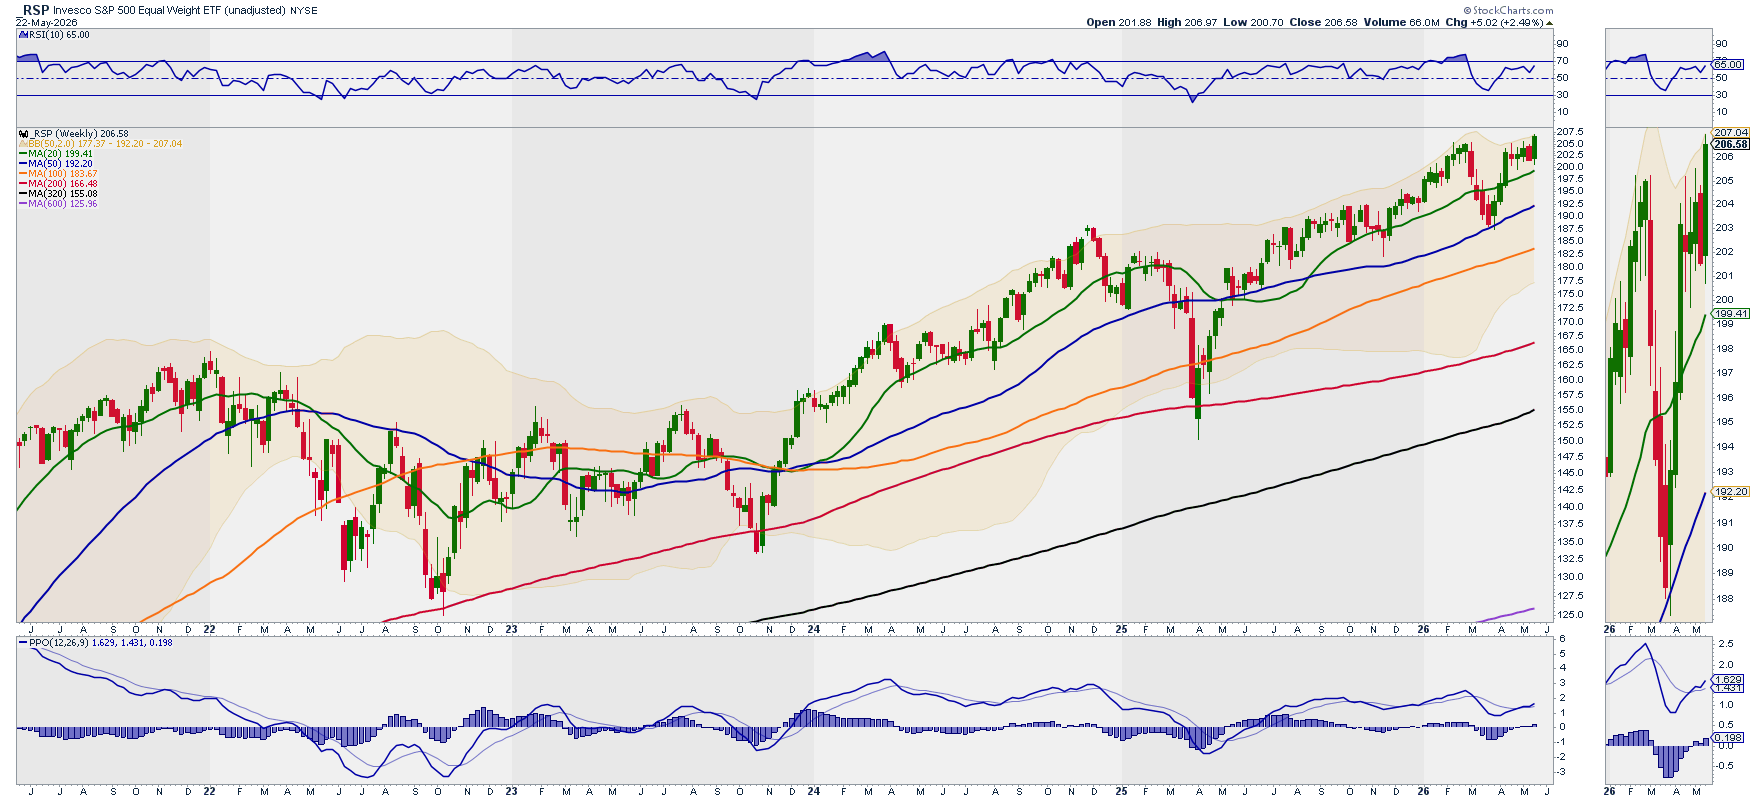
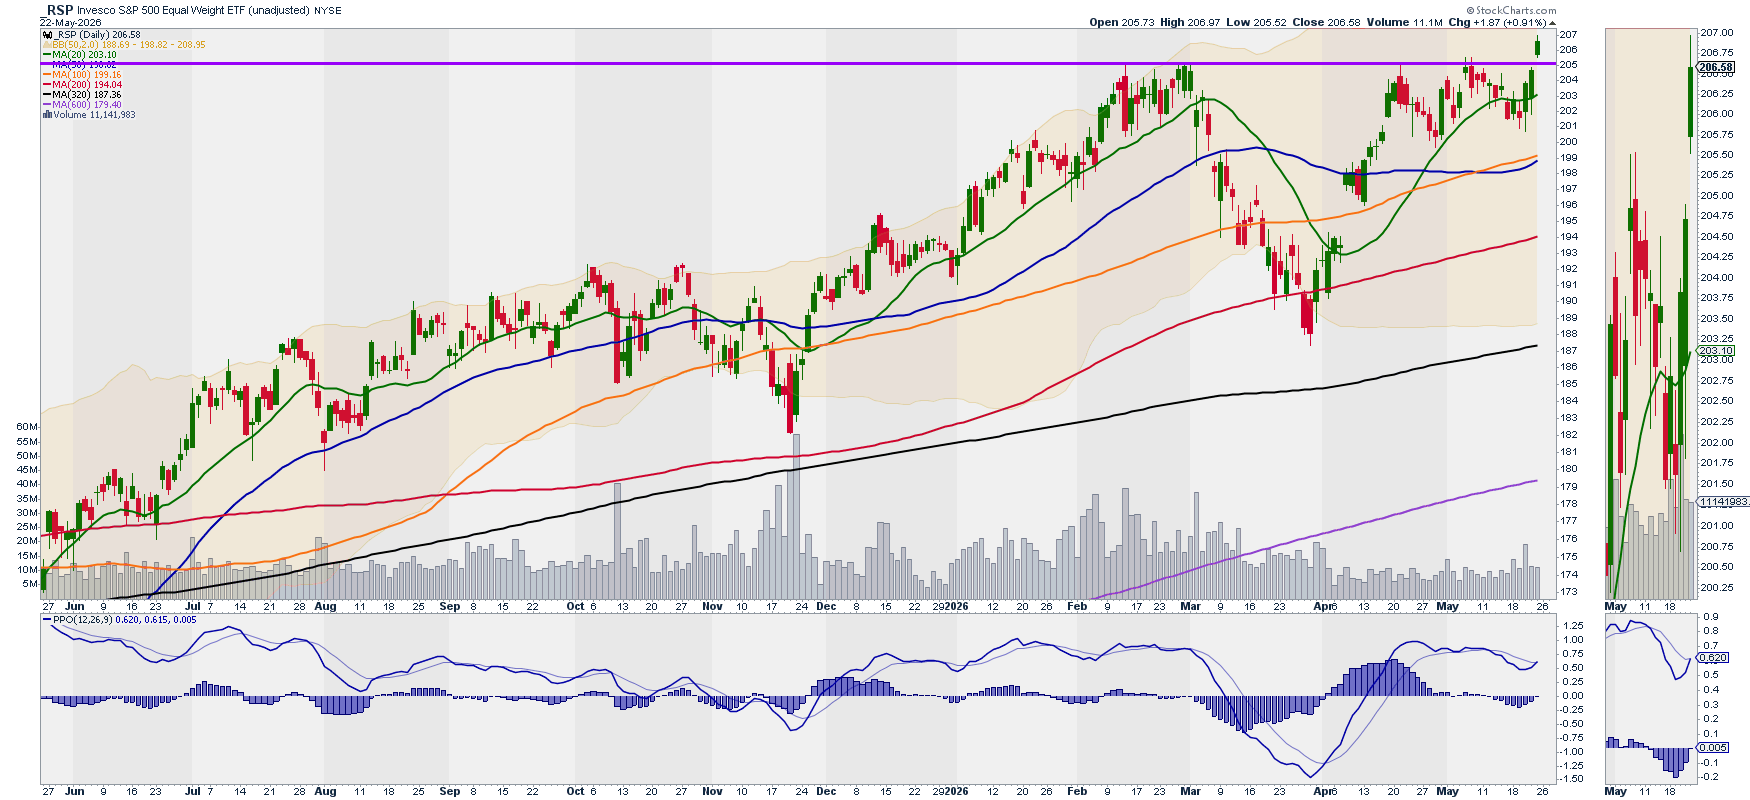
Analysis: Price (equal weight index) jumped above previous S/R level. If sustained could signal a bullish move to new ATH. I’m improving the outlook from Bearish to Neutral
Outlook: Neutral
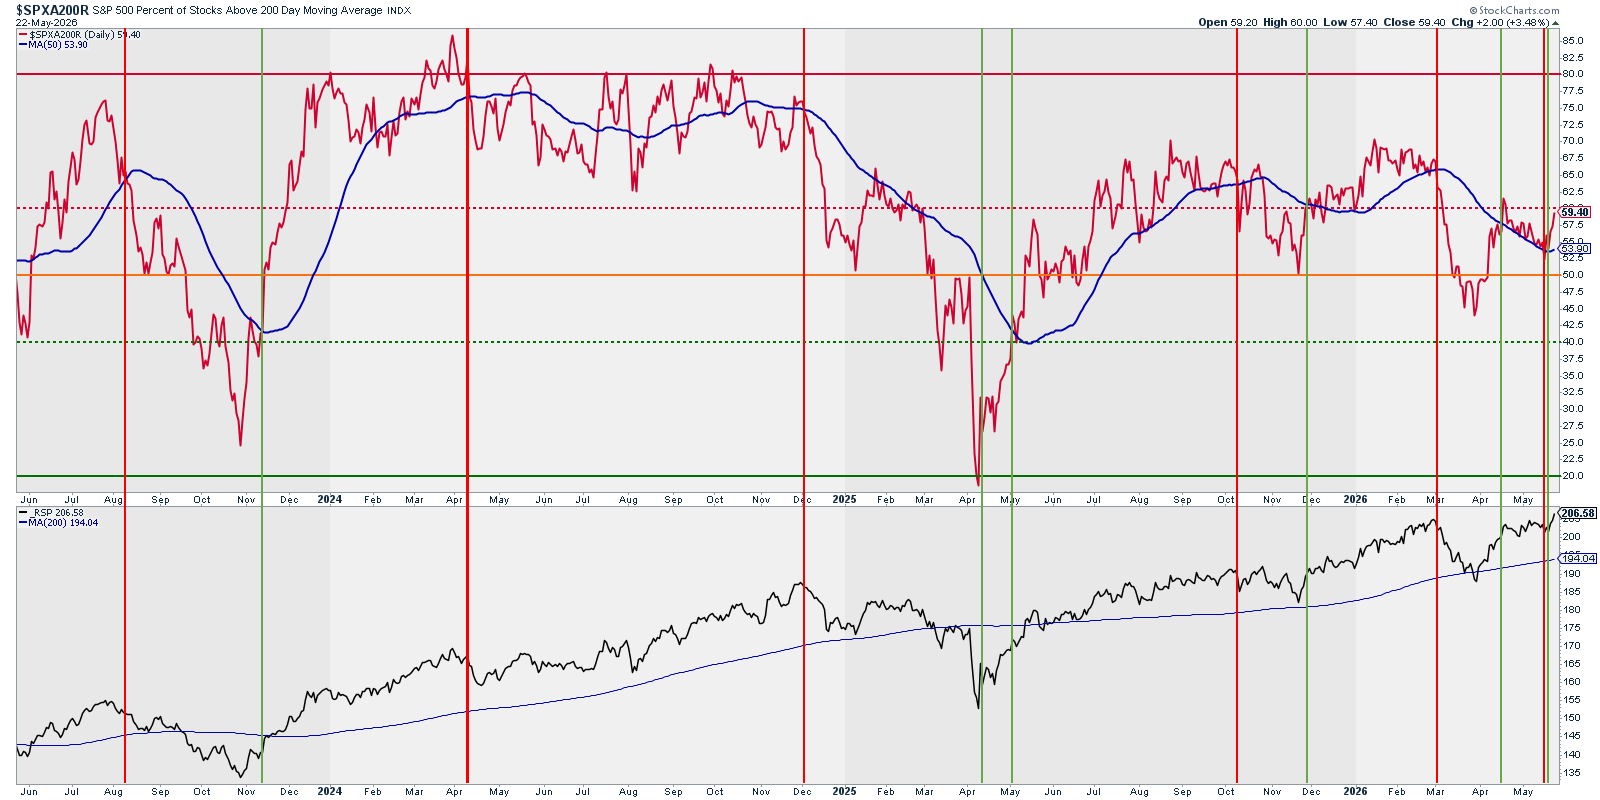
Breadth & Volatility: % Stocks above SMAs vs. RSP
Above 200 Daily SMA
Above 20, 50, and 200 Daily SMAs
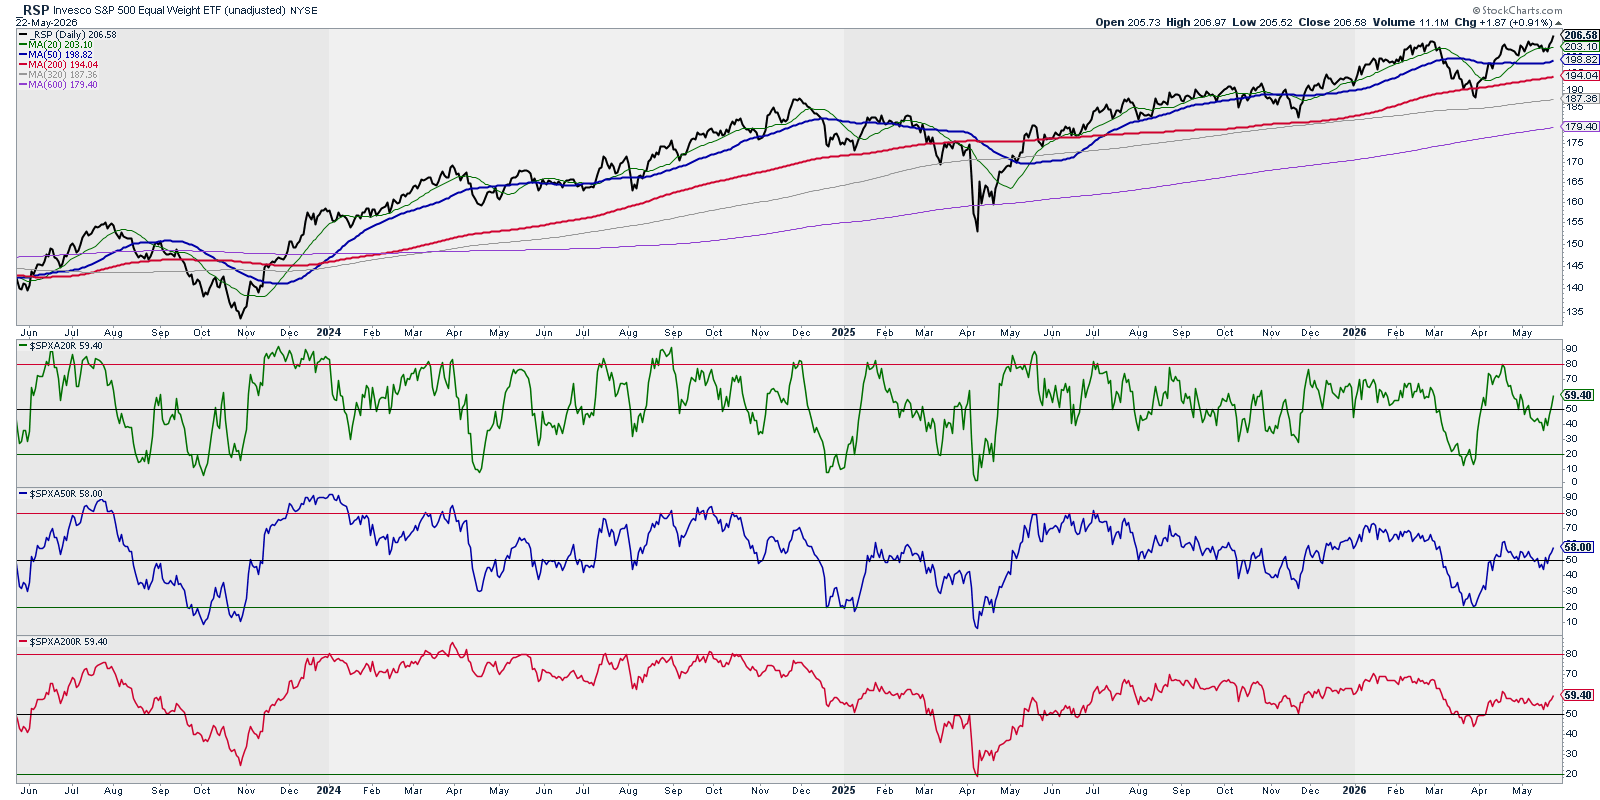
Analysis: Last week, the Above 200D (red) did trigger the bearish signal, but this week it triggered the bullish signal again. The above 20D (green) and 50D (blue) have crossed below their 50 level. I’m upgrading the outlook from bearish to neutral, as I want to see continuation of this new signal to confirm the bullish outlook.
Outlook: Neutral
Breadth & Volatility: Bullish Pct. Index & McClellan Summation Index
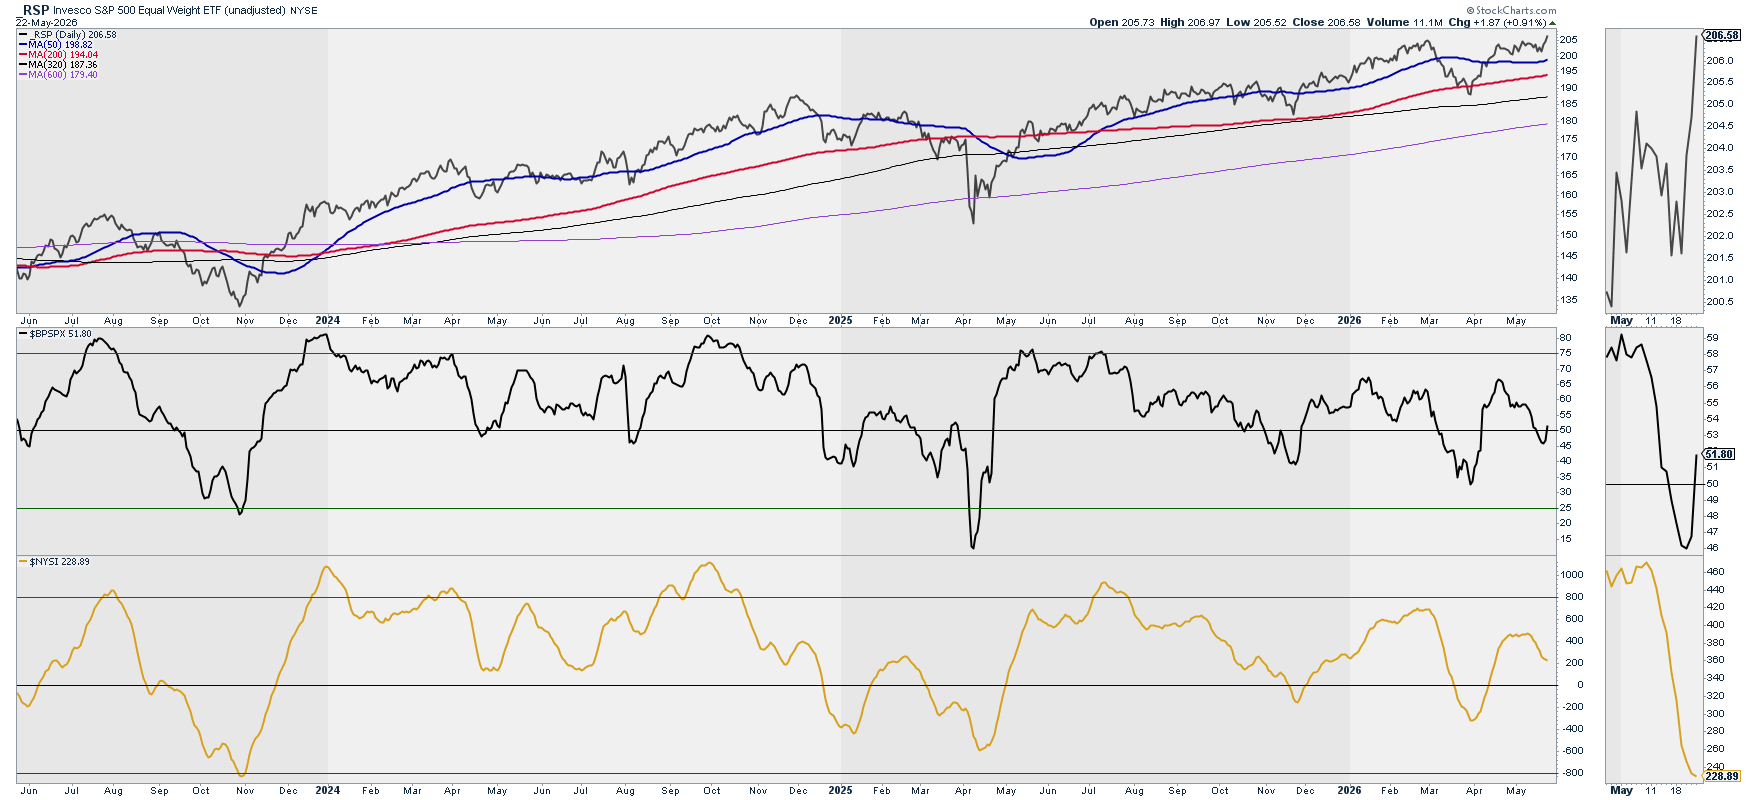
Analysis: Bullish Pct. Index has crossed back above the 50 level. I’m updating the outlook from bearish to bullish.
Outlook: Bullish
Breadth & Volatility: Ratio Low Volatility Stocks / SPY vs. SPY and RSP
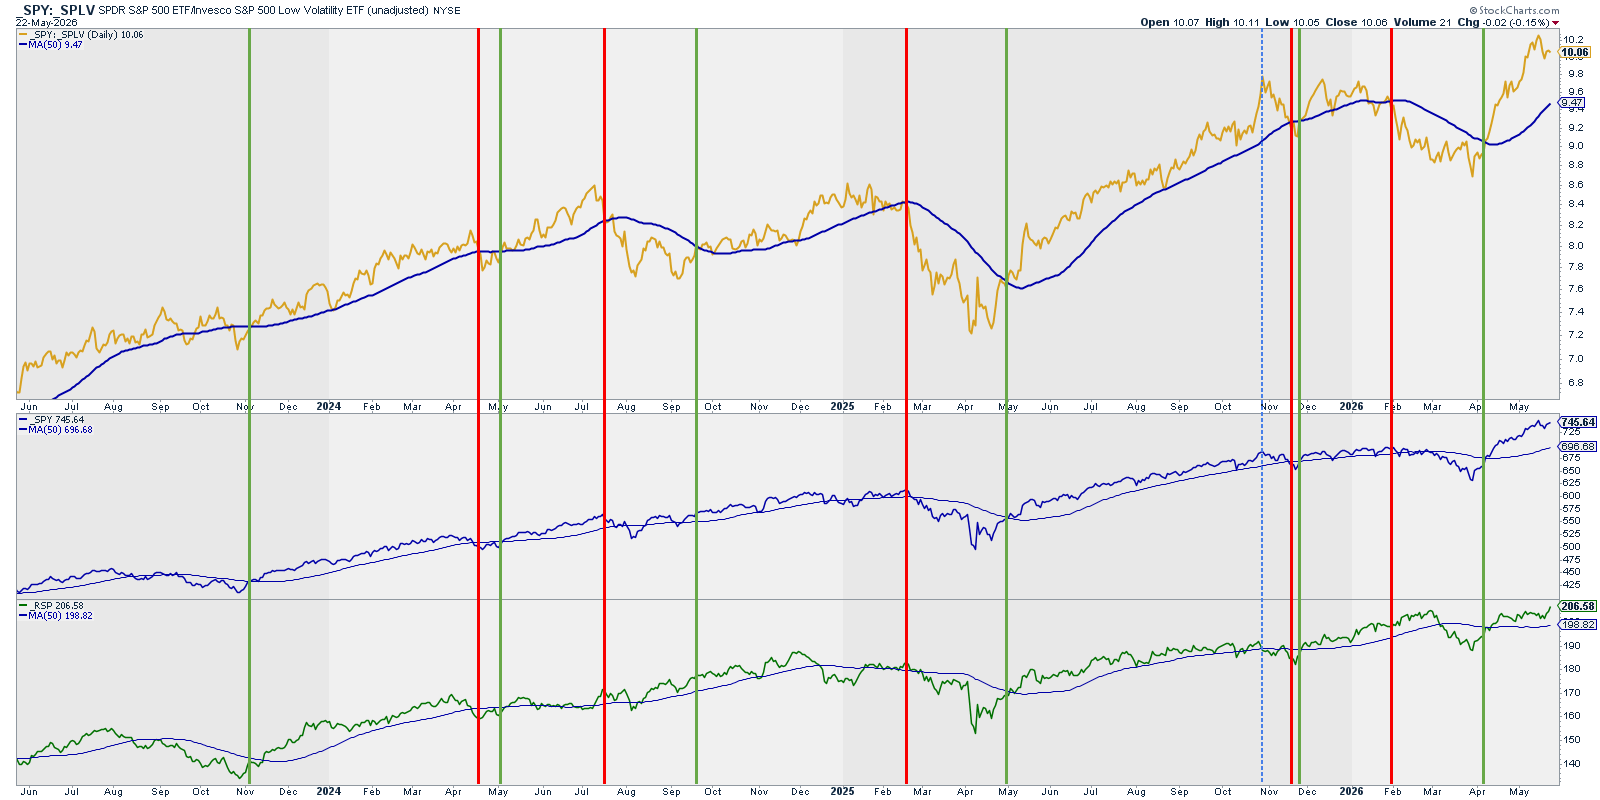
Analysis: We are still in bullish territory, but the ratio has lost momentum, which could signal a local top. I keep the outlook in neutral.
Outlook: Neutral
Breadth & Volatility: New Highs vs. SPY & RSP
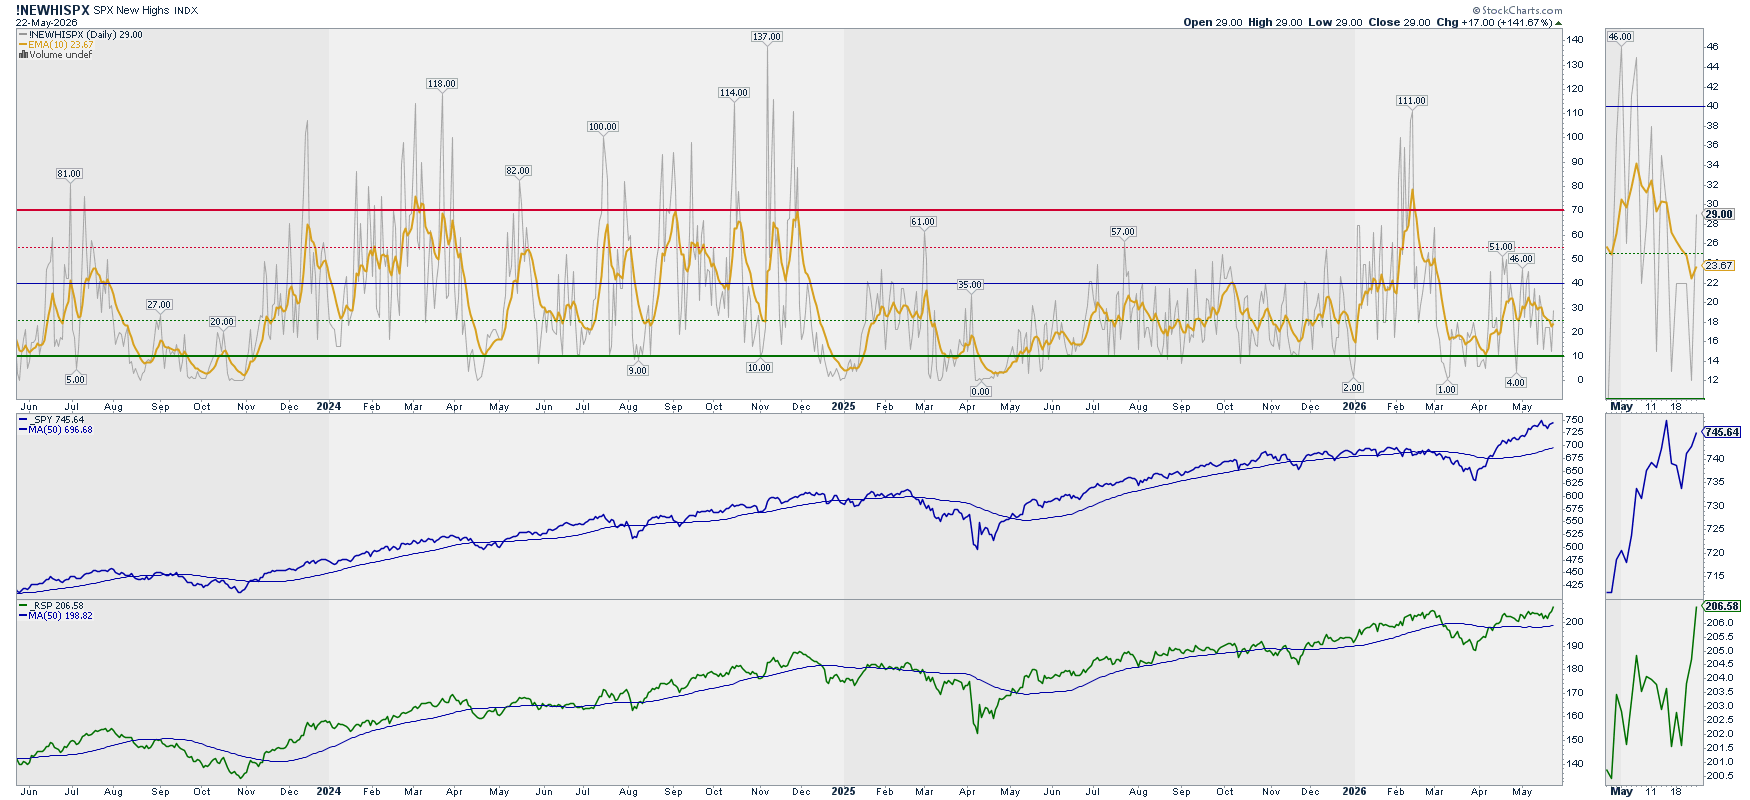
Analysis: Very low New Highs (grey line behind the yellow) with a downward trend (yellow). I’m leaving the outlook in neutral (definitely not bearish).
Outlook: Neutral
Breadth & Volatility: VIX vs. SPY & RSP
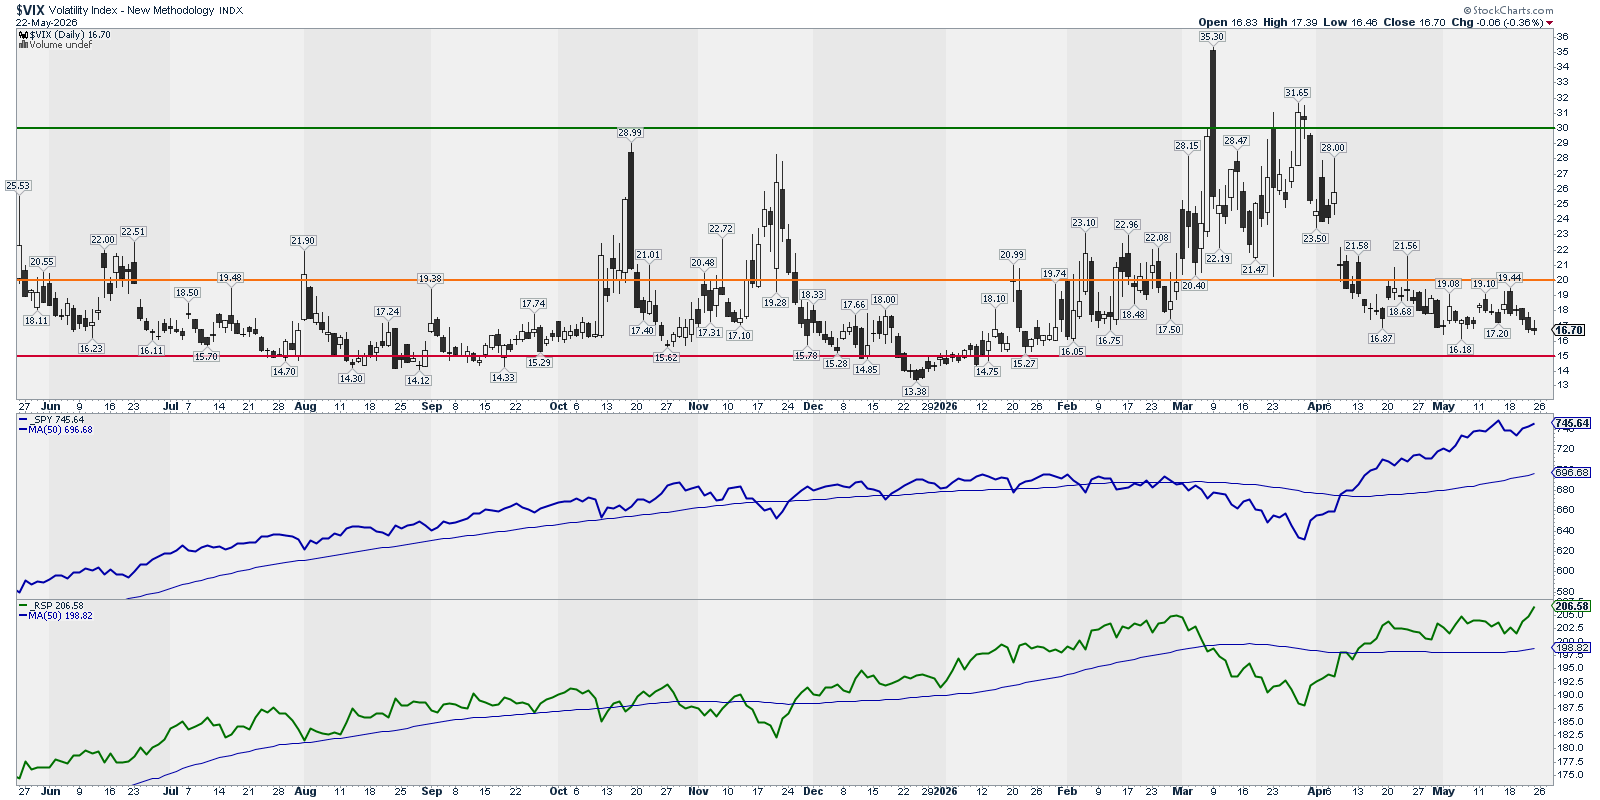
This chart is mainly to detect market bottoms.
Analysis: Downtrend resumed. I’m upgrading the outlook to bullish
Outlook: Bullish
Options: (Inverted) Put/Call Ratio vs. SPY
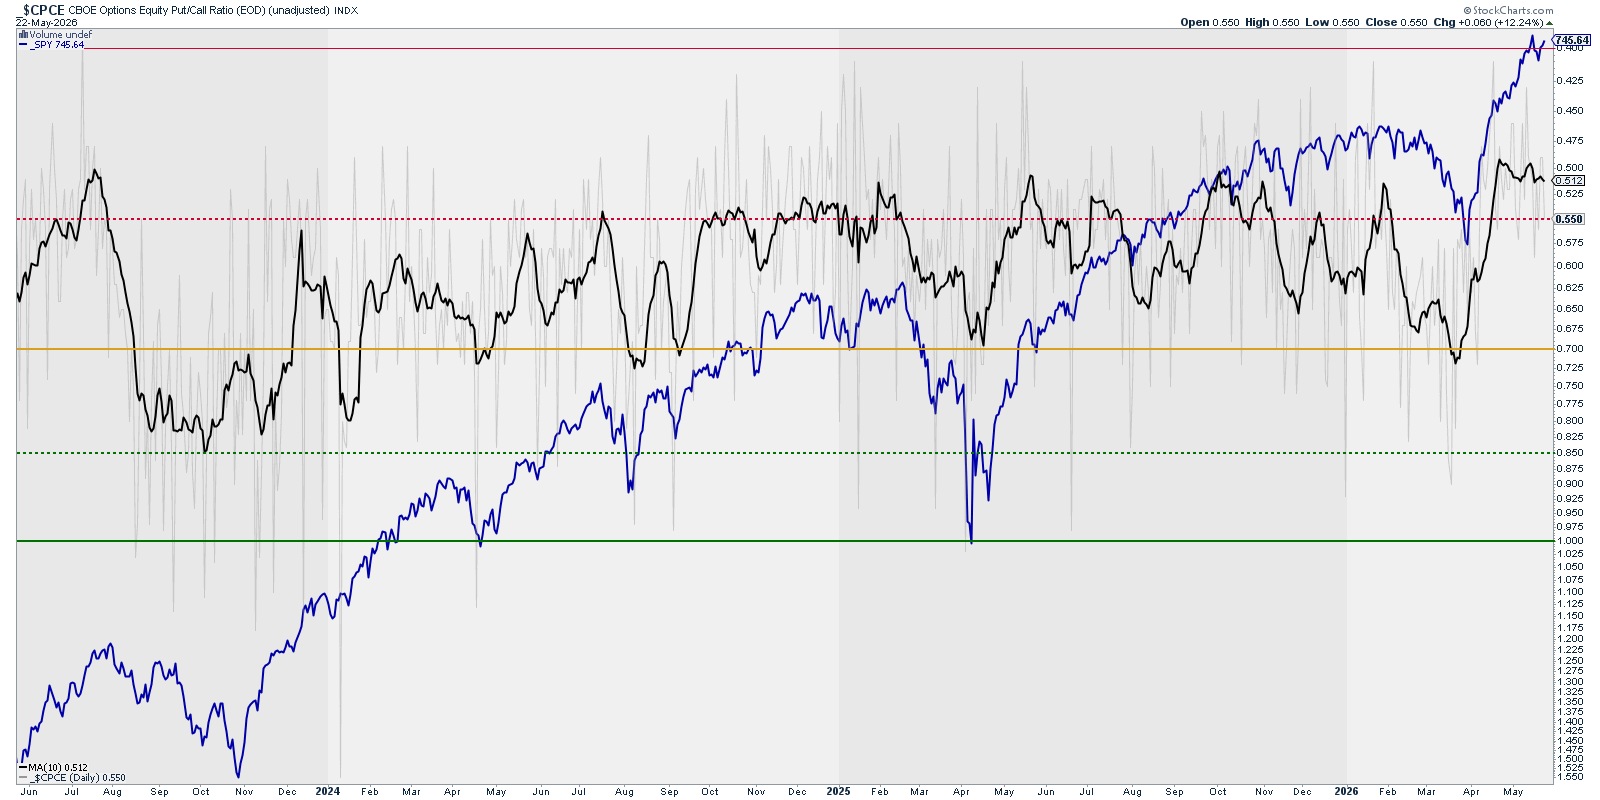
Note: Updating this chart to overlay SPY behind the ratio.
Analysis: Historically, at this levels in the P/C ratio, the market finds difficulties to advance. A downward slope in the P/C ratio 10D SMA historically means that the market (SPY) will go down. I’m keeping the outlook as Bearish.
Outlook: Bearish
Options: Gamma Exposure – SPX
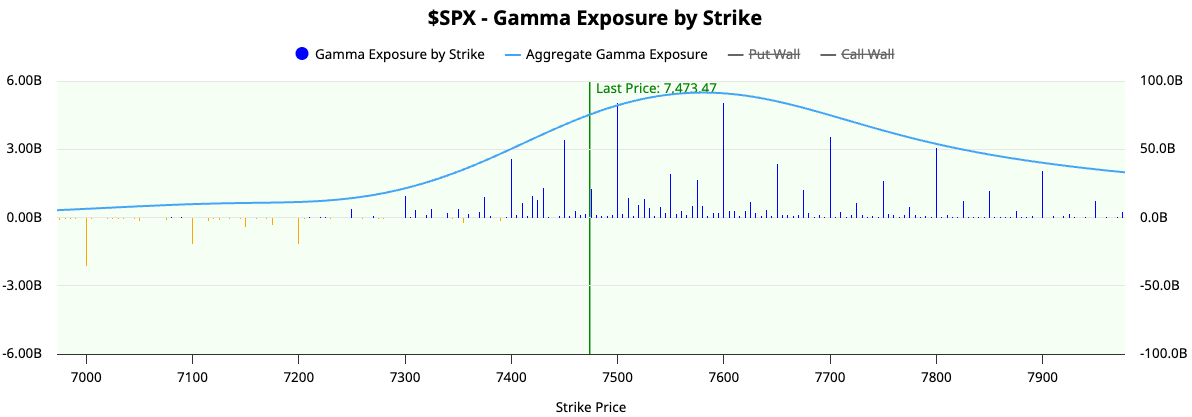
Analysis: Positive Gamma keeps increasing to higher levels at 7,500, 7,600, 7,700 and 7,800. We don’t see much support in lower levels. In case of a sudden drop in the markets, prices will fall sharply. I’m keeping the bullish outlook as we still are in a positive gamma environment.
Outlook: Bullish
Level 2: What is happening? Summary
Price Action: Bearish
Breadth & Volatility: Neutral
Options: Neutral (one Bearish and one Bullish reading)
Where is it happening? – Level 3
Bulls vs. Bears: RSP vs. RSPD (Cons. Disc. – Bulls) and RSPS (Cons. Sta. – Bears)
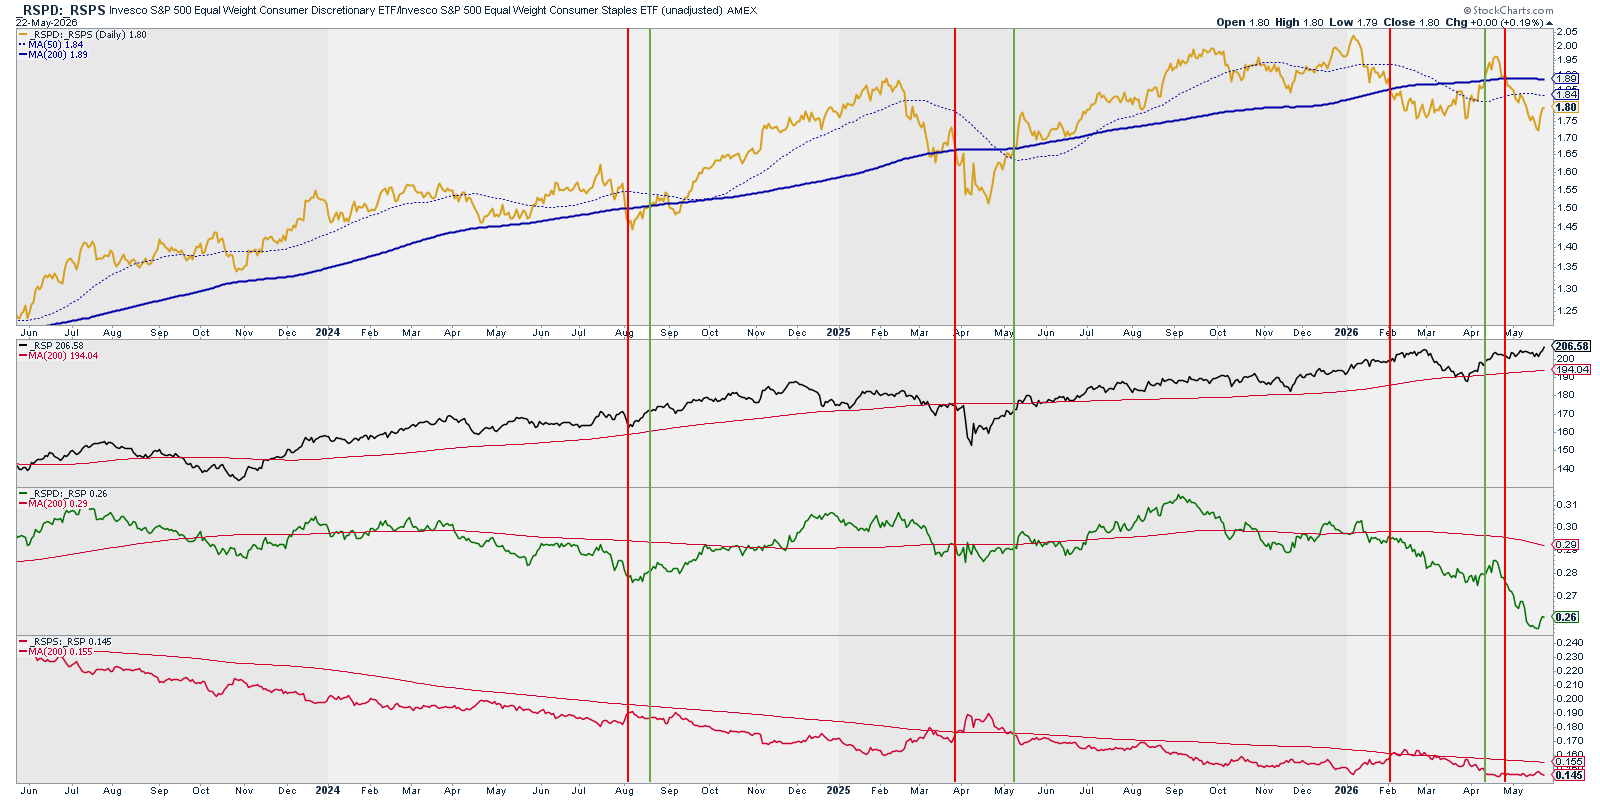
Analysis: Ratio (yellow) continues in bearish territory. Bulls (green) are extremely weak, any recovering from these very low levels could be seen as a bullish development.
Outlook: Bearish
Sectors Rotation
Market & Economy Rotation
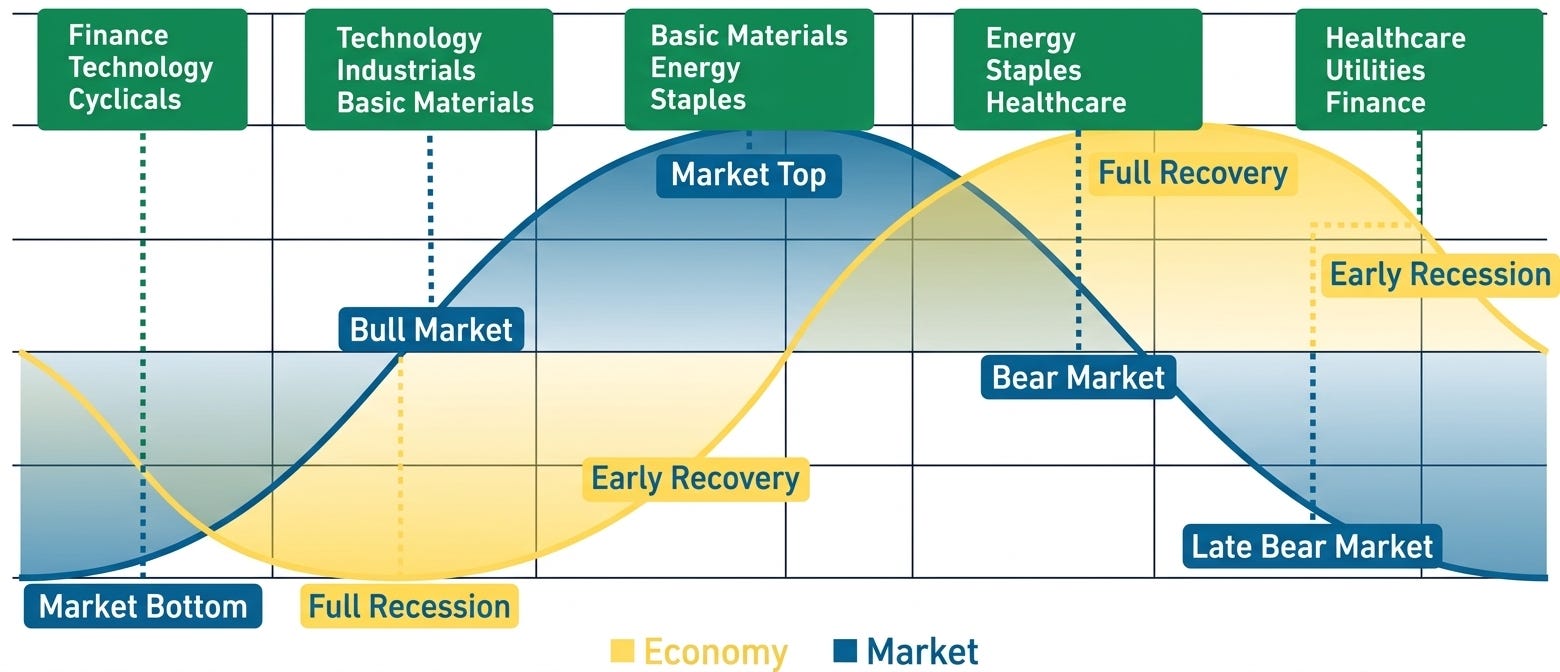
US Sectors order by ISM PMI Correlation (between parenthesis)
Growth Sectors - shall outperform when the market is bullish:
XLK: Technology (71%)
XLY: Cons. Discretionary (67%)
XLI: Industrials (66%)
XLB: Basic Materials (66%)
XLF: Financials (59%)
Value Sectors - shall outperform when the market is bearish:
XLV: Healthcare (55%)
XLC: Communications (49%)
XLE: Energy (44%)
XLU: Utilities (35%)
XLP: Cons. Staples (30%)
XLRE: Real Estate (16%)
Analysis:
With a market moving at this speed is difficult to decide in which moment of the cycle we are. We know that the economy is improving from lower levels, so we could consider it “Early Recovery”. The market, after the noise brought by the Iran war, is signalling towards a Bull Market as we shall see Technology and Industrials leading.
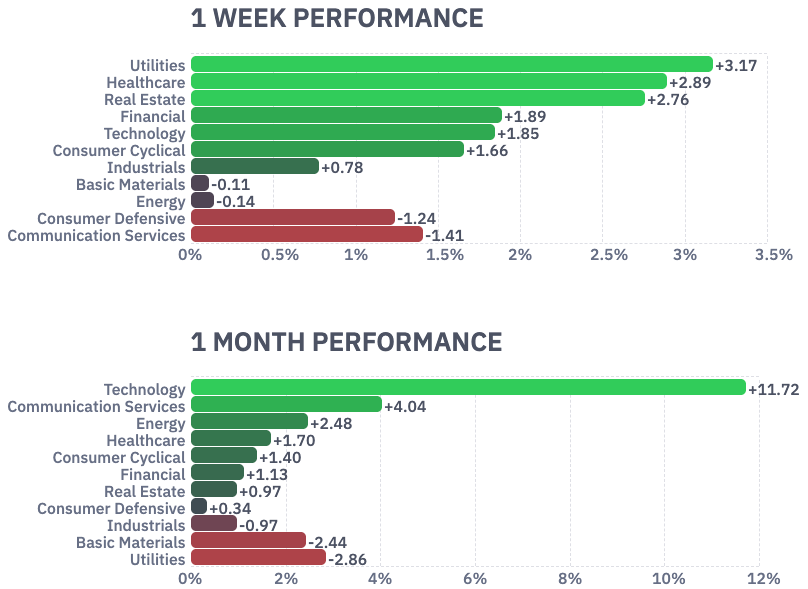
Sectors Performance
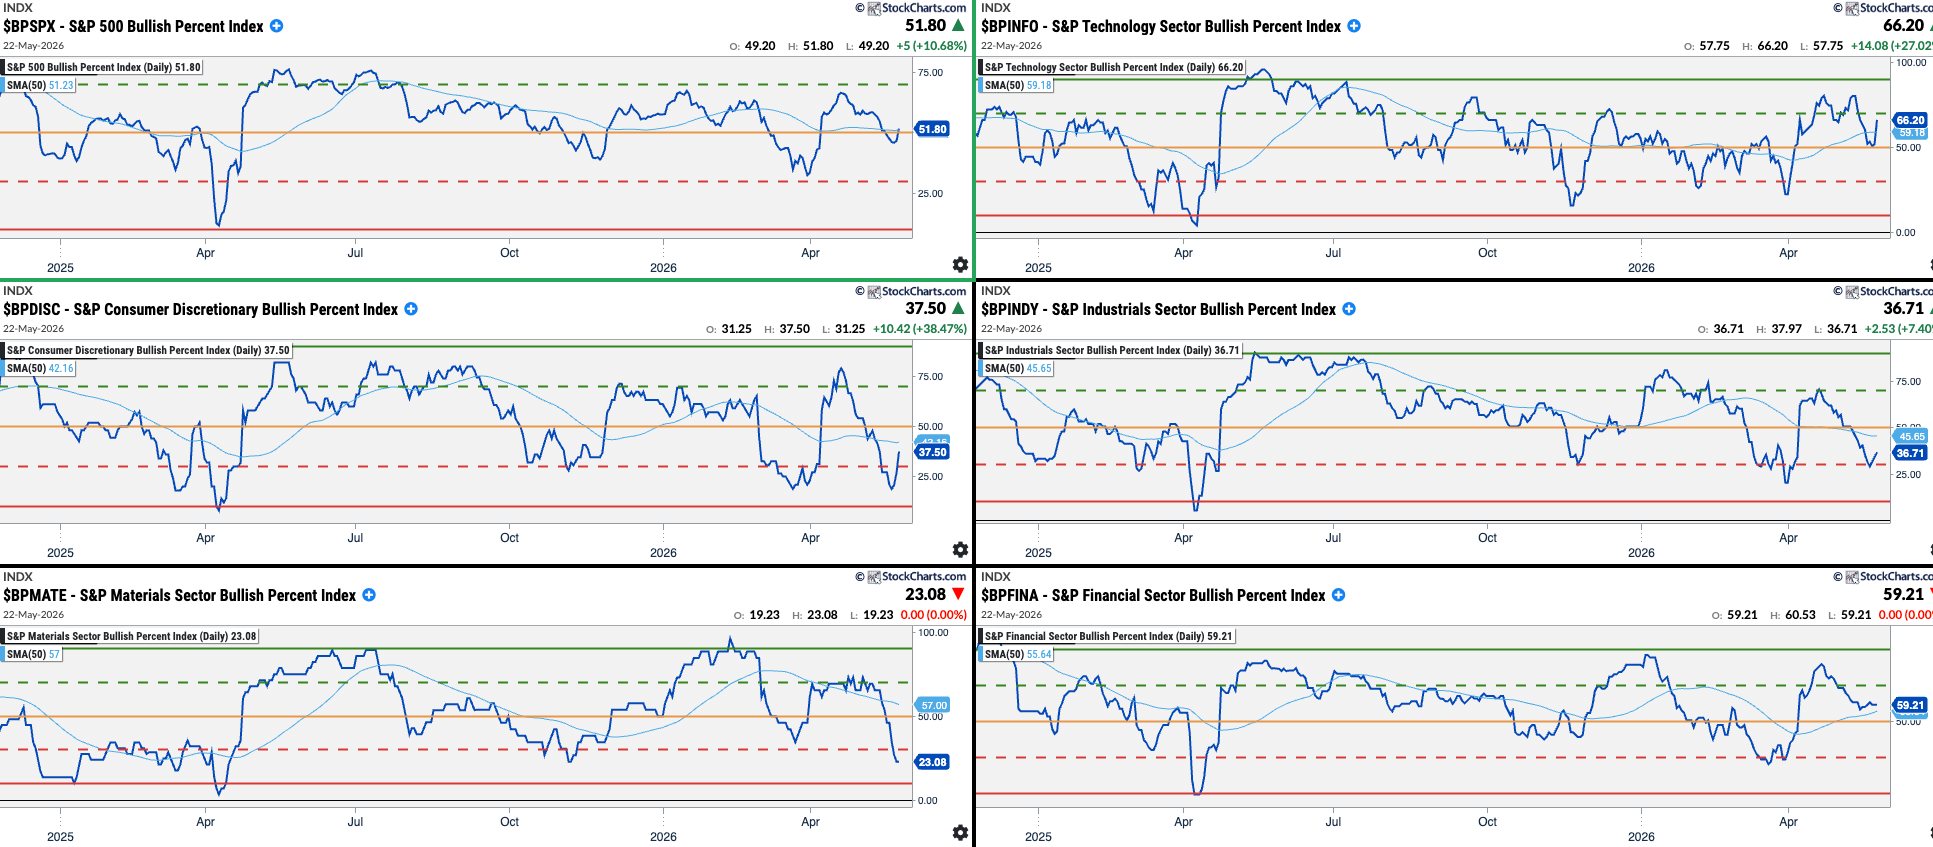
Sectors Bullish Percent Index
Growth Sectors:
Value Sectors:
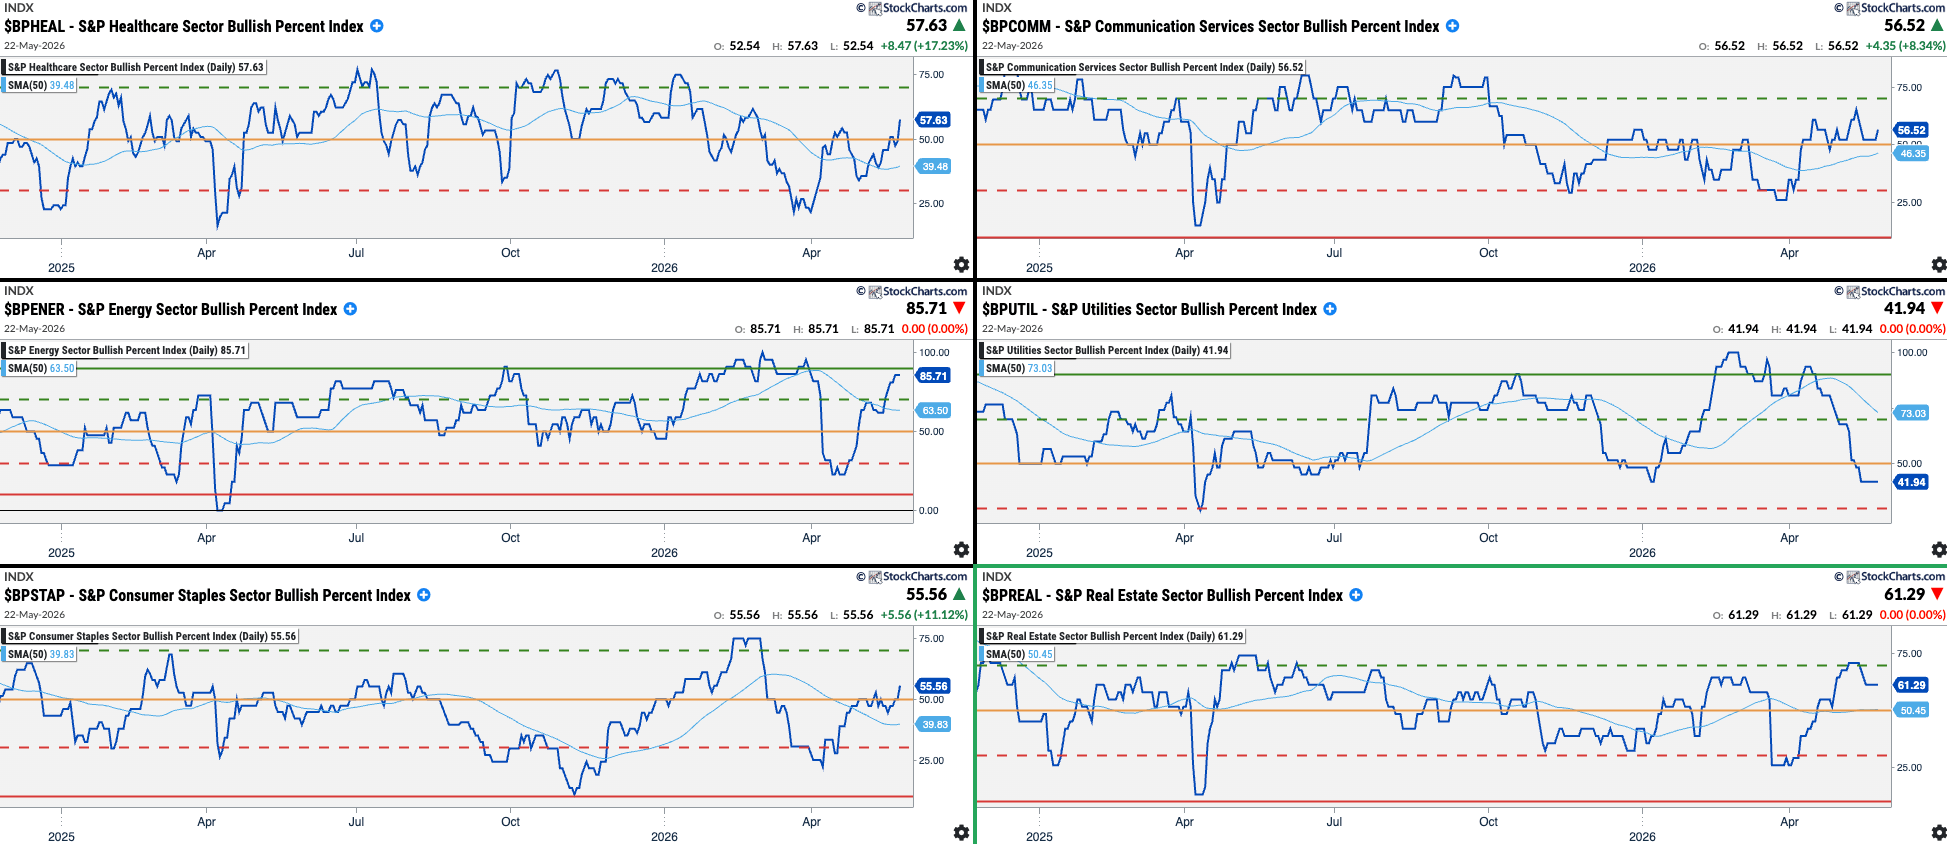
Any sectors below their red levels are good opportunities to find great companies at good valuations or buy sector ETFs (buy cheap). Those sectors above their Green levels are candidates to be sold (sell expensive).
Buy Opportunities: Utilities, Consumer Discretionary, Materials (sson)
Sell Opportunities:
Level 3: Where is it happening? Summary
Bulls vs. Bears: Bearish
Market & Economy Rotation: Bull Market
All Levels Summary and Final Thoughts
Level 1 Summary - The Why
Economic Data (long-term): Neutral
USD & Interest Rates: Bearish (due to Interest Rates)
Investors Sentiment: Bullish
Level 2 Summary - The What
Price Action: Bearish
Breadth & Volatility: Neutral
Options: Neutral (one Bearish and one Bullish reading)
Level 3 Summary - The Where
Bulls vs. Bears: Bearish
Market & Economy Rotation: Bull Market
Level 4: Scanning for opportunities
Stock Screener for Great Companies with Great Technicals
Descriptive
Index: S&P500 | Market Cap.: +Mid (+$2B) | Option/Short: Yes/Yes
Avg. Volume: >1M | Relative Vol.: Over 1 | Price: >$20
Fundamental
EPS Growth Next Year: >15%
Technical
Performance: Quarter Up | Price > 50D SMA | Price > 200D SMA | Beta > 1 | ATR > 1

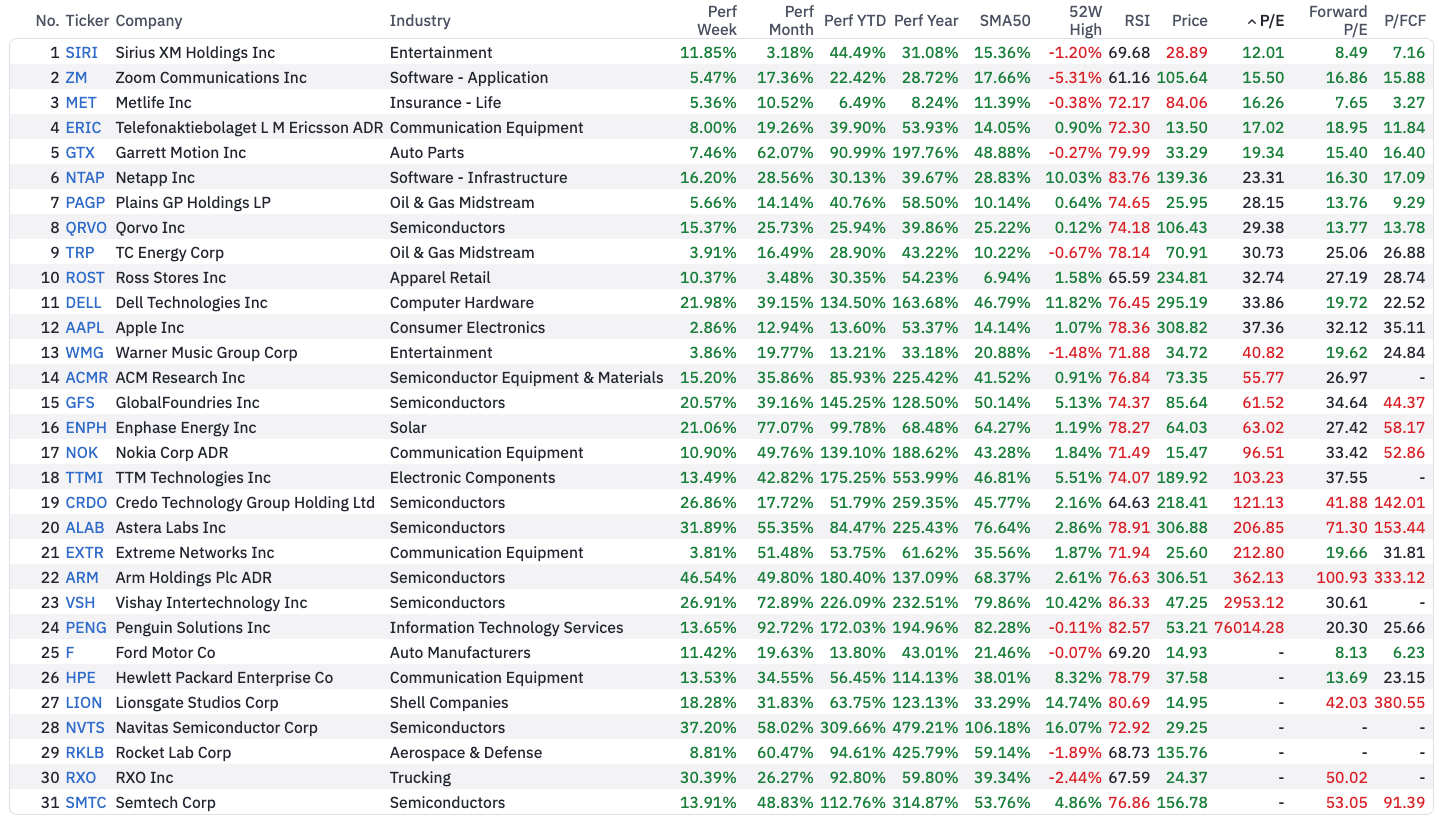
Stock Screener for New Highs
Descriptive
Index: Any | Market Cap.: +Mid (+$2B) | Option/Short: Yes/Yes
Avg. Volume: >1M | Relative Vol.: Over 1 | Price: >$10
Fundamental
Sorted by P/E
Technical
Signal: New High
Disclaimer: The content on AMAT Investing is strictly for educational and learning purposes. The author is not a licensed financial advisor and holds no formal financial education. This post does not constitute professional financial advice. All investing involves risk of loss. Always conduct your own research and consult a licensed professional before making any investment decisions.