

Weekly Review - 2026-May-08
A correction in the making

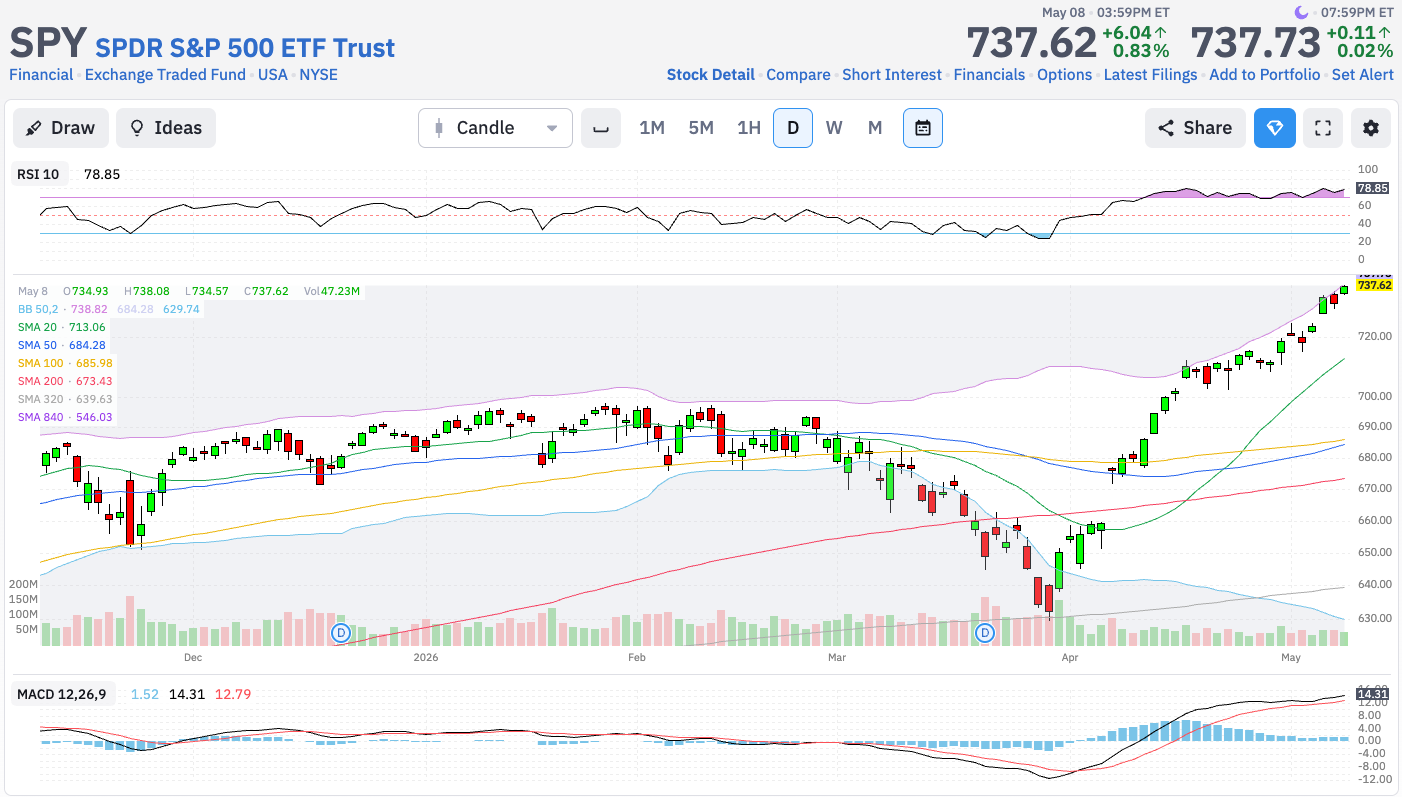
Last Week’s Comment: Despite last week’s (daily) shooting star candlestick, overbought RSI, and high MACD, the market kept going higher. Remember that price is the only thing that pays. All other indicators are more useful as filters in a screener than predicting future price movements.
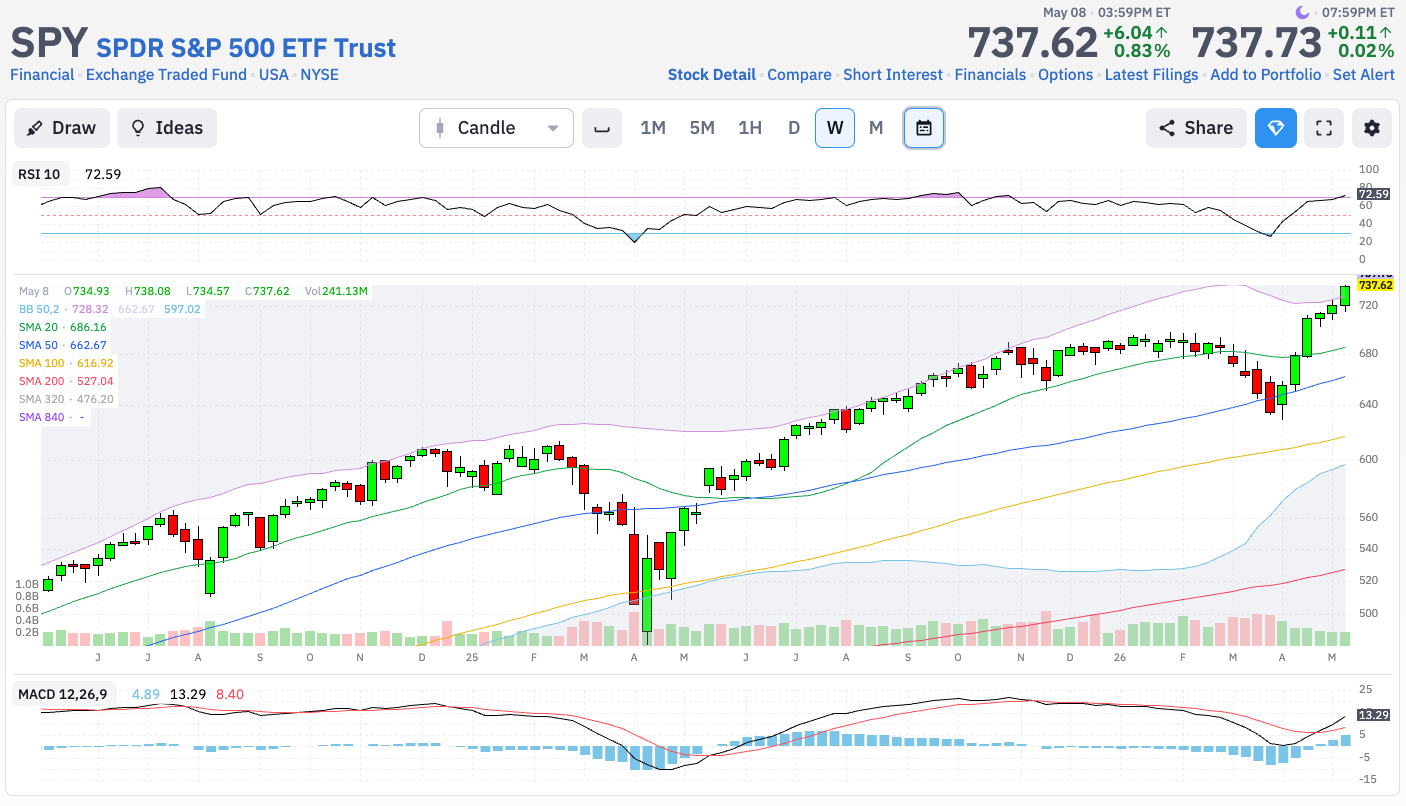
The weekly chart shows a different picture
Level 1: Why is it happening?
Economic Data: Production: ISM PMI vs. SPX
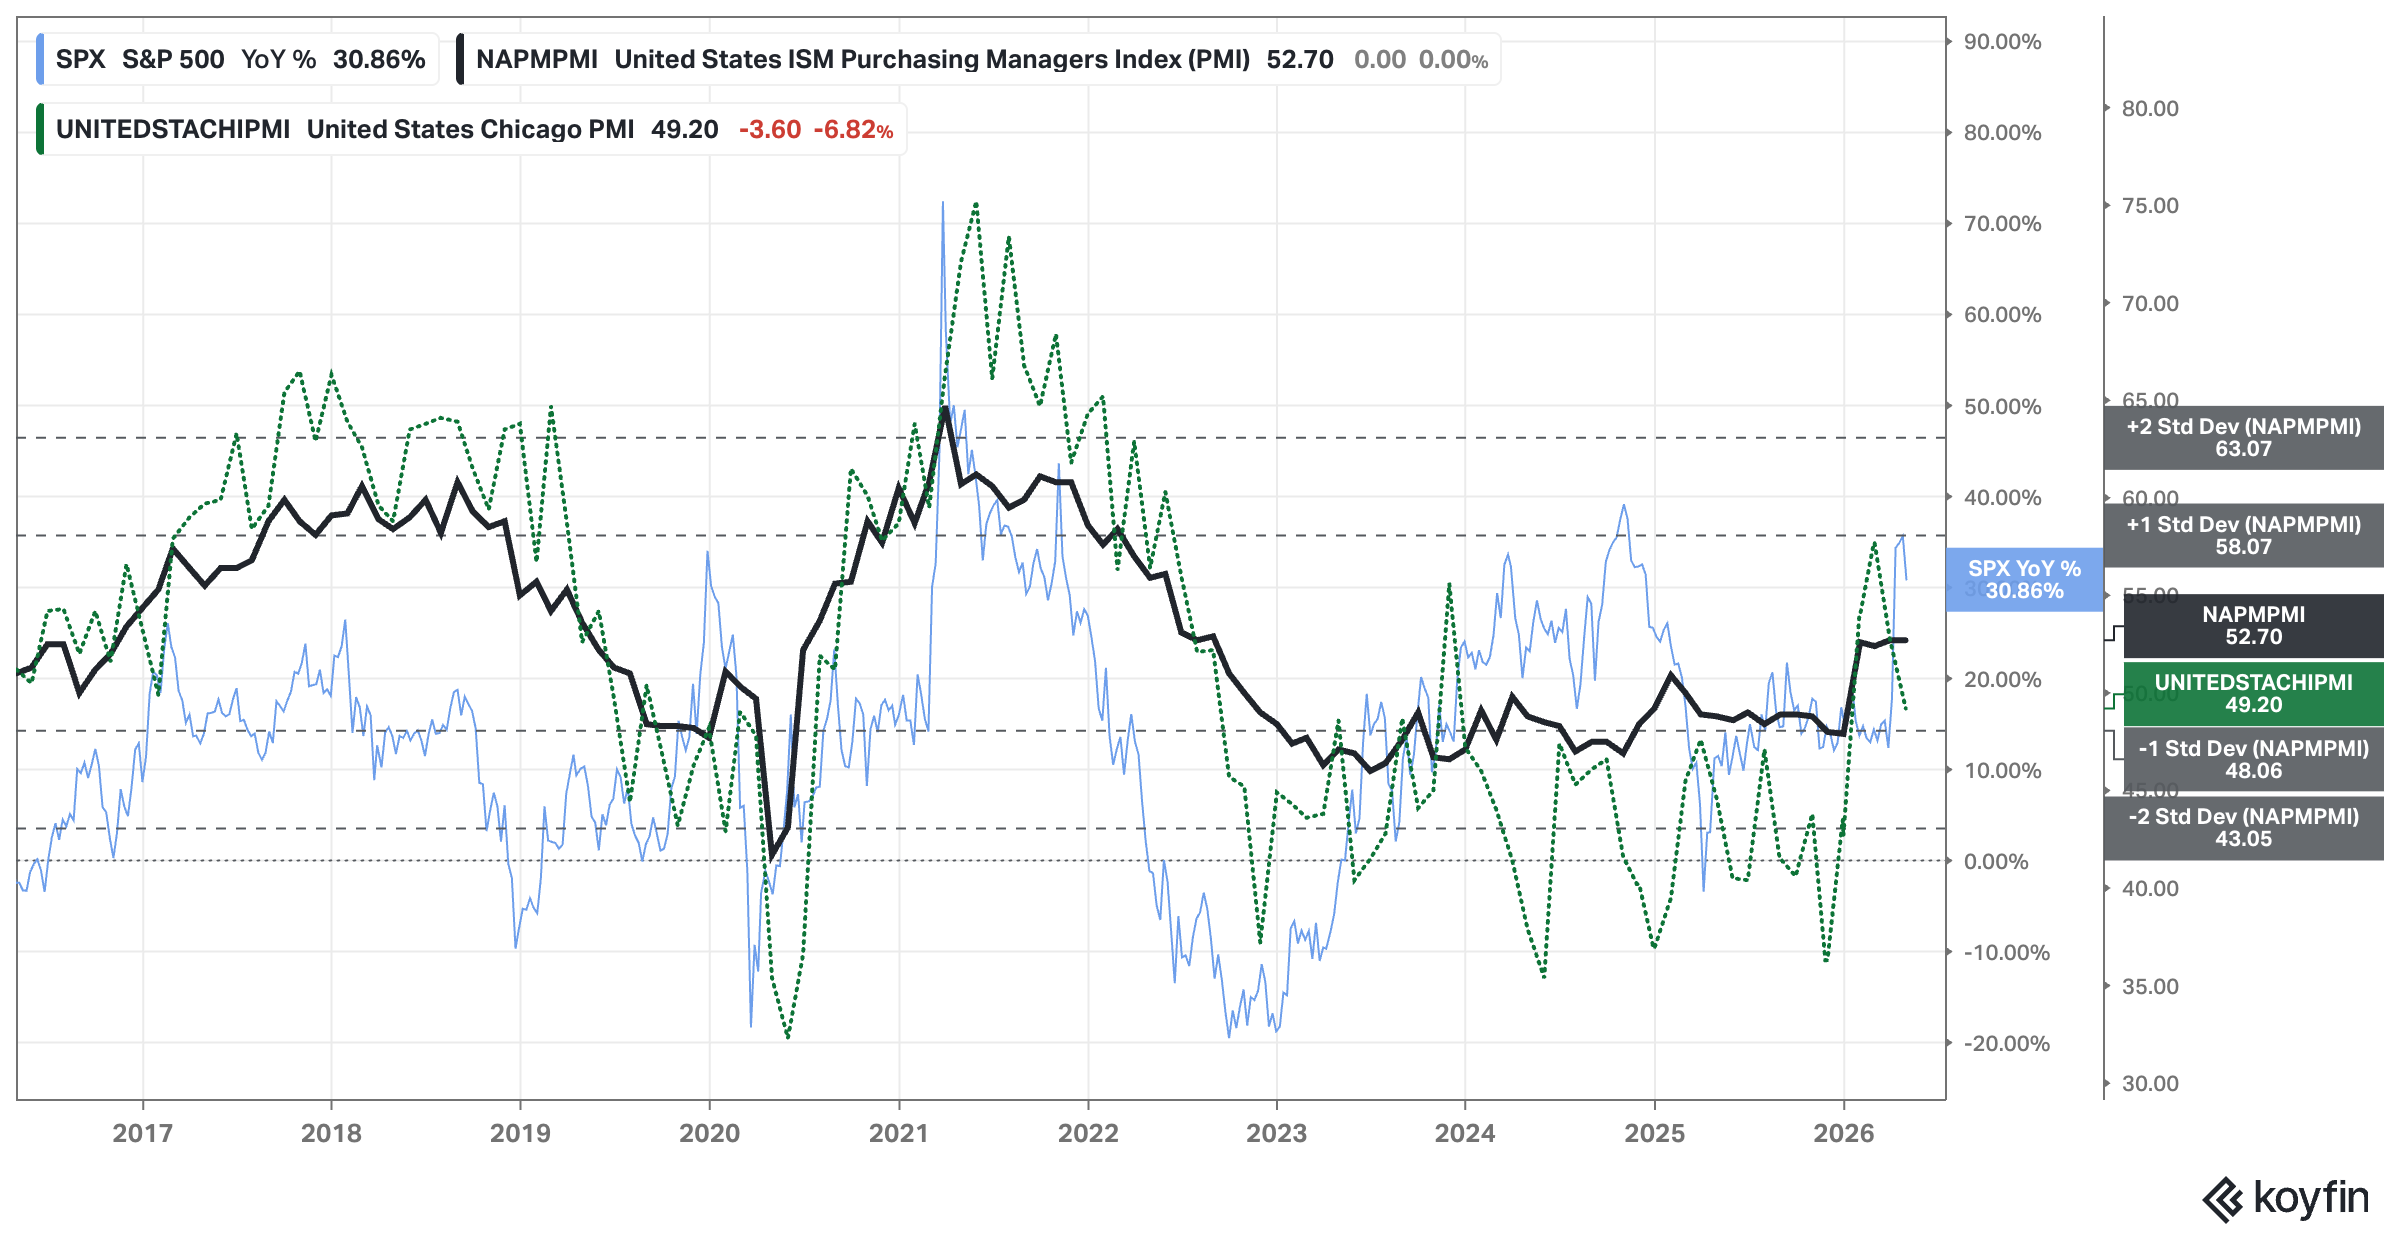
Analysis: No changes since last week.
Outlook: Bullish
Economic Data: Production: Dallas & Philadelphia Manufacturing vs. SPX
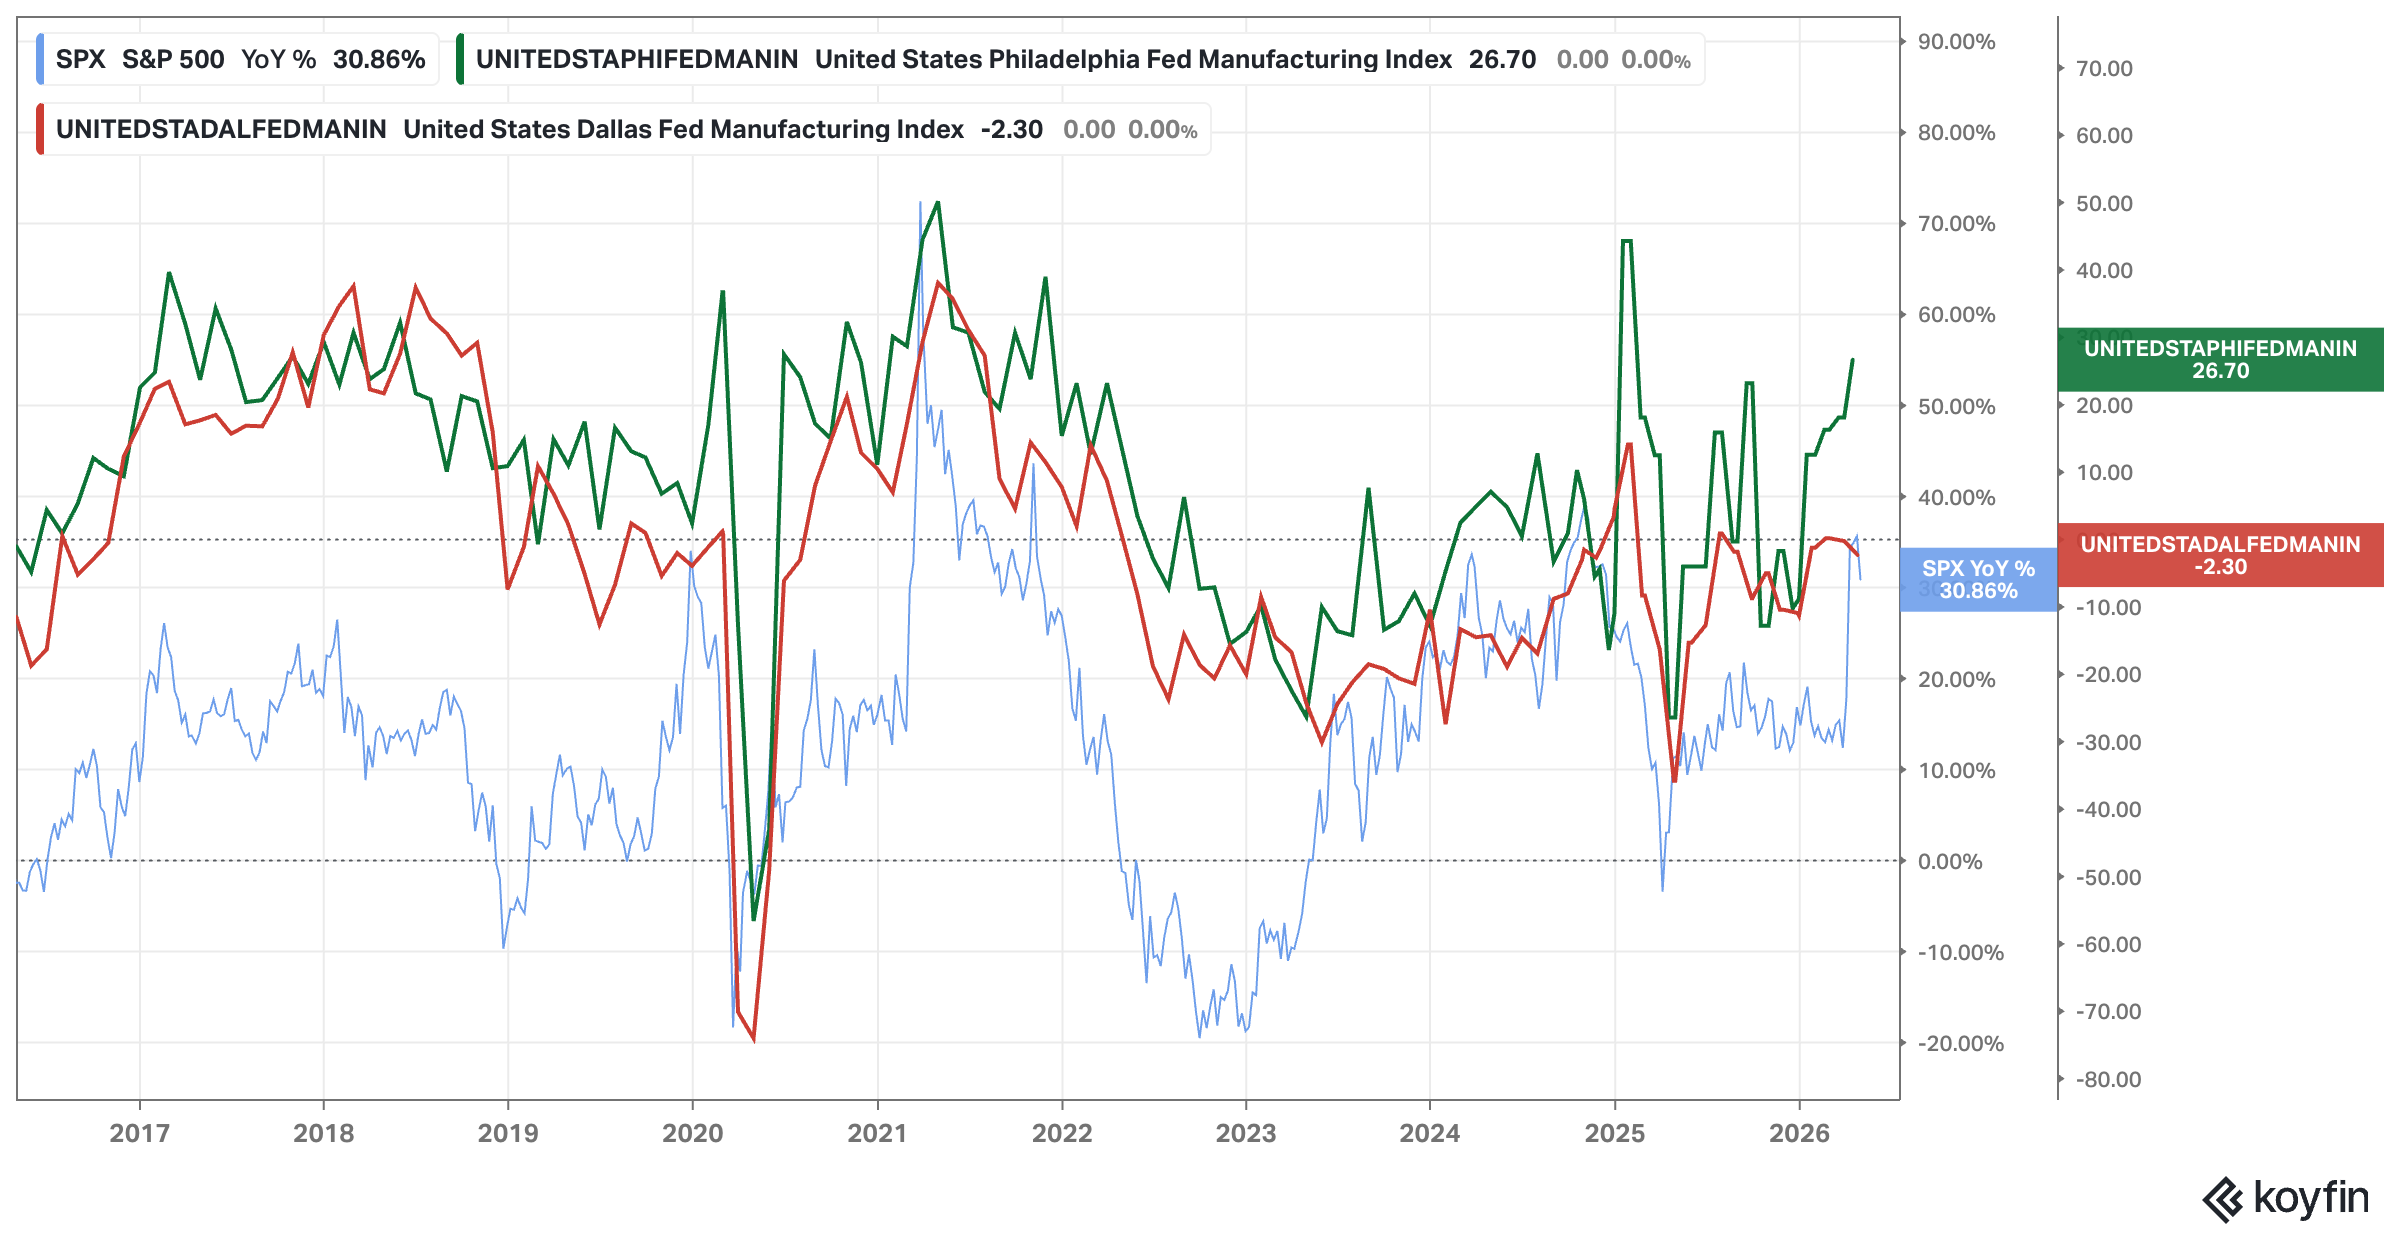
Analysis:No changes since last week.
Outlook: Bullish
Economic Data: Consumption: Consumer Sentiment
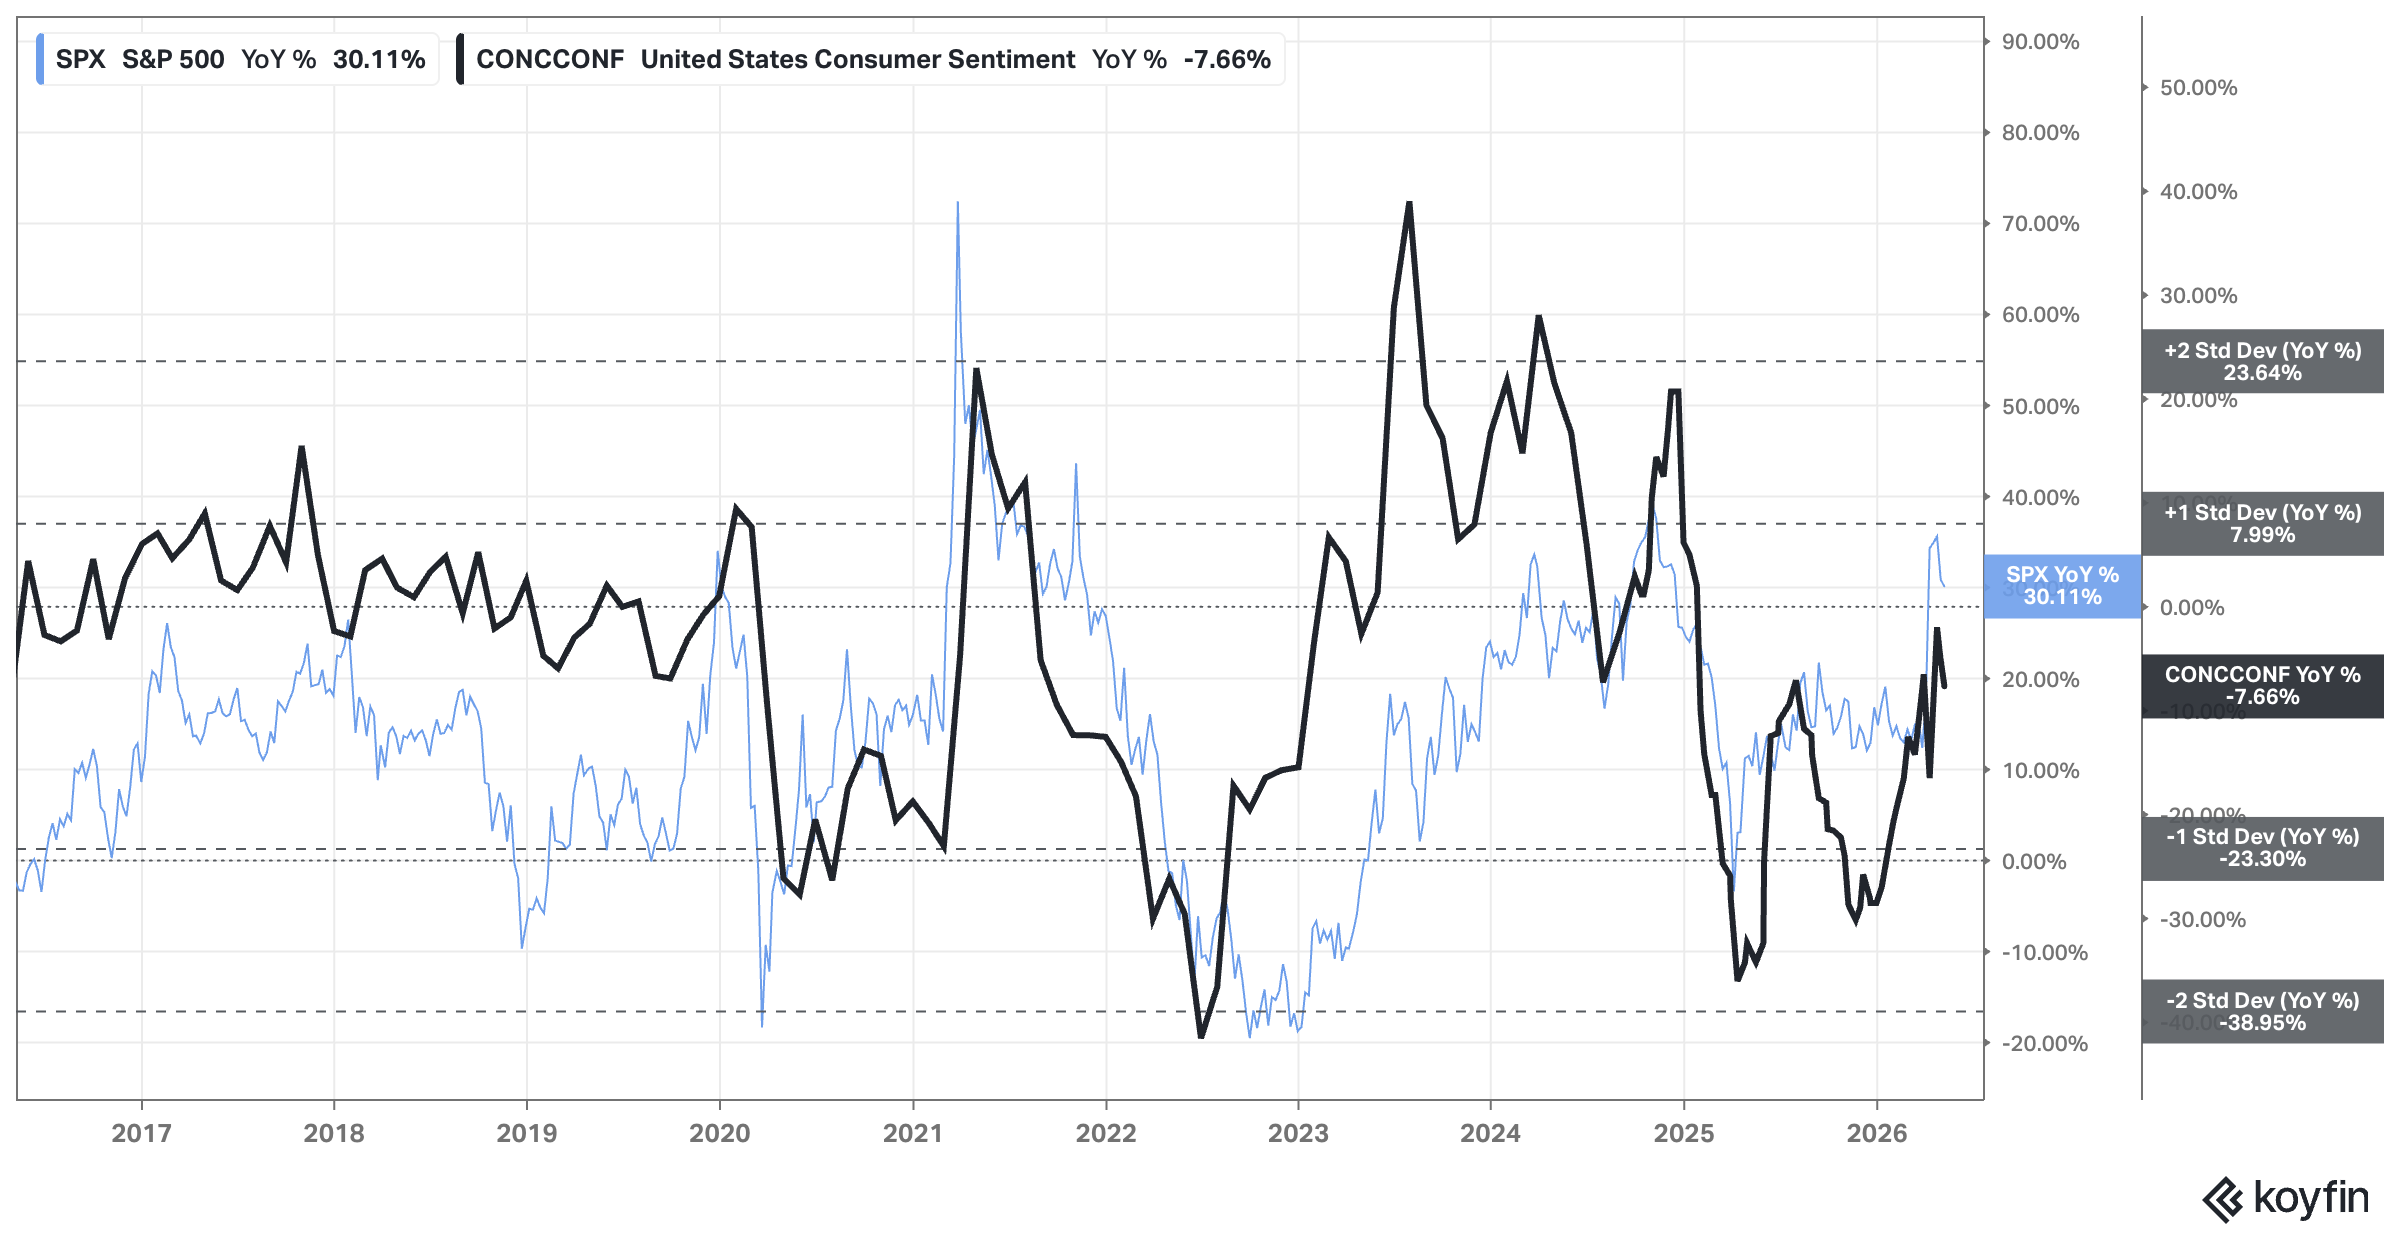
Analysis: Slight decrease in sentiment. High gasoline prices makes nobody happy. I’m updating the outlook from Bullish to Neutral-Bullish
Outlook: Neutral-Bullish
USD & Interest Rates: FED, 2yr, 10yr, and 30yr Rates
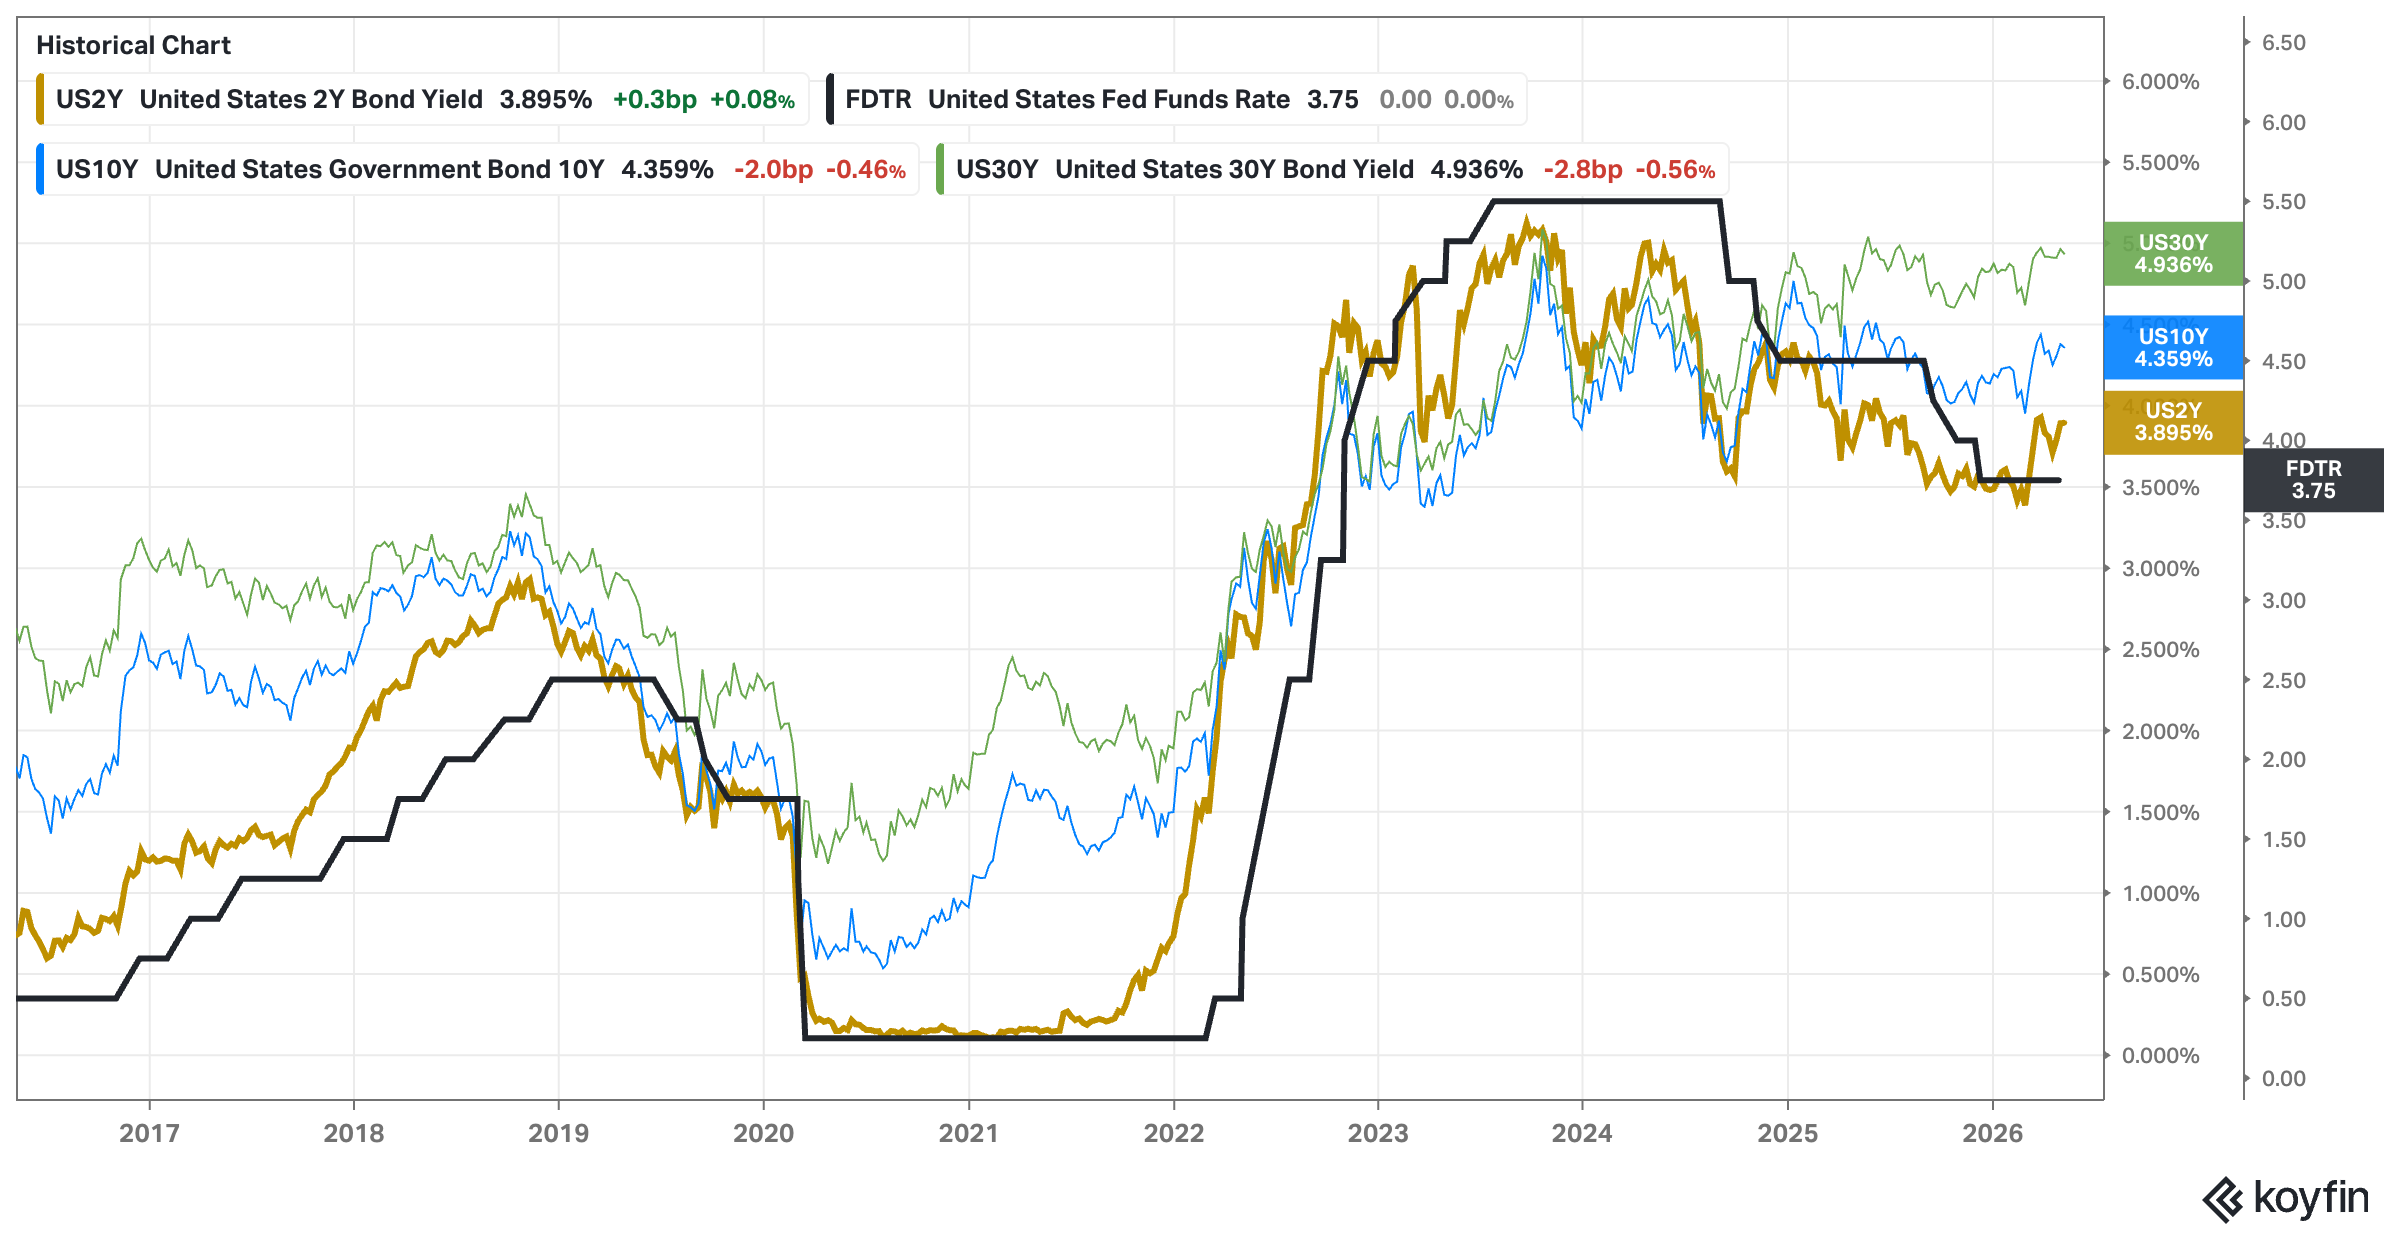
Analysis: No much change since last week. This is really not good. Interests keep increasing. Long-term (30 year) have a psychological resistance at 5% and we are at 4.964%. Markets may embrace this narrative and drag down everything.
Outlook: Bearish
USD & Interest Rates: USD vs EEM ILF and S&P500
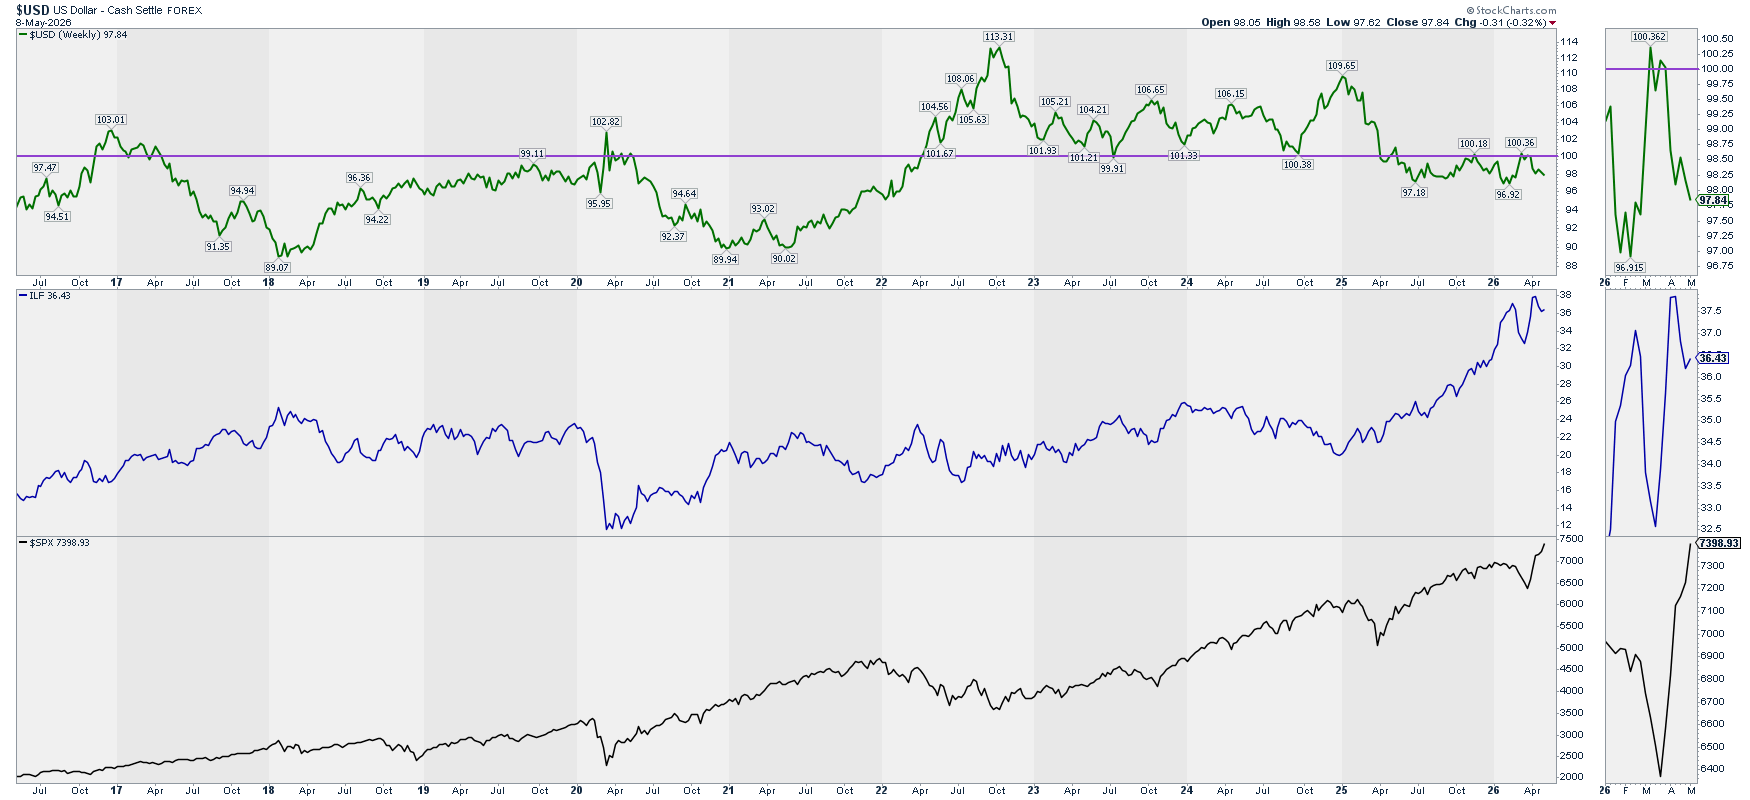
Analysis: USD slightly down and ILF improved a little bit. A long war is not a great outlook for ILF.
Outlook: Neutral (the longer the war the higher the oil & gas disruption)
Context Investors Sentiment: Credit Spreads
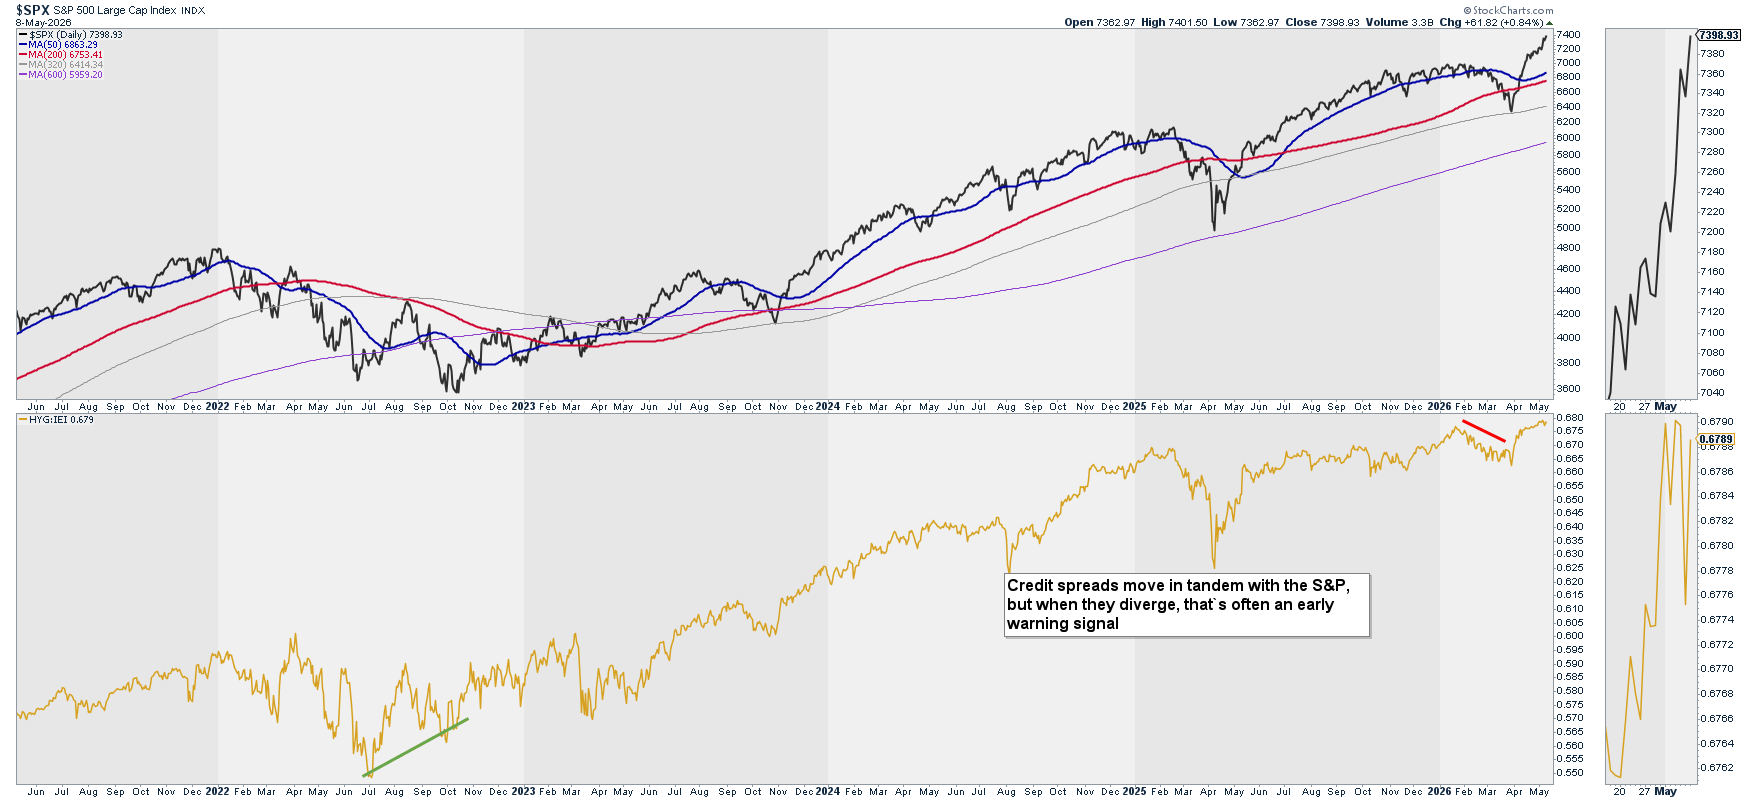
Credit spreads move in tandem with the S&P, but when they diverge, that’s often an early warning signal.
Analysis: Last week we saw a sharp increase in Spreads, and the markets (at least the market weighted indexes) advanced. This week, Spreads went quite parallel, yet I remain bullish.
Outlook: Bullish
Level 1: Why is it happening? Summary
Economic Data (long-term): Bullish (with a neutral note on that consumer confidence)
USD & Interest Rates: Bearish (due to Interest Rates)
Investors Sentiment: Bullish
What is happening? – Level 2
Price Action: SPX – Long Trend – 20 & 10 years
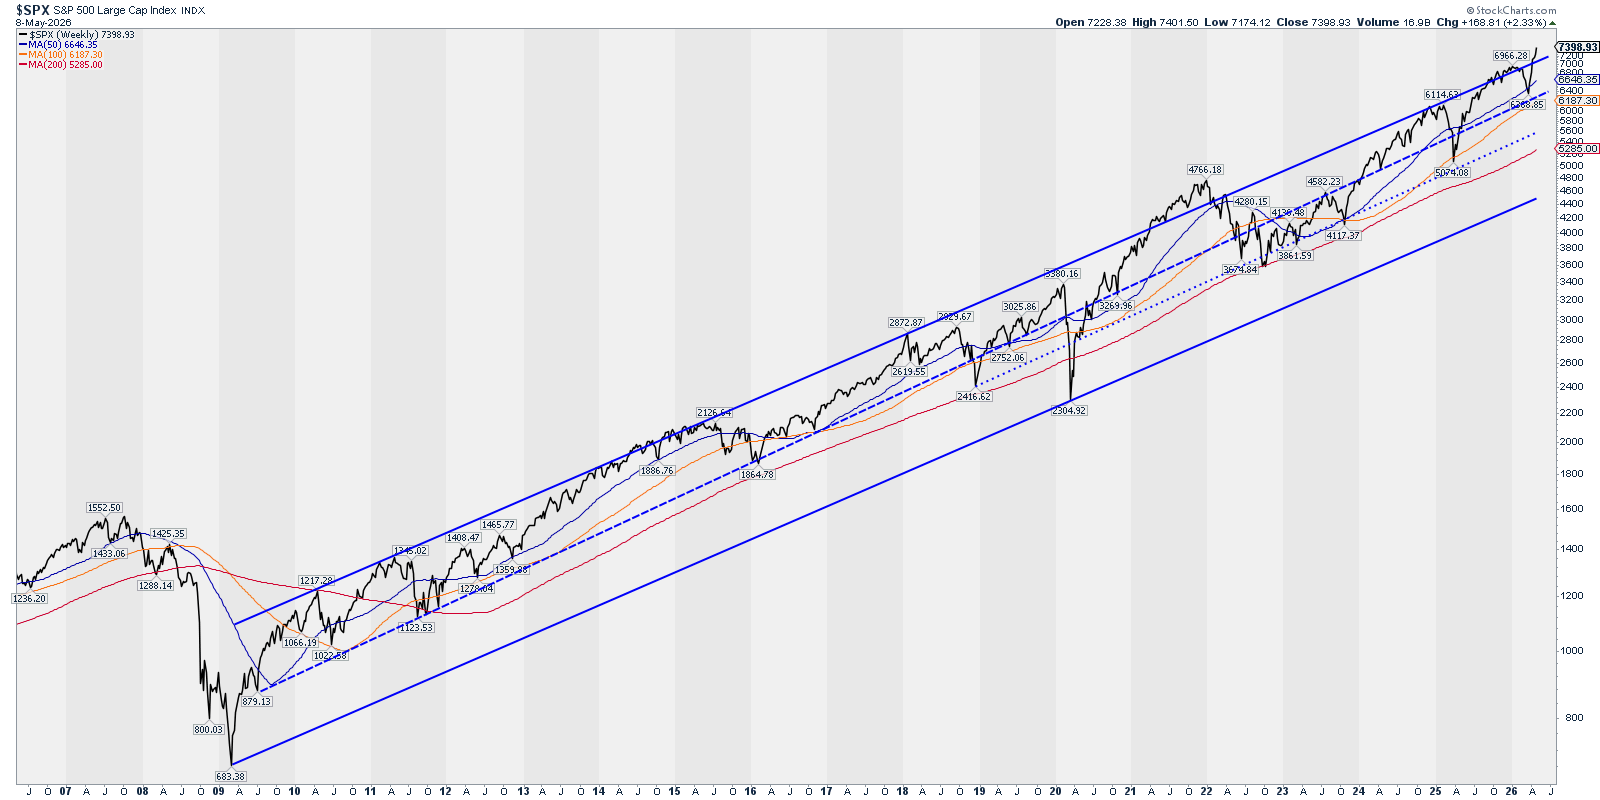
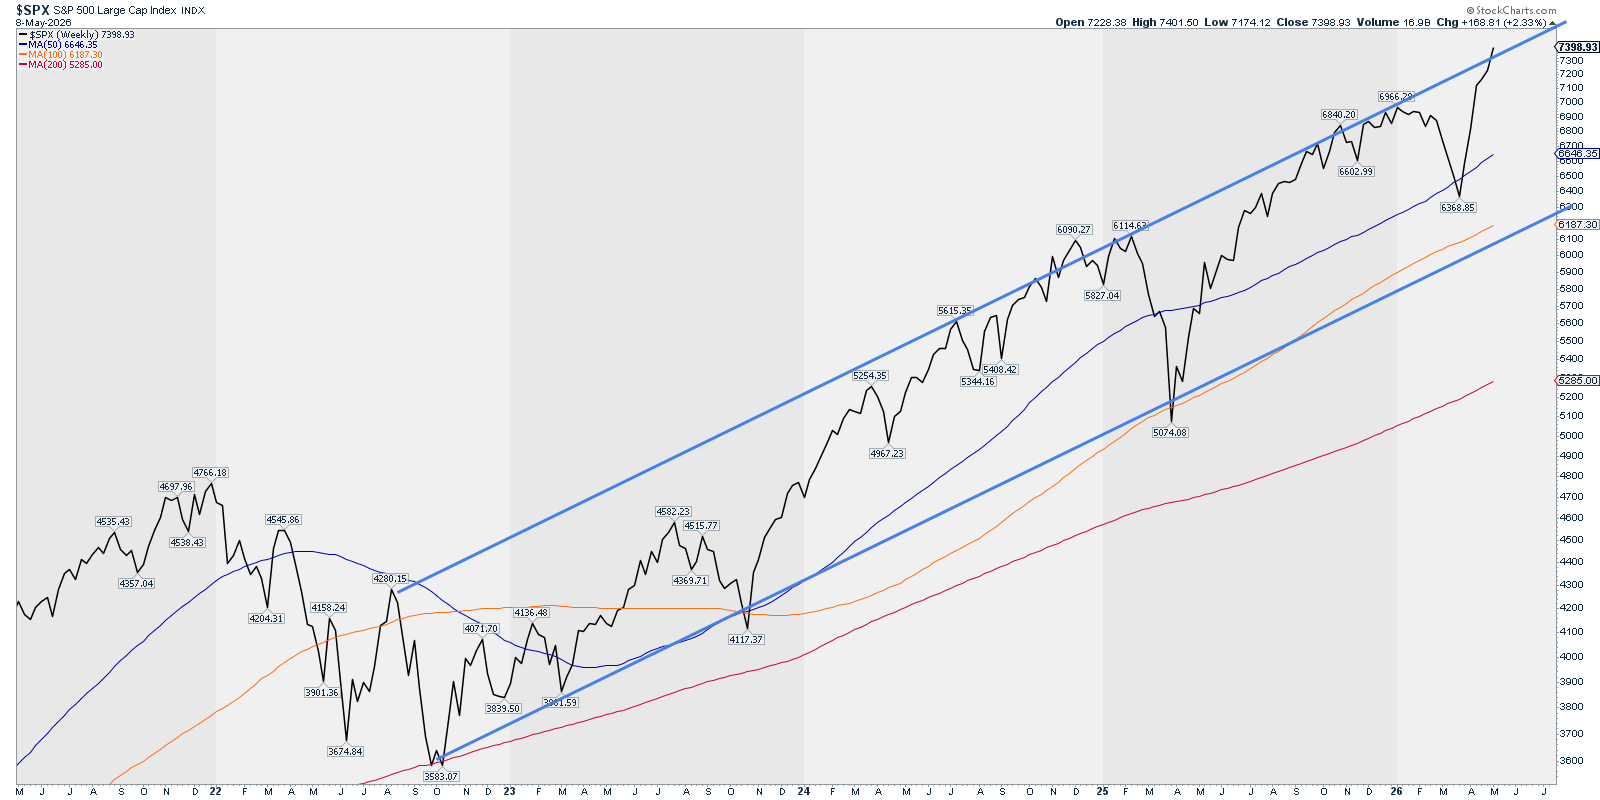
Analysis: Both channels broken on the upper side. Despite the action being bullish, this shall be considered late in the cycle and our outlook shall be bearish. We shall be selling positions here, not entering new ones.
Outlook: Bearish
Price Action: RSP – Trend – Weekly & Daily
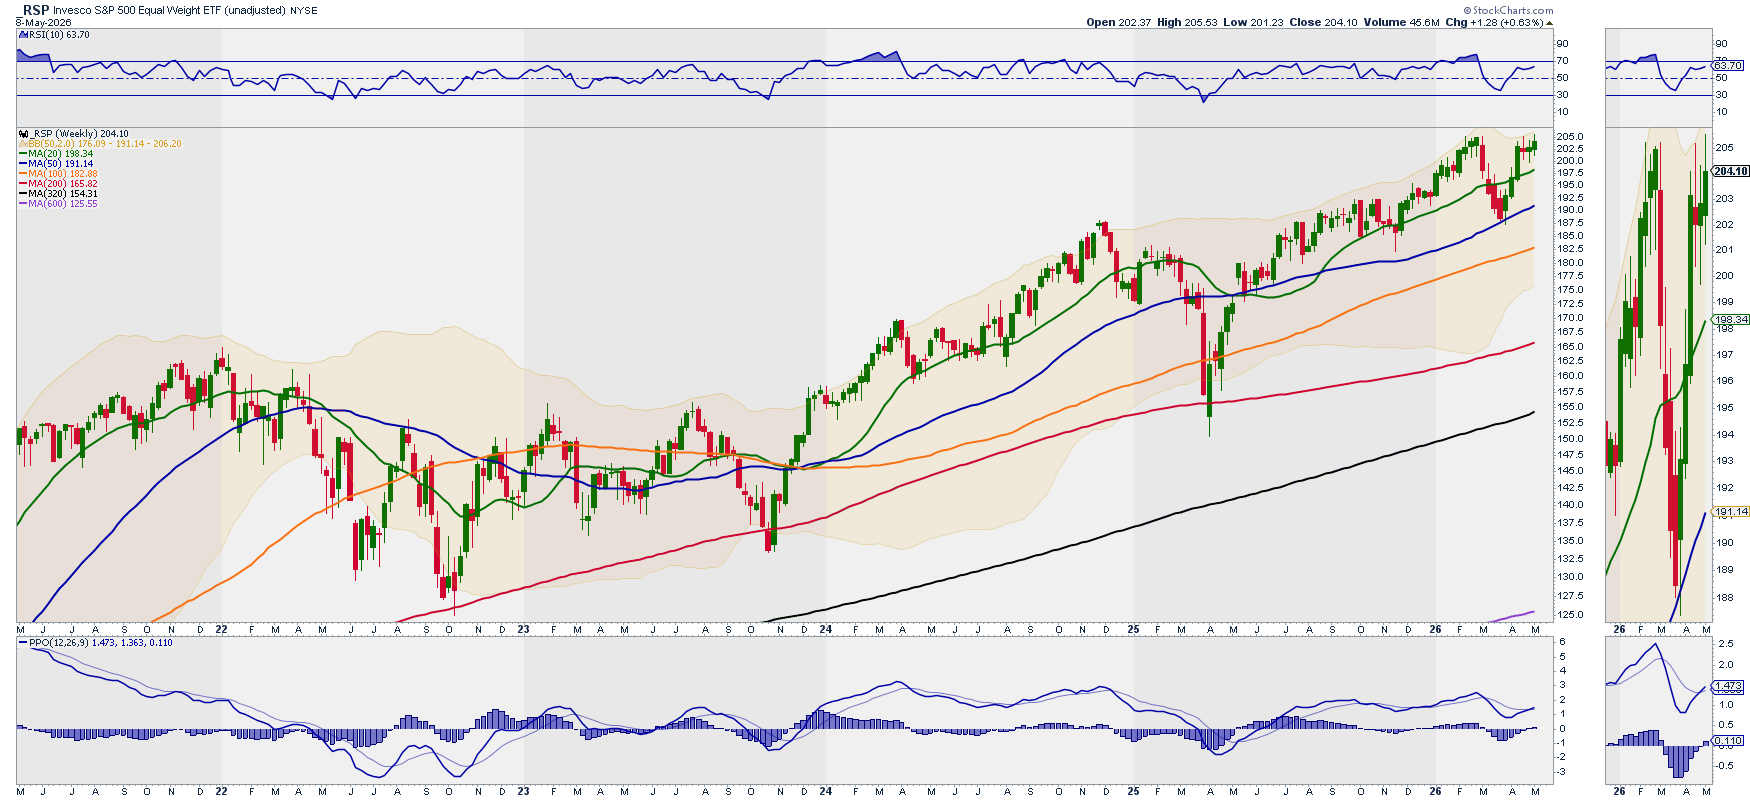
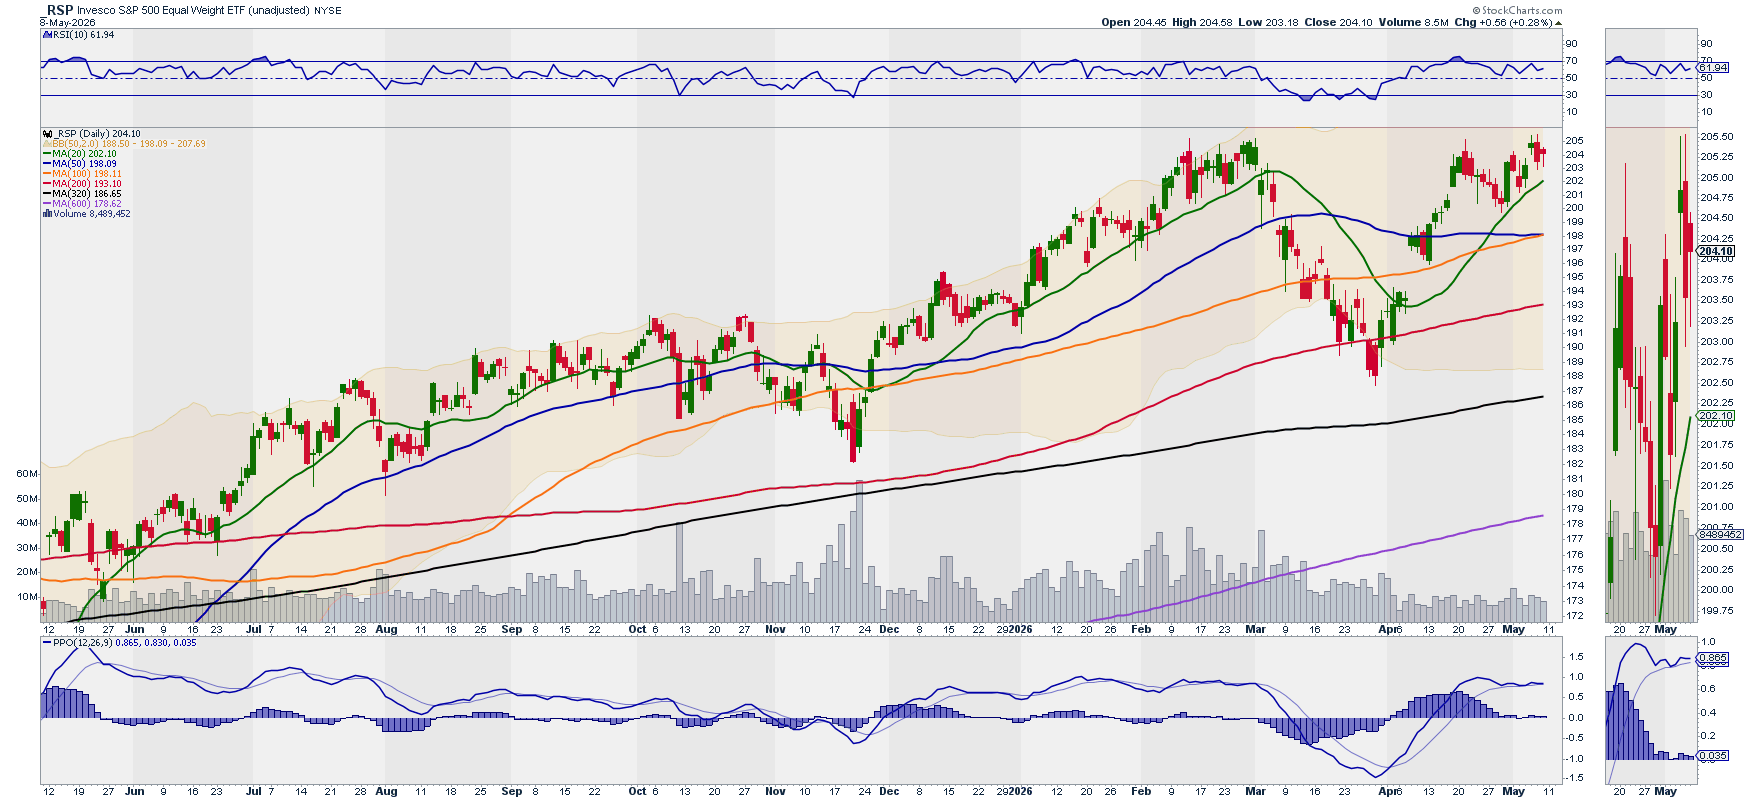
Analysis: Price and RSI are forming a bearish divergence. Price is also reaching a previous resistance level at $205. The ods of a reversal are increasing.
Outlook: Neutral-Bearish
Breadth & Volatility: % Stocks above SMAs vs. RSP
Above 200 Daily SMA
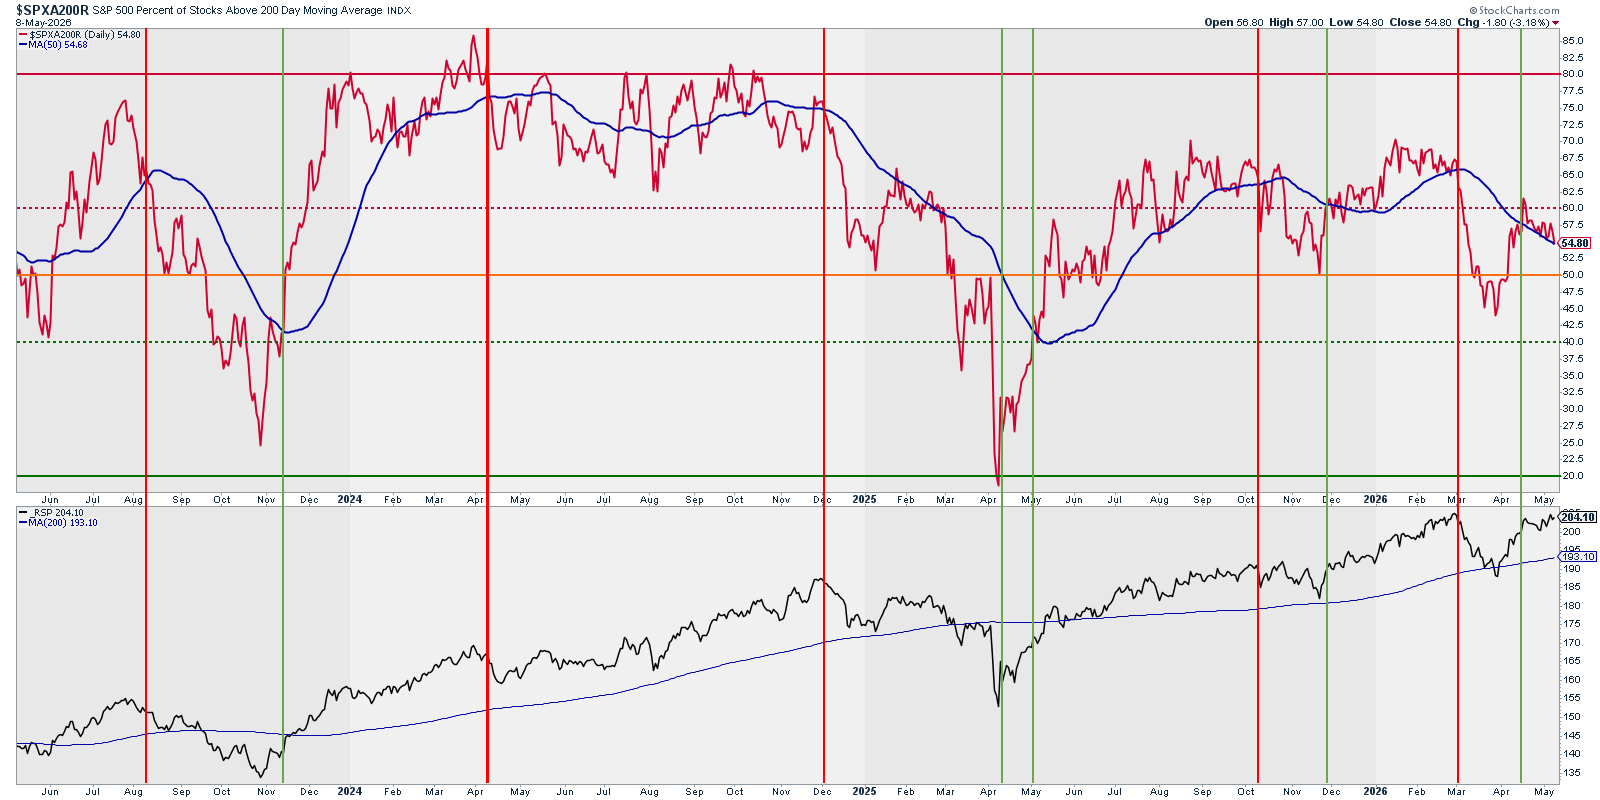
Above 20, 50, and 200 Daily SMAs
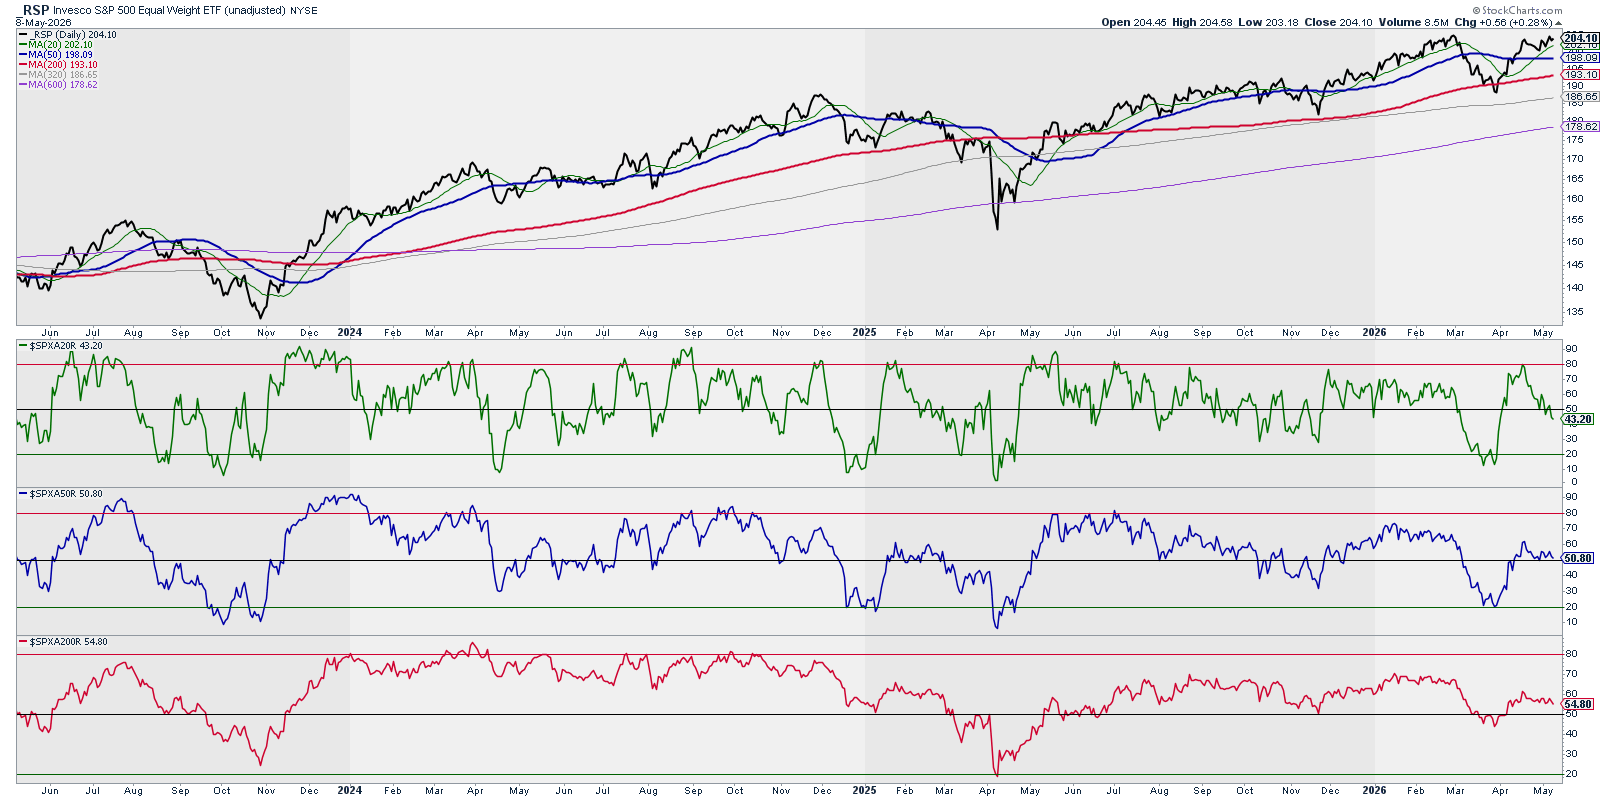
Analysis: Above 200D did not trigger the bearish signal because the SMA is trending lower at the same rate, otherwise we will have by now a bearish signal. The above 20D (green) has crossed the 50 level. In all previous occasions of the same setup, the RSP went low. I’m keeping the bearish outlook.
Outlook: Bearish
Breadth & Volatility: Bullish Pct. Index & McClellan Summation Index
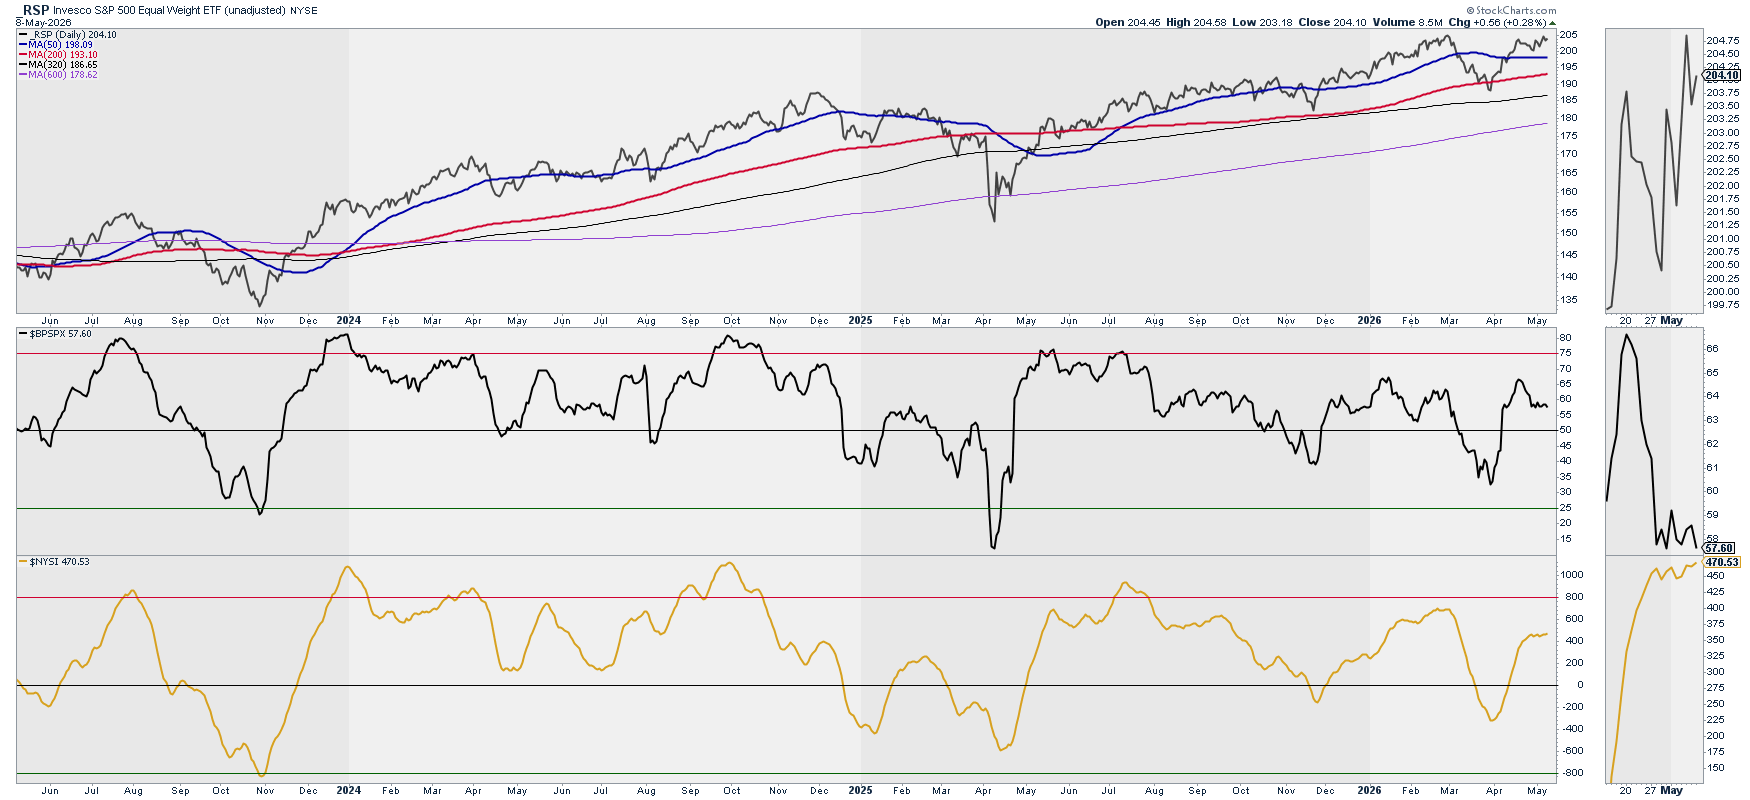
Analysis: Same readings as last weeks’. Both indexes are flat, which may signal a change in trend. Keeping the outlook in neutral.
Outlook: Neutral
Breadth & Volatility: Ratio Low Volatility Stocks / SPY vs. SPY and RSP
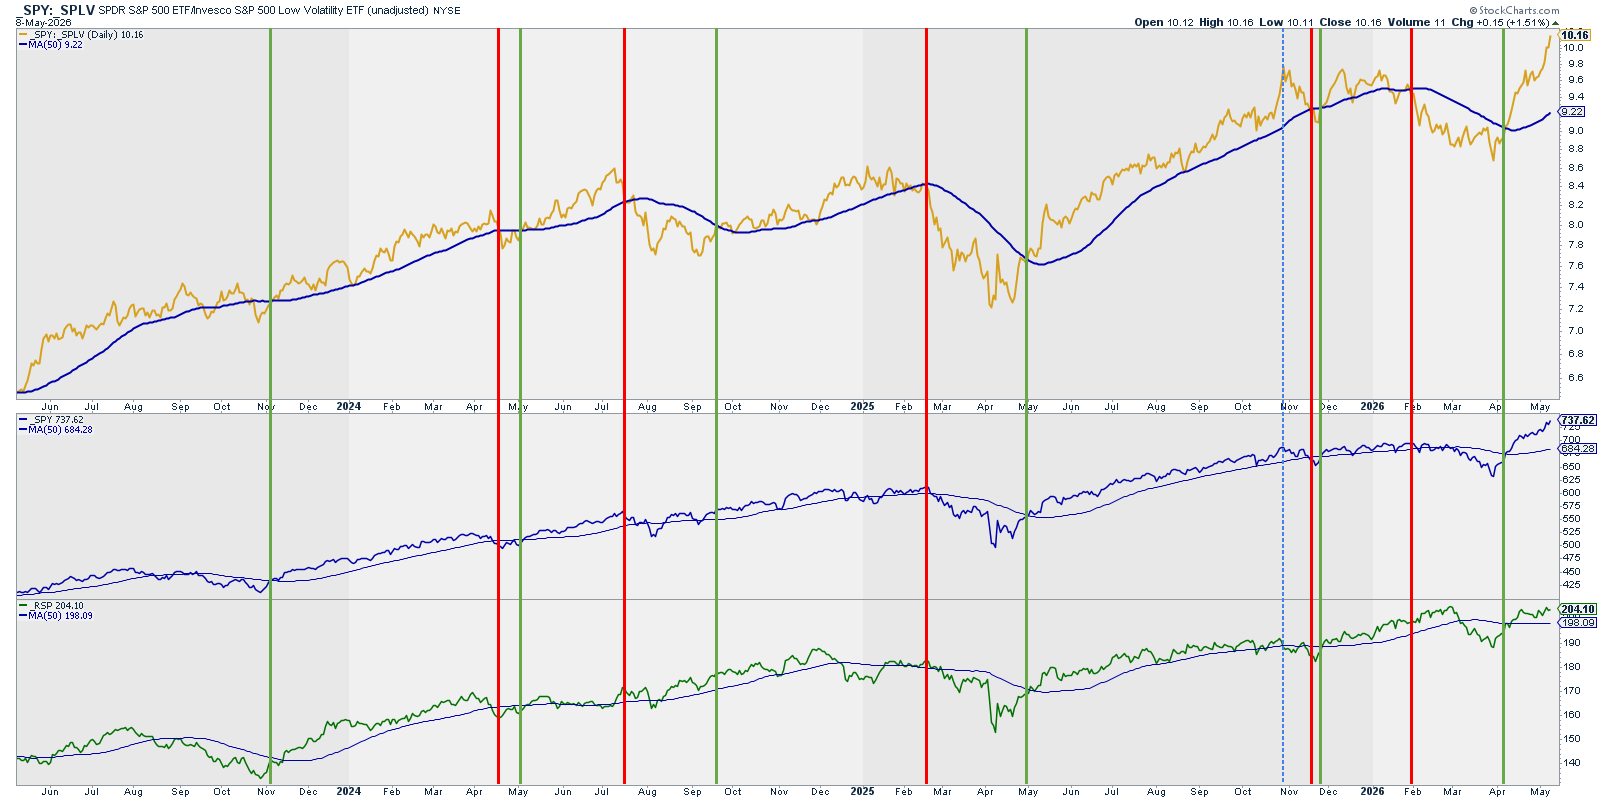
Analysis: Volatility ratio impacts more SPY than RSP. The signal is clearly bullish, even too bullish due to the incline of the ratio. Previous such step increases marked tops (dotted vertical blue line in Nov-2025). Due to this incline, I’m lowering the outlook to neutral from bullish.
Outlook: Neutral
Breadth & Volatility: New Highs vs. SPY & RSP
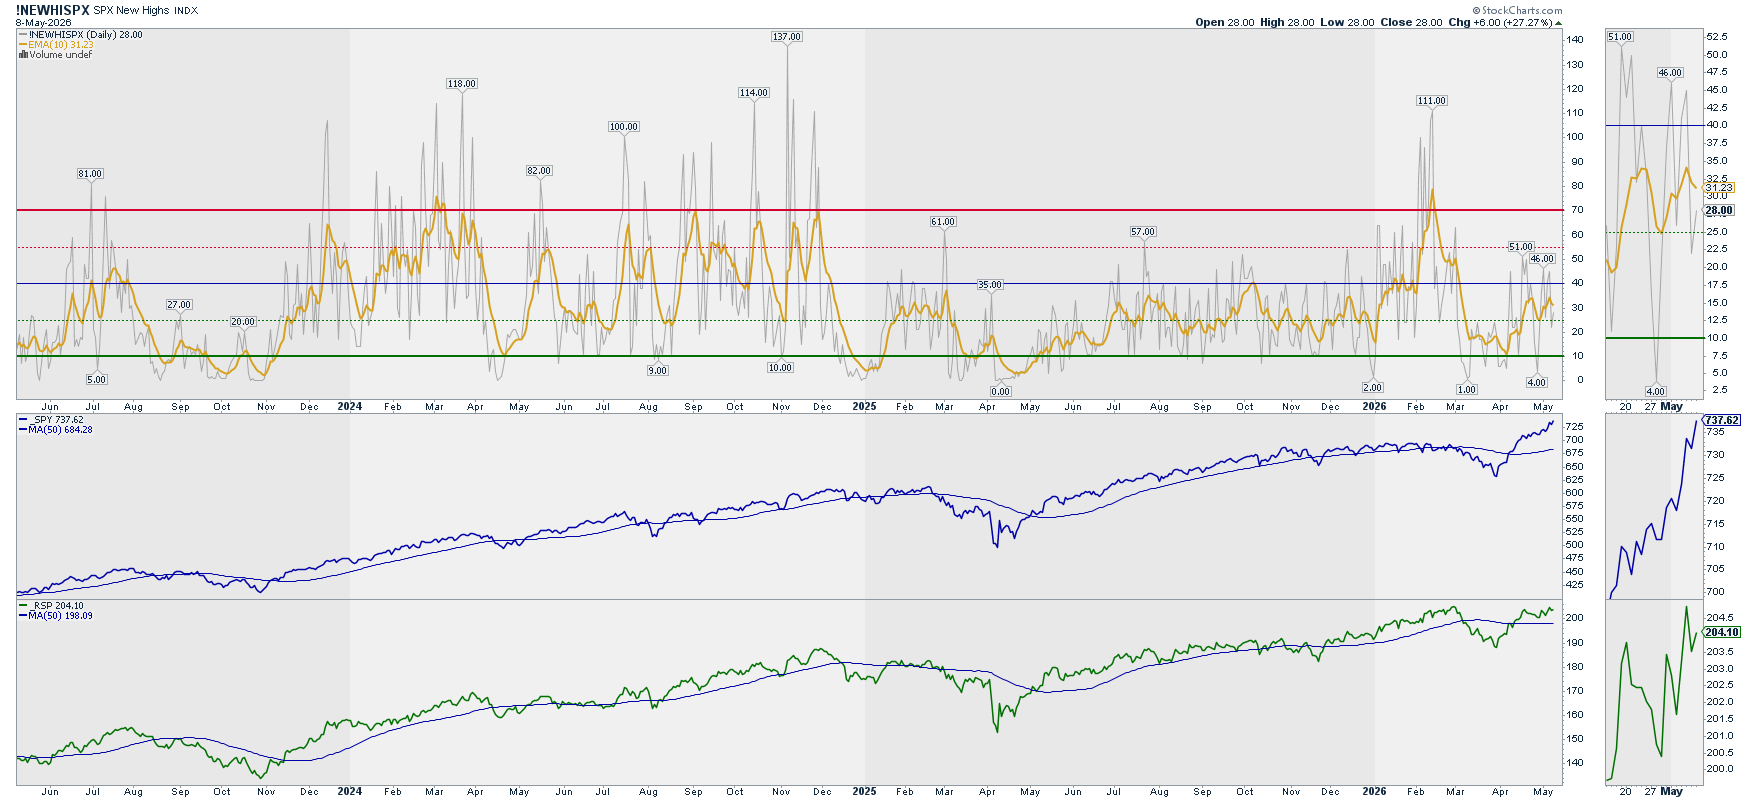
Analysis: No new highs readings and yet the SPY made new ATH. The divergence between SPY and RSP is quite remarkable. I’m keeping the bullish outlook.
Outlook: Bullish
Breadth & Volatility: VIX vs. SPY & RSP
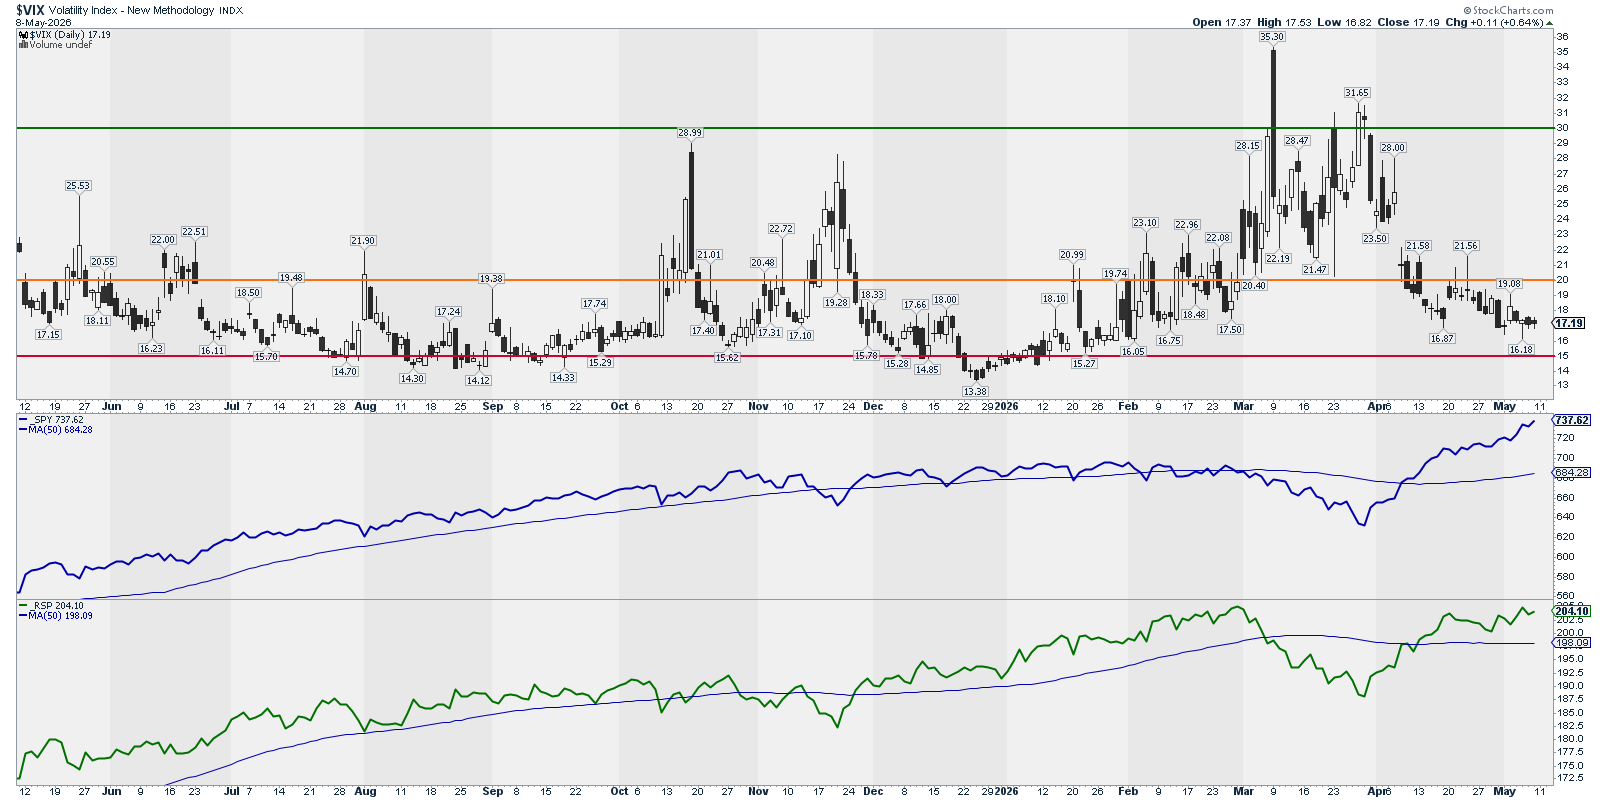
This chart is mainly to detect market bottoms.
Analysis: The trend continues trending lower towards the 15 level. I’m downgrading to Neutral-Bullish as we are getting very close to level 15.
Outlook: Neutral-Bullish
Options: (Inverted) Put/Call Ratio vs. SPY
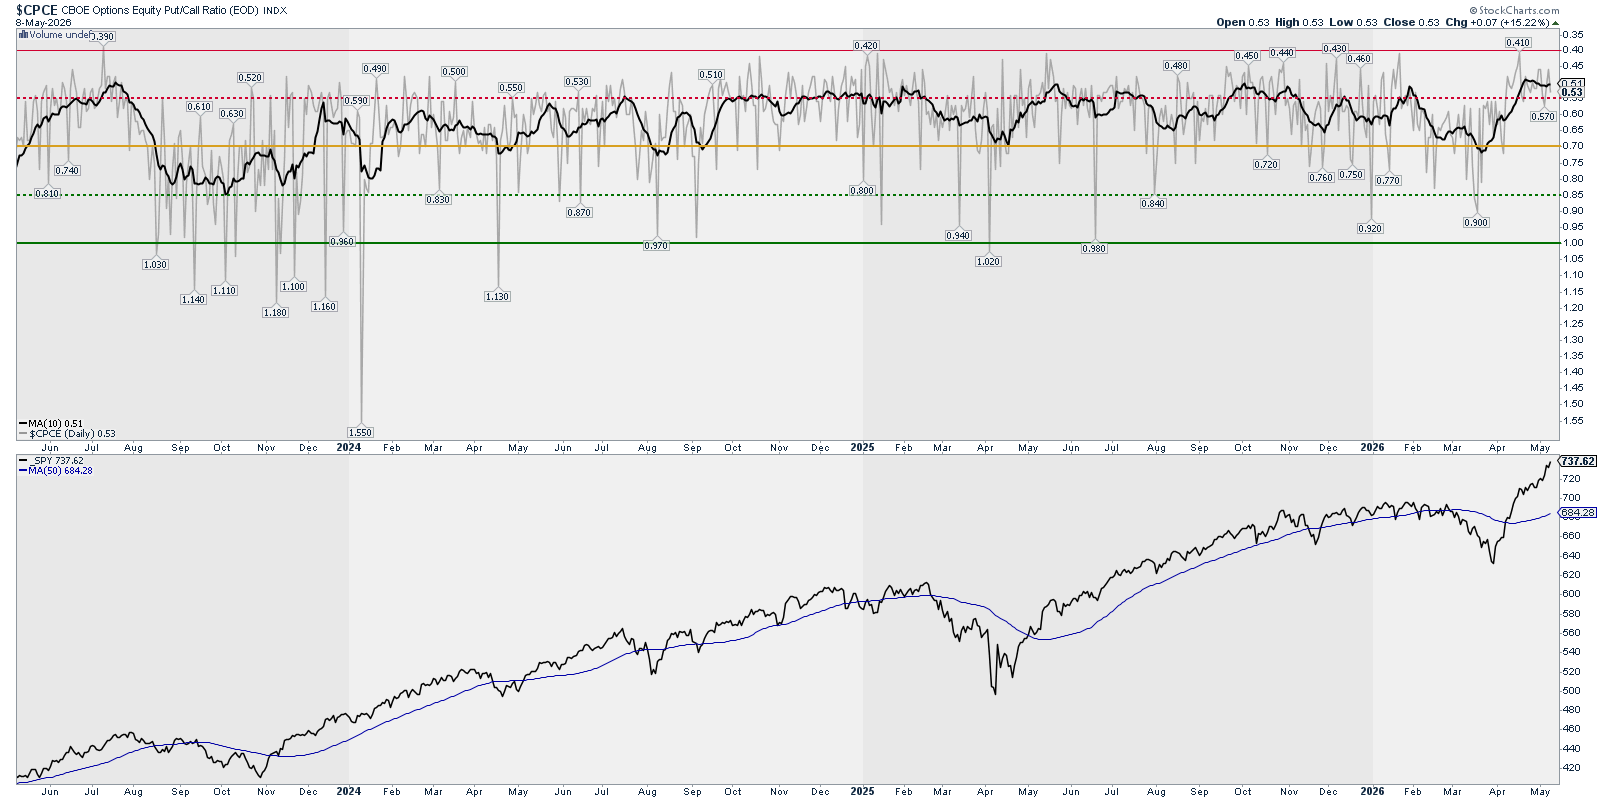
Analysis: Historically, at this levels in the P/C ratio, the market finds difficulties to advance. I’m keeping the outlook as Bearish.
Outlook: Bearish
Options: Gamma Exposure – SPX
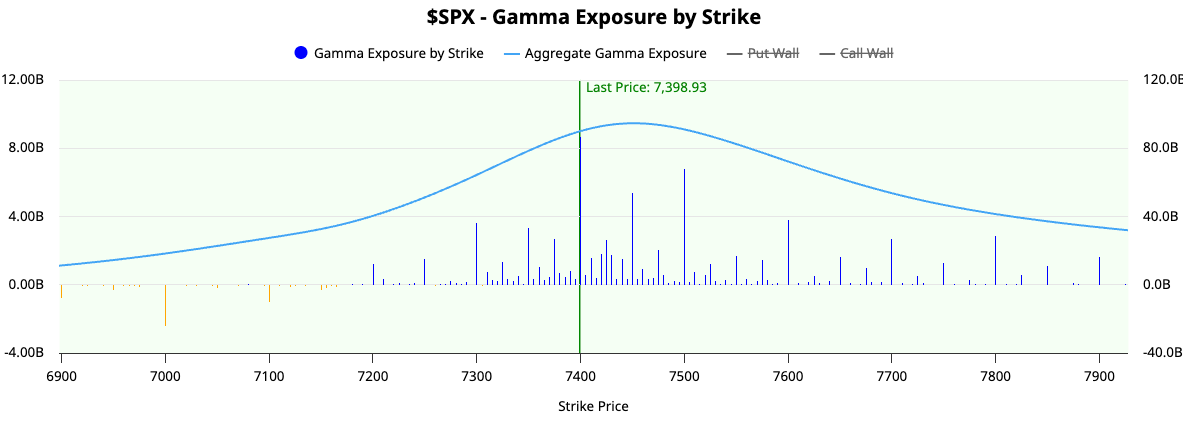
Analysis: Positive Gamma keeps increasing to higher levels at 7,500. We don’t see much support in lower levels (in contrast from last week). I’m keeping the bullish outlook as we still are in a positive gamma environment.
Outlook: Bullish
Level 2: What is happening? Summary
Price Action: Bearish
Breadth & Volatility: Neutral
Options: Neutral (one Bearish and one Bullish reading)
Where is it happening? – Level 3
Bulls vs. Bears: RSP vs. RSPD (Cons. Disc. – Bulls) and RSPS (Cons. Sta. – Bears)
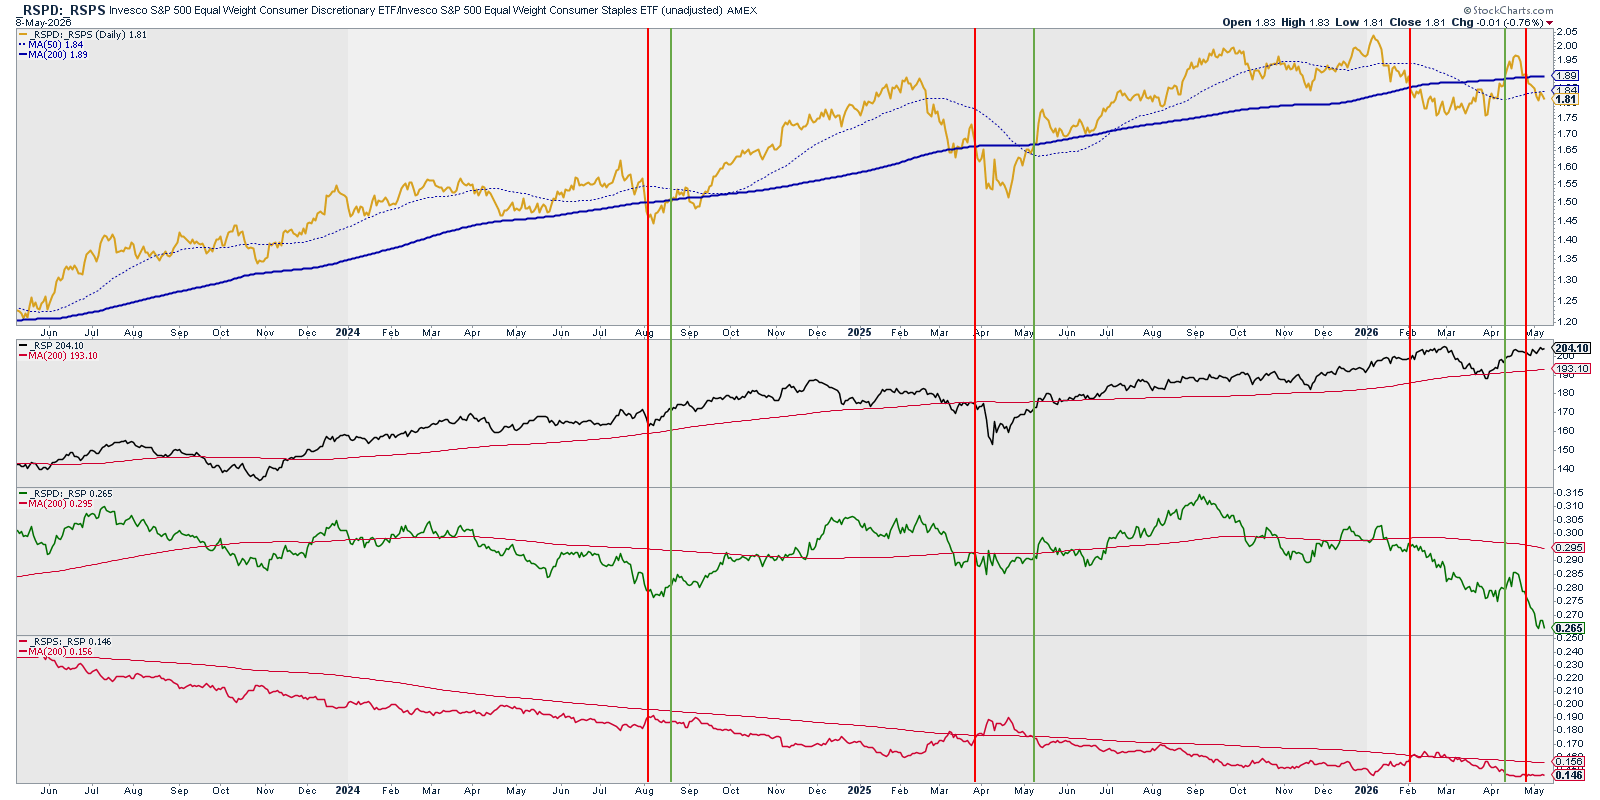
Analysis: Bearish signal (yellow) triggered and Bulls (green) are very weak and not getting stronger.
Outlook: Bearish
Sectors Rotation
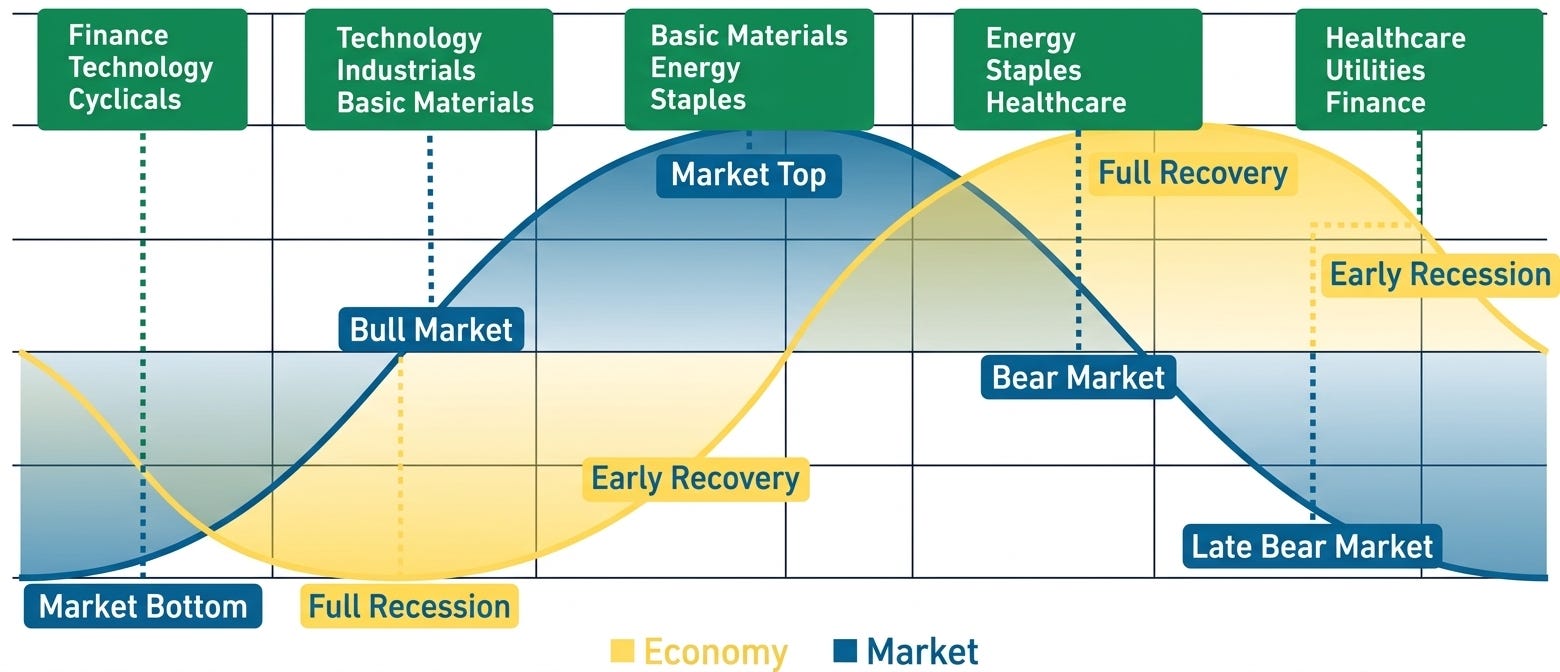
Market & Economy Rotation
US Sectors order by ISM PMI Correlation (between parenthesis)
Growth Sectors - shall outperform when the market is bullish:
XLK: Technology (71%)
XLY: Cons. Discretionary (67%)
XLI: Industrials (66%)
XLB: Basic Materials (66%)
XLF: Financials (59%)
Value Sectors - shall outperform when the market is bearish:
XLV: Healthcare (55%)
XLC: Communications (49%)
XLE: Energy (44%)
XLU: Utilities (35%)
XLP: Cons. Staples (30%)
XLRE: Real Estate (16%)
Analysis:
With a market moving at this speed is difficult to decide in which moment of the cycle we are. We know that the economy is improving from lower levels, so we could consider it “Early Recovery”. The market, after the noise brought by the Iran war, is signalling towards a Bull Market as we shall see Technology and Industrials leading.
Sectors Performance
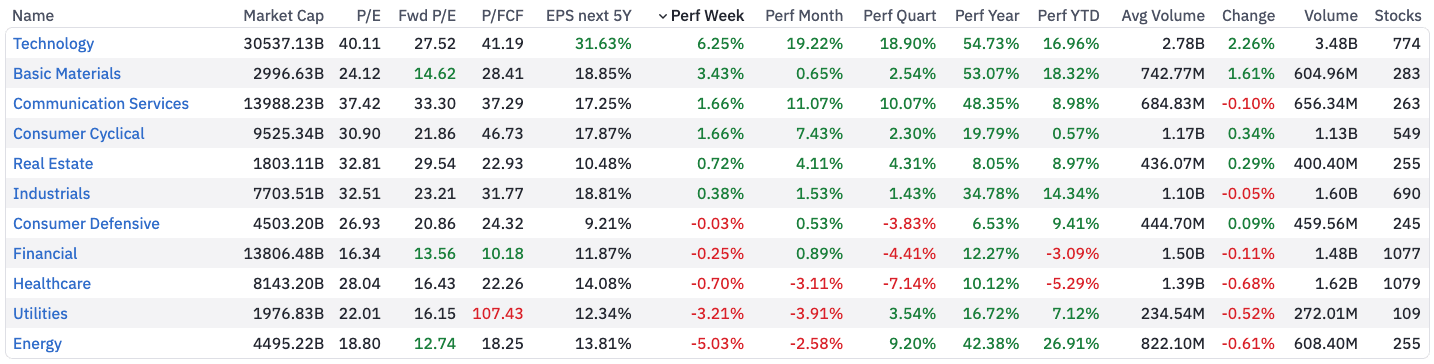
Analysis: Technology led this past week performance, Energy the YTD performance, followed by Basic Materials, and Industrials.
It’s interesting to see the poor performance in Financials and Healthcare. I guess that the market main narratives are AI, the US industrial boom (led by AI data centers), and obviously the Iran’s war.
Sectors Bullish Percent Index
Growth Sectors:
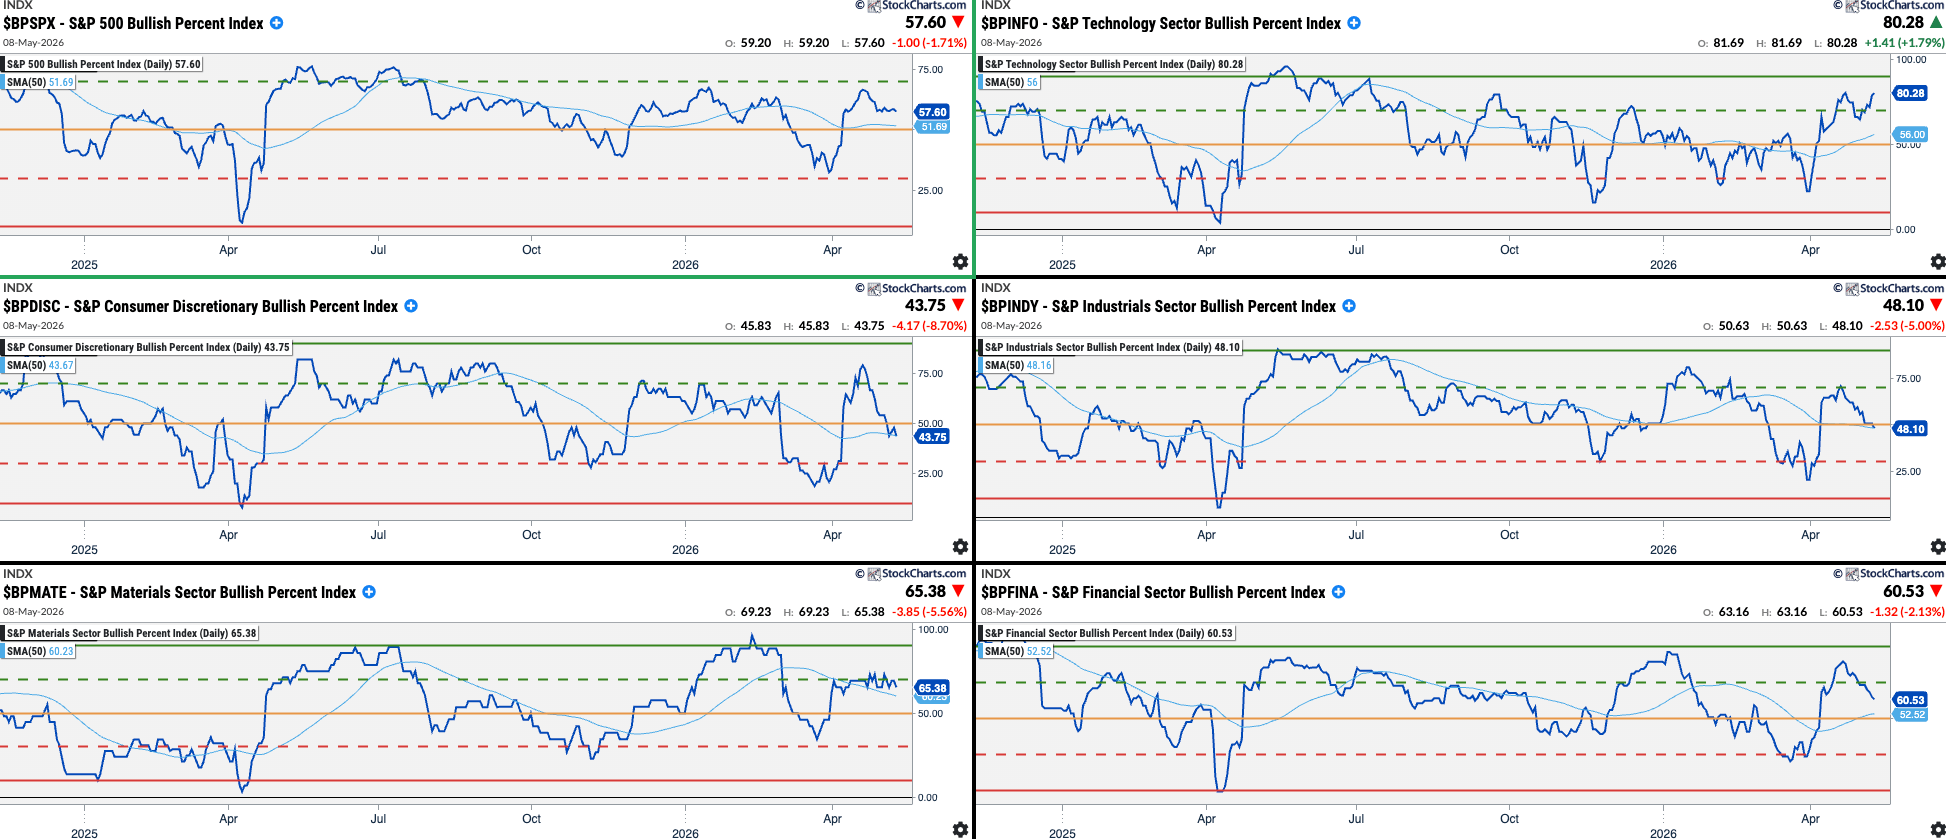
Value Sectors:
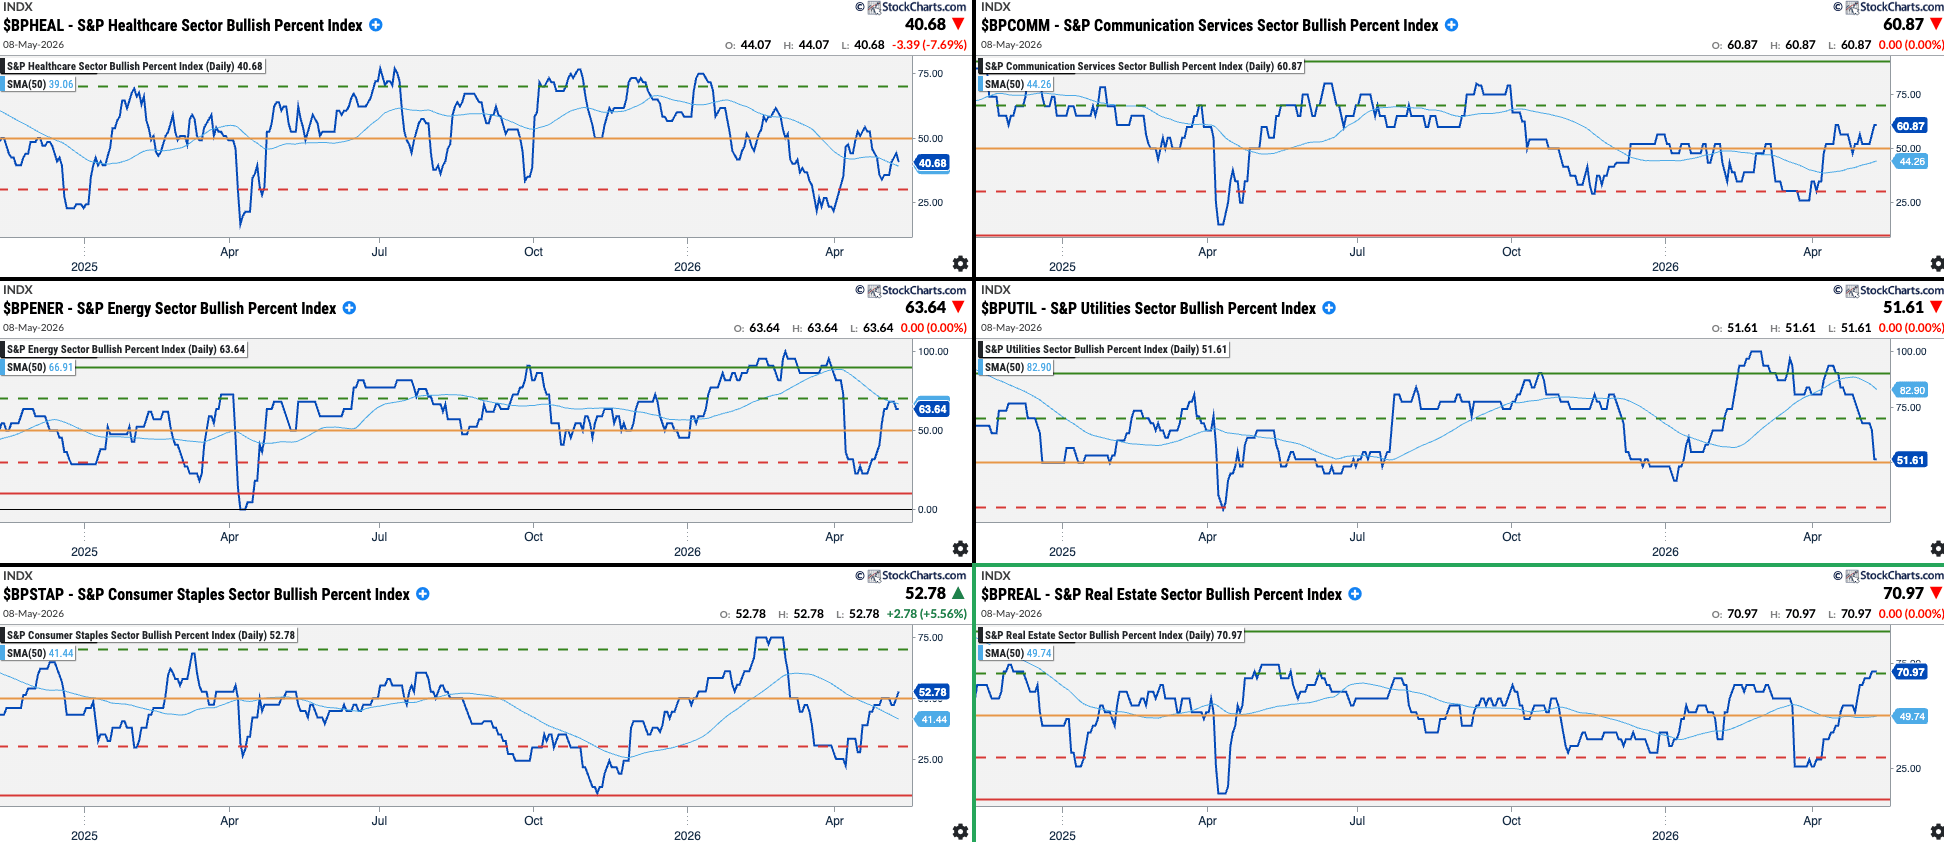
Any sectors below their red levels are good opportunities to find great companies at good valuations or buy sector ETFs (buy cheap). Those sectors above their Green levels are candidates to be sold (sell expensive).
Buy Opportunities: Consumer Staples
Sell Opportunities: None
Level 3: Where is it happening? Summary
Bulls vs. Bears: Bearish
Market & Economy Rotation: Bull Market
All Levels Summary and Final Thoughts
Level 1 Summary - The Why
Economic Data (long-term): Bullish (with a neutral note on that consumer confidence)
USD & Interest Rates: Bearish (due to Interest Rates)
Investors Sentiment: Bullish
Level 2 Summary - The What
Price Action: Bearish
Breadth & Volatility: Neutral
Options: Neutral (one Bearish and one Bullish reading)
Level 3 Summary - The Where
Bulls vs. Bears: Bearish
Market & Economy Rotation: Bull Market
Level 4: Scanning for opportunities
Stock Screener
Descriptive
Index: S&P500 | Market Cap.: +Mid (+$2B) | Option/Short: Yes/Yes
Avg. Volume: >1M | Relative Vol.: Over 1 | Price: >$20
Fundamental
EPS Growth Next Year: >15%
Technical
Performance: Quarter Up | Price > 50D SMA | Price > 200D SMA | Beta > 1 | ATR > 1
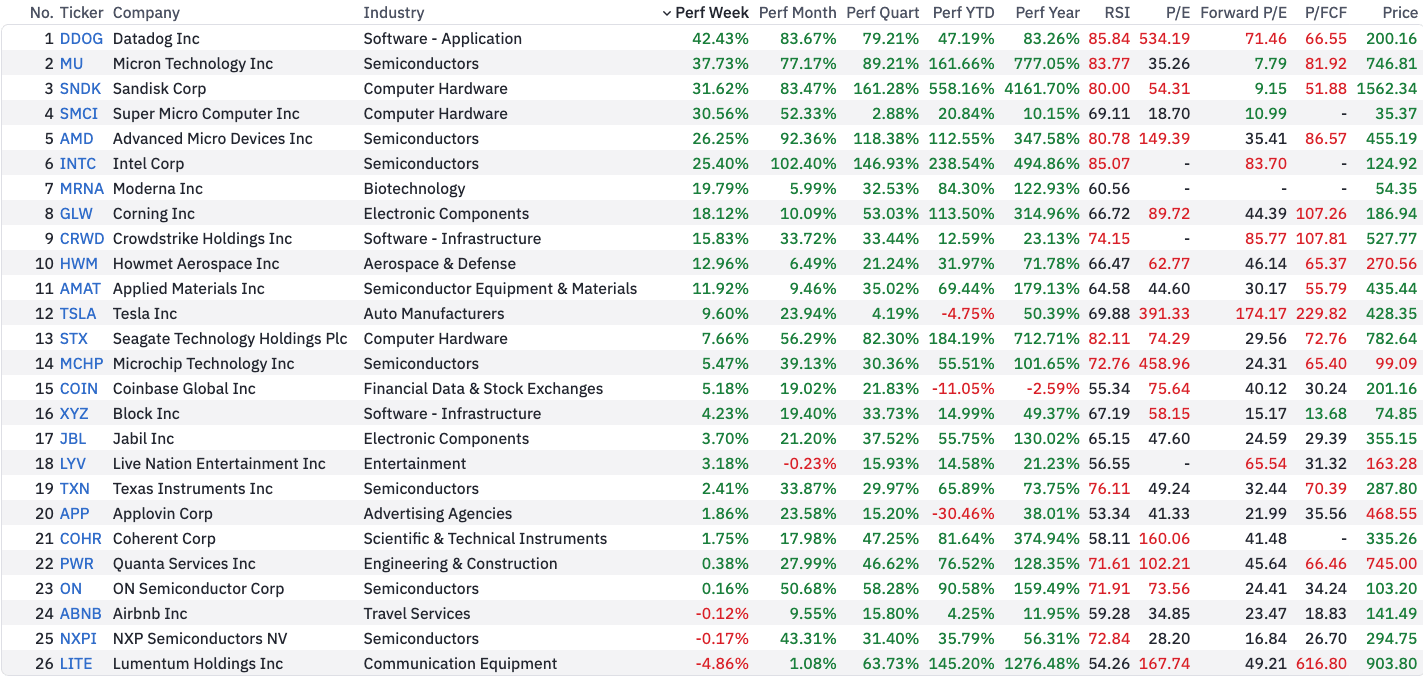
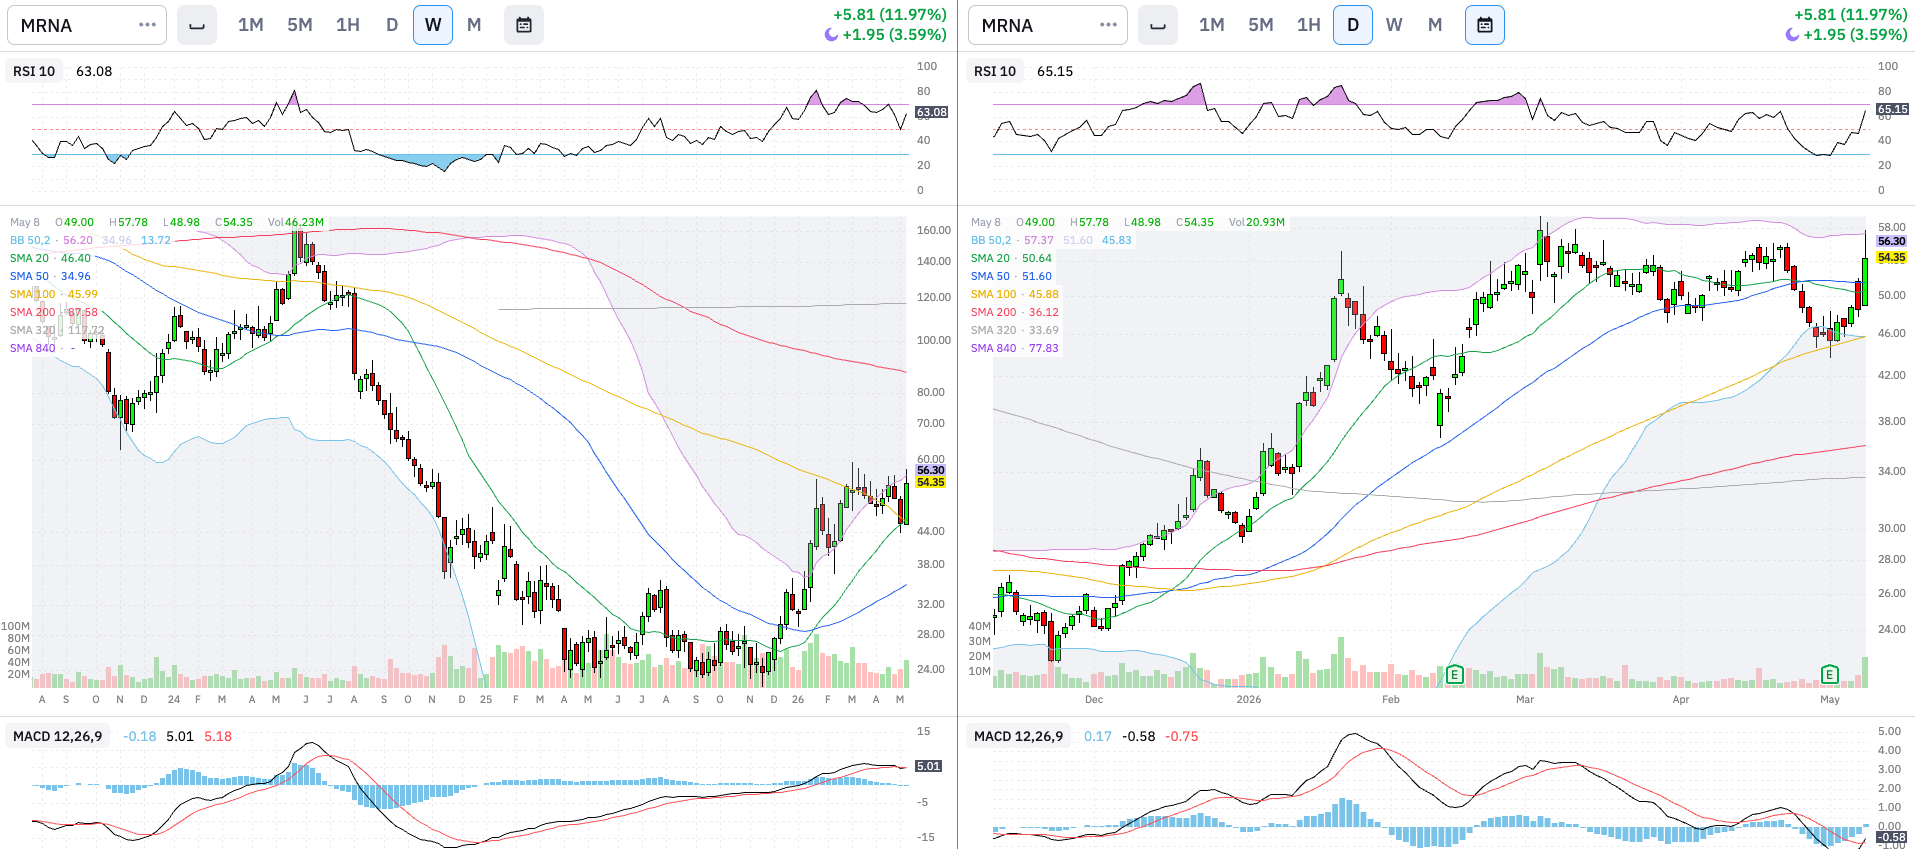
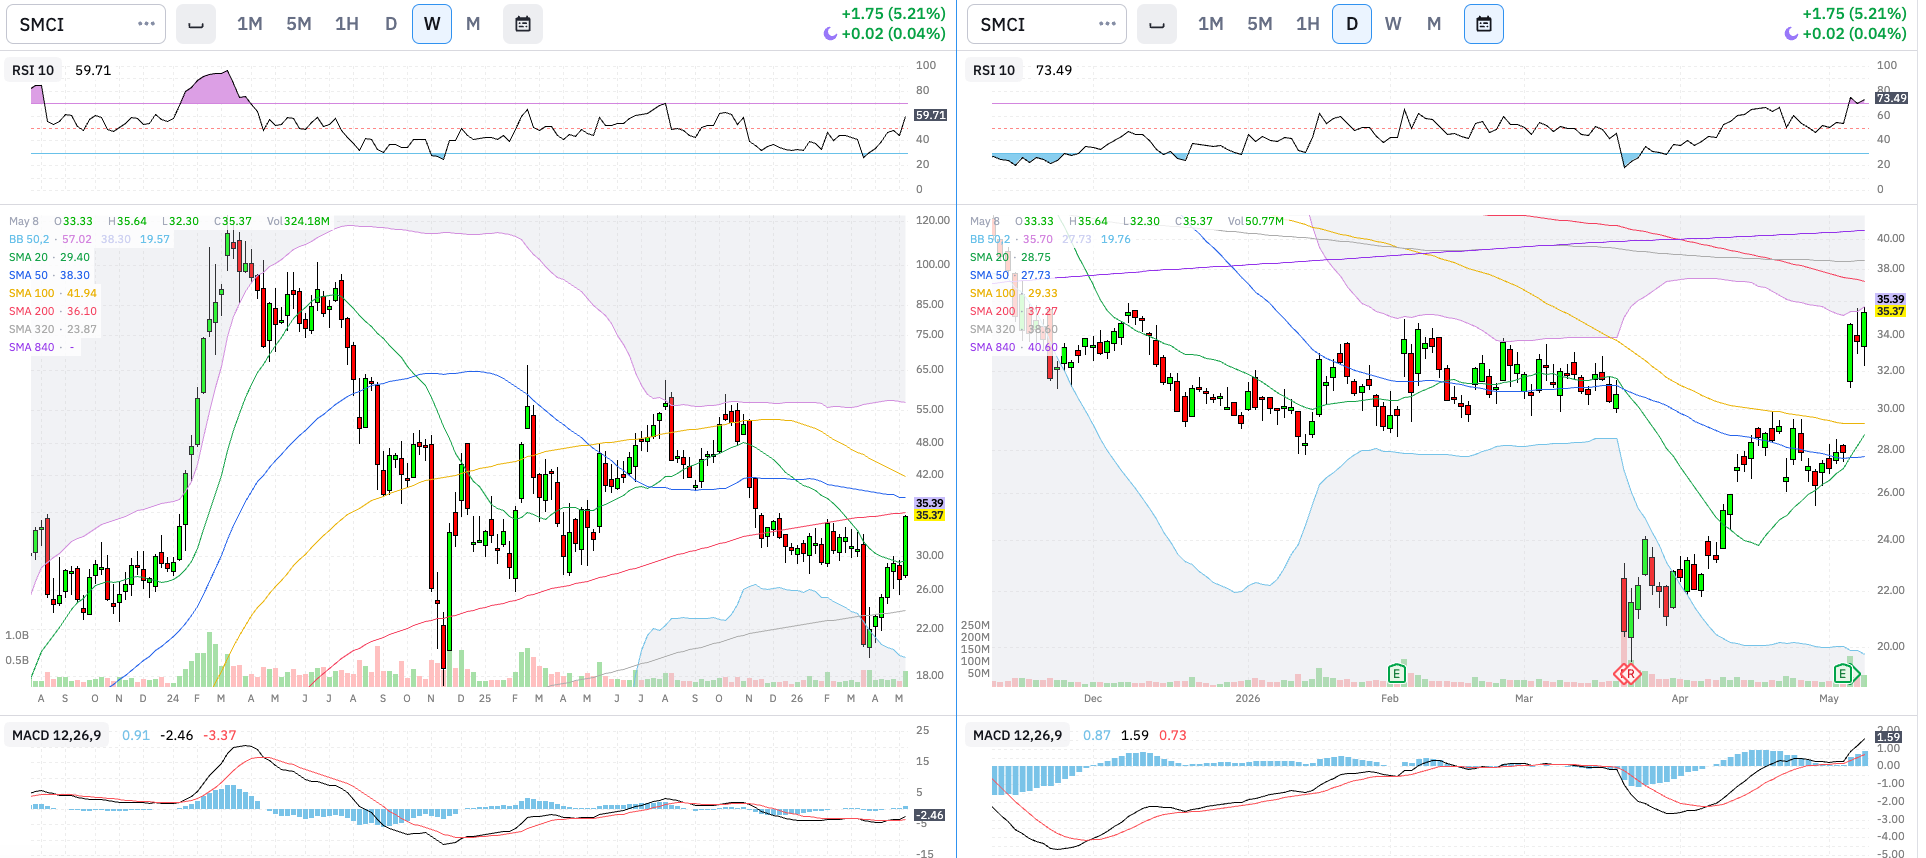
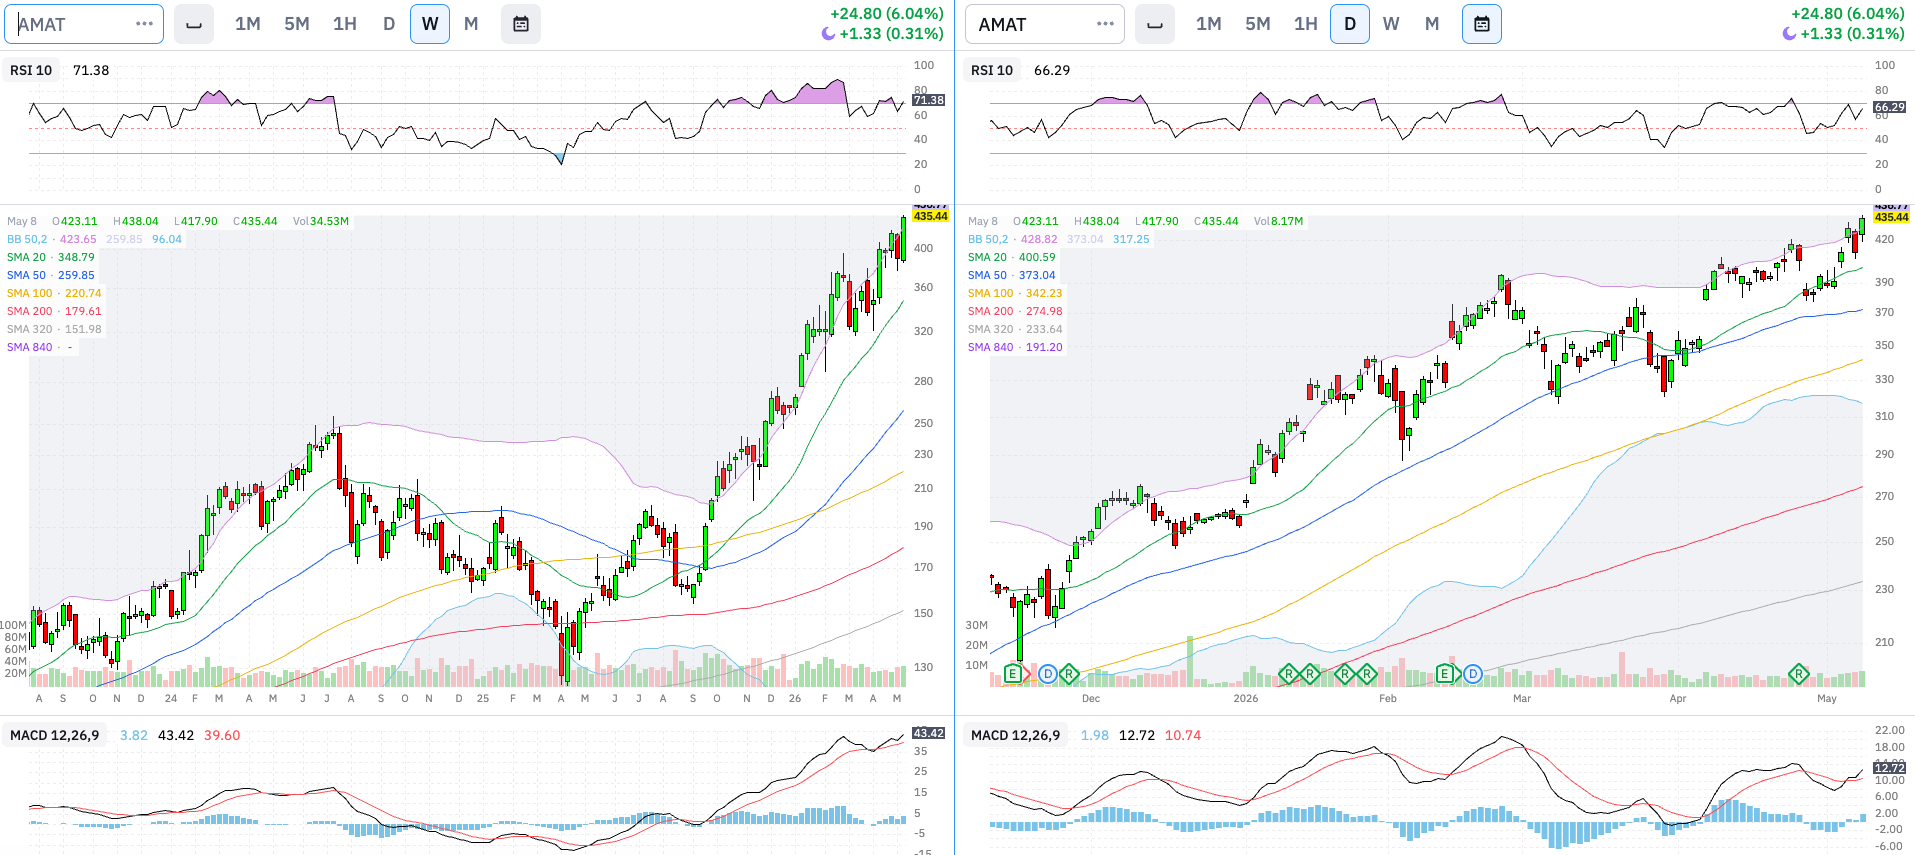
I like: SMCI, MRNA, and AMAT:
Disclaimer: The content on AMAT Investing is strictly for educational and learning purposes. The author is not a licensed financial advisor and holds no formal financial education. This post does not constitute professional financial advice. All investing involves risk of loss. Always conduct your own research and consult a licensed professional before making any investment decisions.