

Weekly Review - 2026-Mar-27
Markets breaking as the Iran war turns nasty

US Cap. Weighted Sectors ordered by weekly performance (desc):
Weekly:
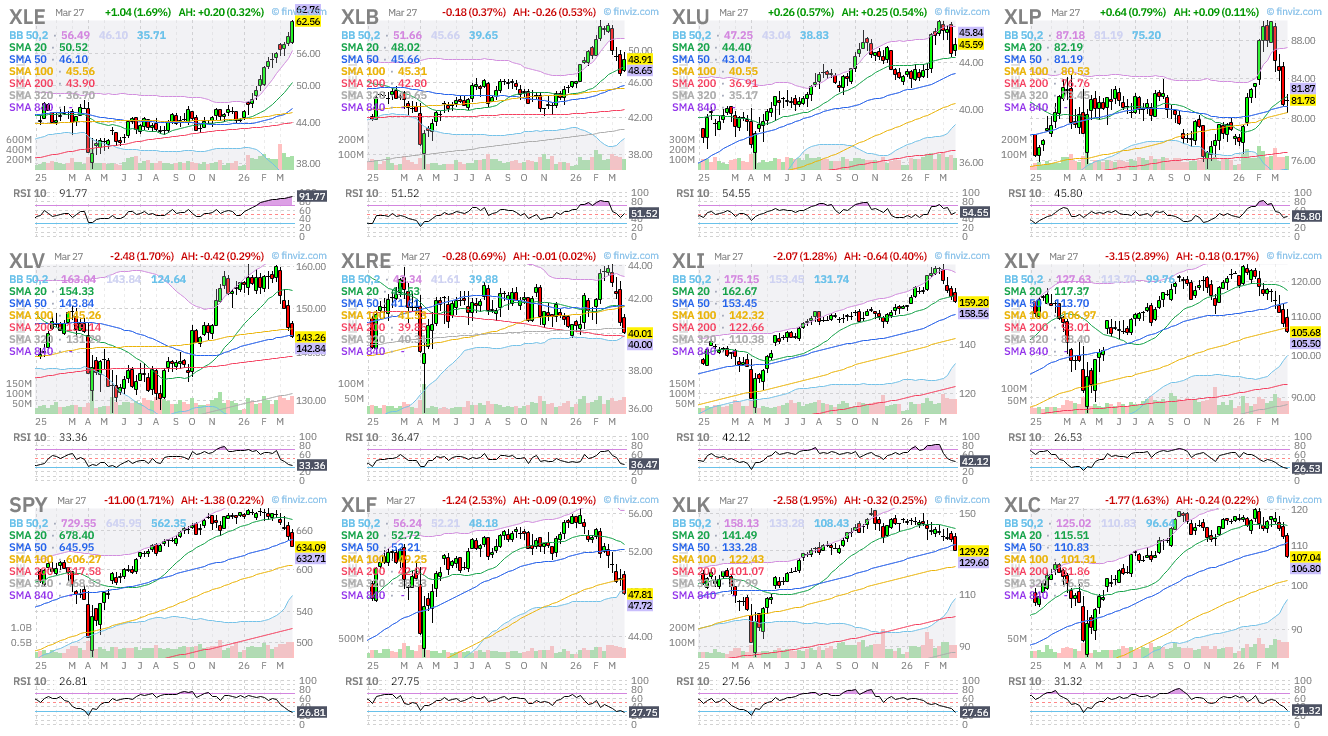
Daily:
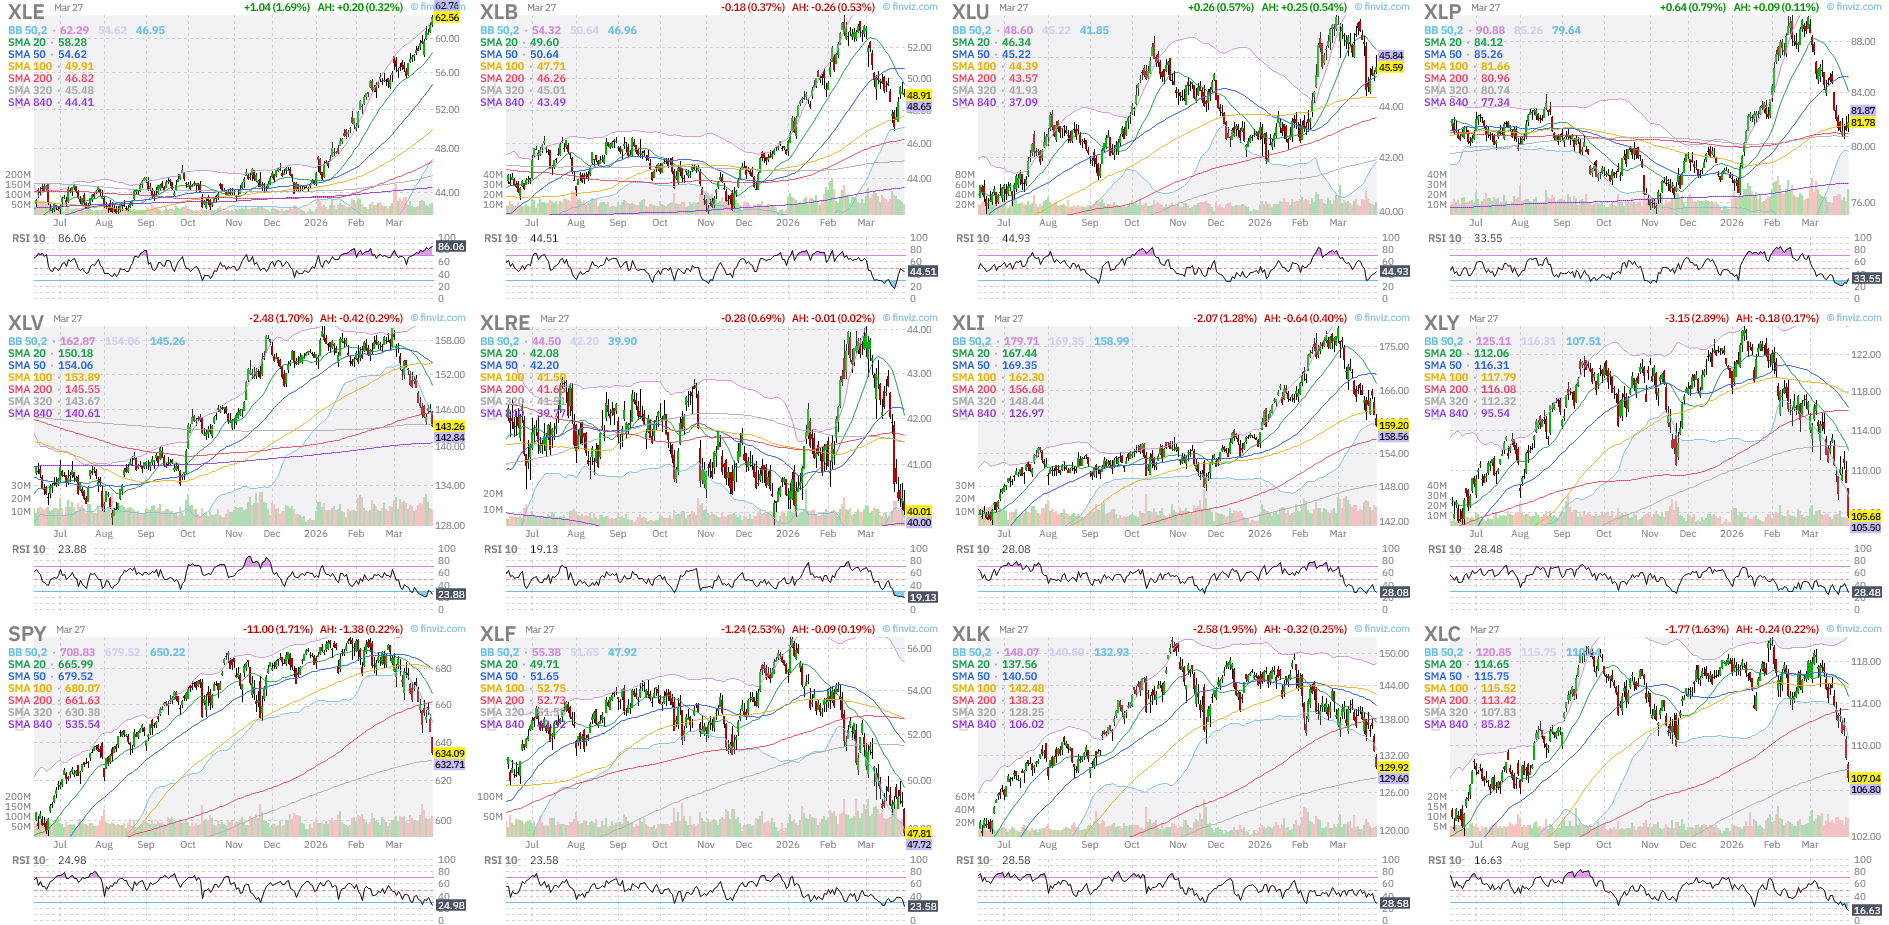
Comment: SPY continues its downward trend and it is approaching the SMA 320 an important resistance that has held multiple times before:
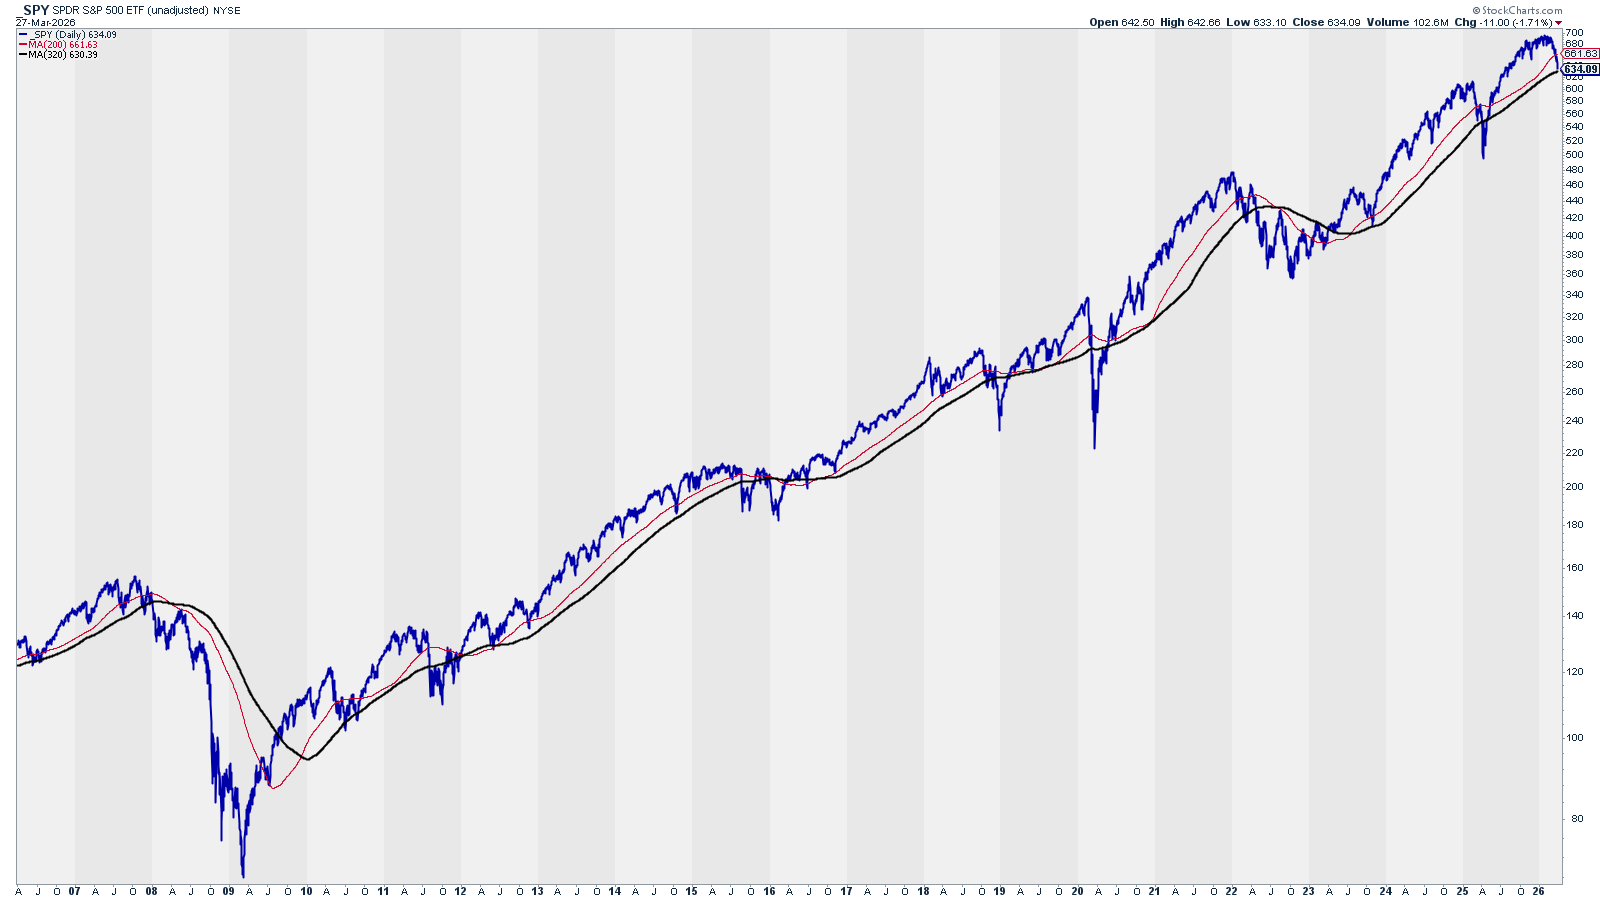
Here is a chart with the last 20 years of daily SPY with the SMA 200 (red) and SMA 320 (black).
The index, thought, is not reflecting the damage that really has happened in the underlying stocks as shown by this chart by the Daily Number:

The chart displays eleven sectors along the horizontal axis. Each sector contains two vertical bars. The green bars represent the 52-week drawdown of the sector index. The red bars represent the average 52-week drawdown of the individual stocks within that sector.
The Takeaway: The average stock is falling much more than the sector indexes. This gap appears in every sector on this chart.
This chart reinforces AMAT’s strategy to center our investment portfolios in indexes and ETFs. Our chances of success are higher than with individual stocks. Yes, our upside opportunities may be lower than with individual stocks, but for that we will leverage options, if we need to risk capital we will do it to maximize our return.
Why is it happening? – Level 1
Economic Data: Production: ISM PMI vs. SPX
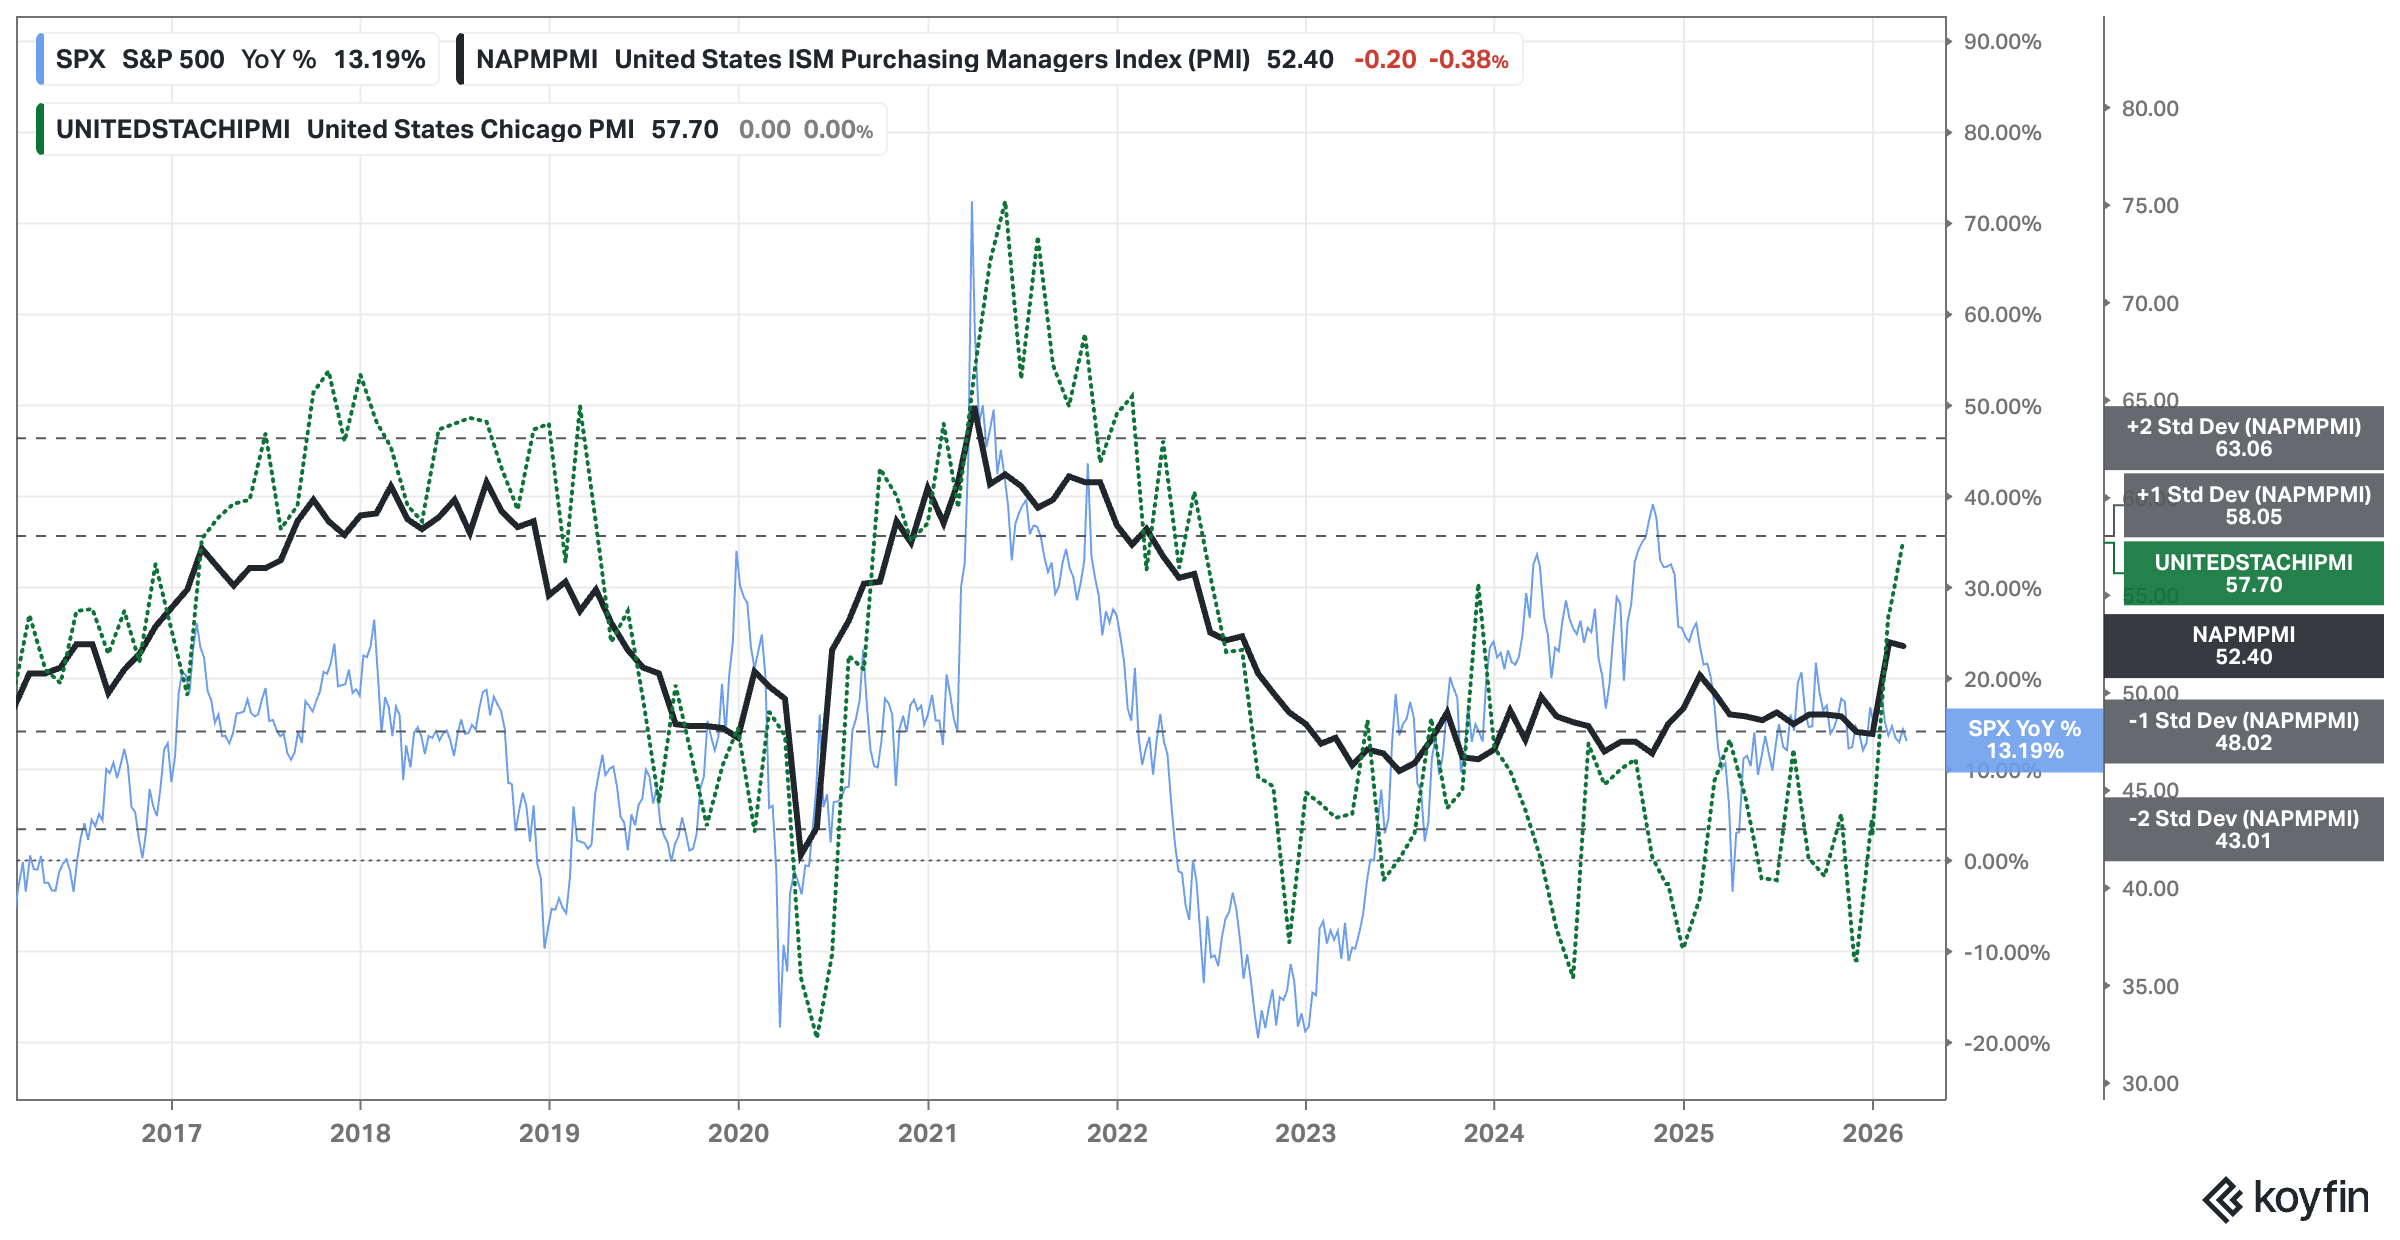
Analysis: No changes since last week.
Outlook: Bullish
Why is it happening? – Level 1
Economic Data: Production: Dallas & Philadelphia Manufacturing vs. SPX
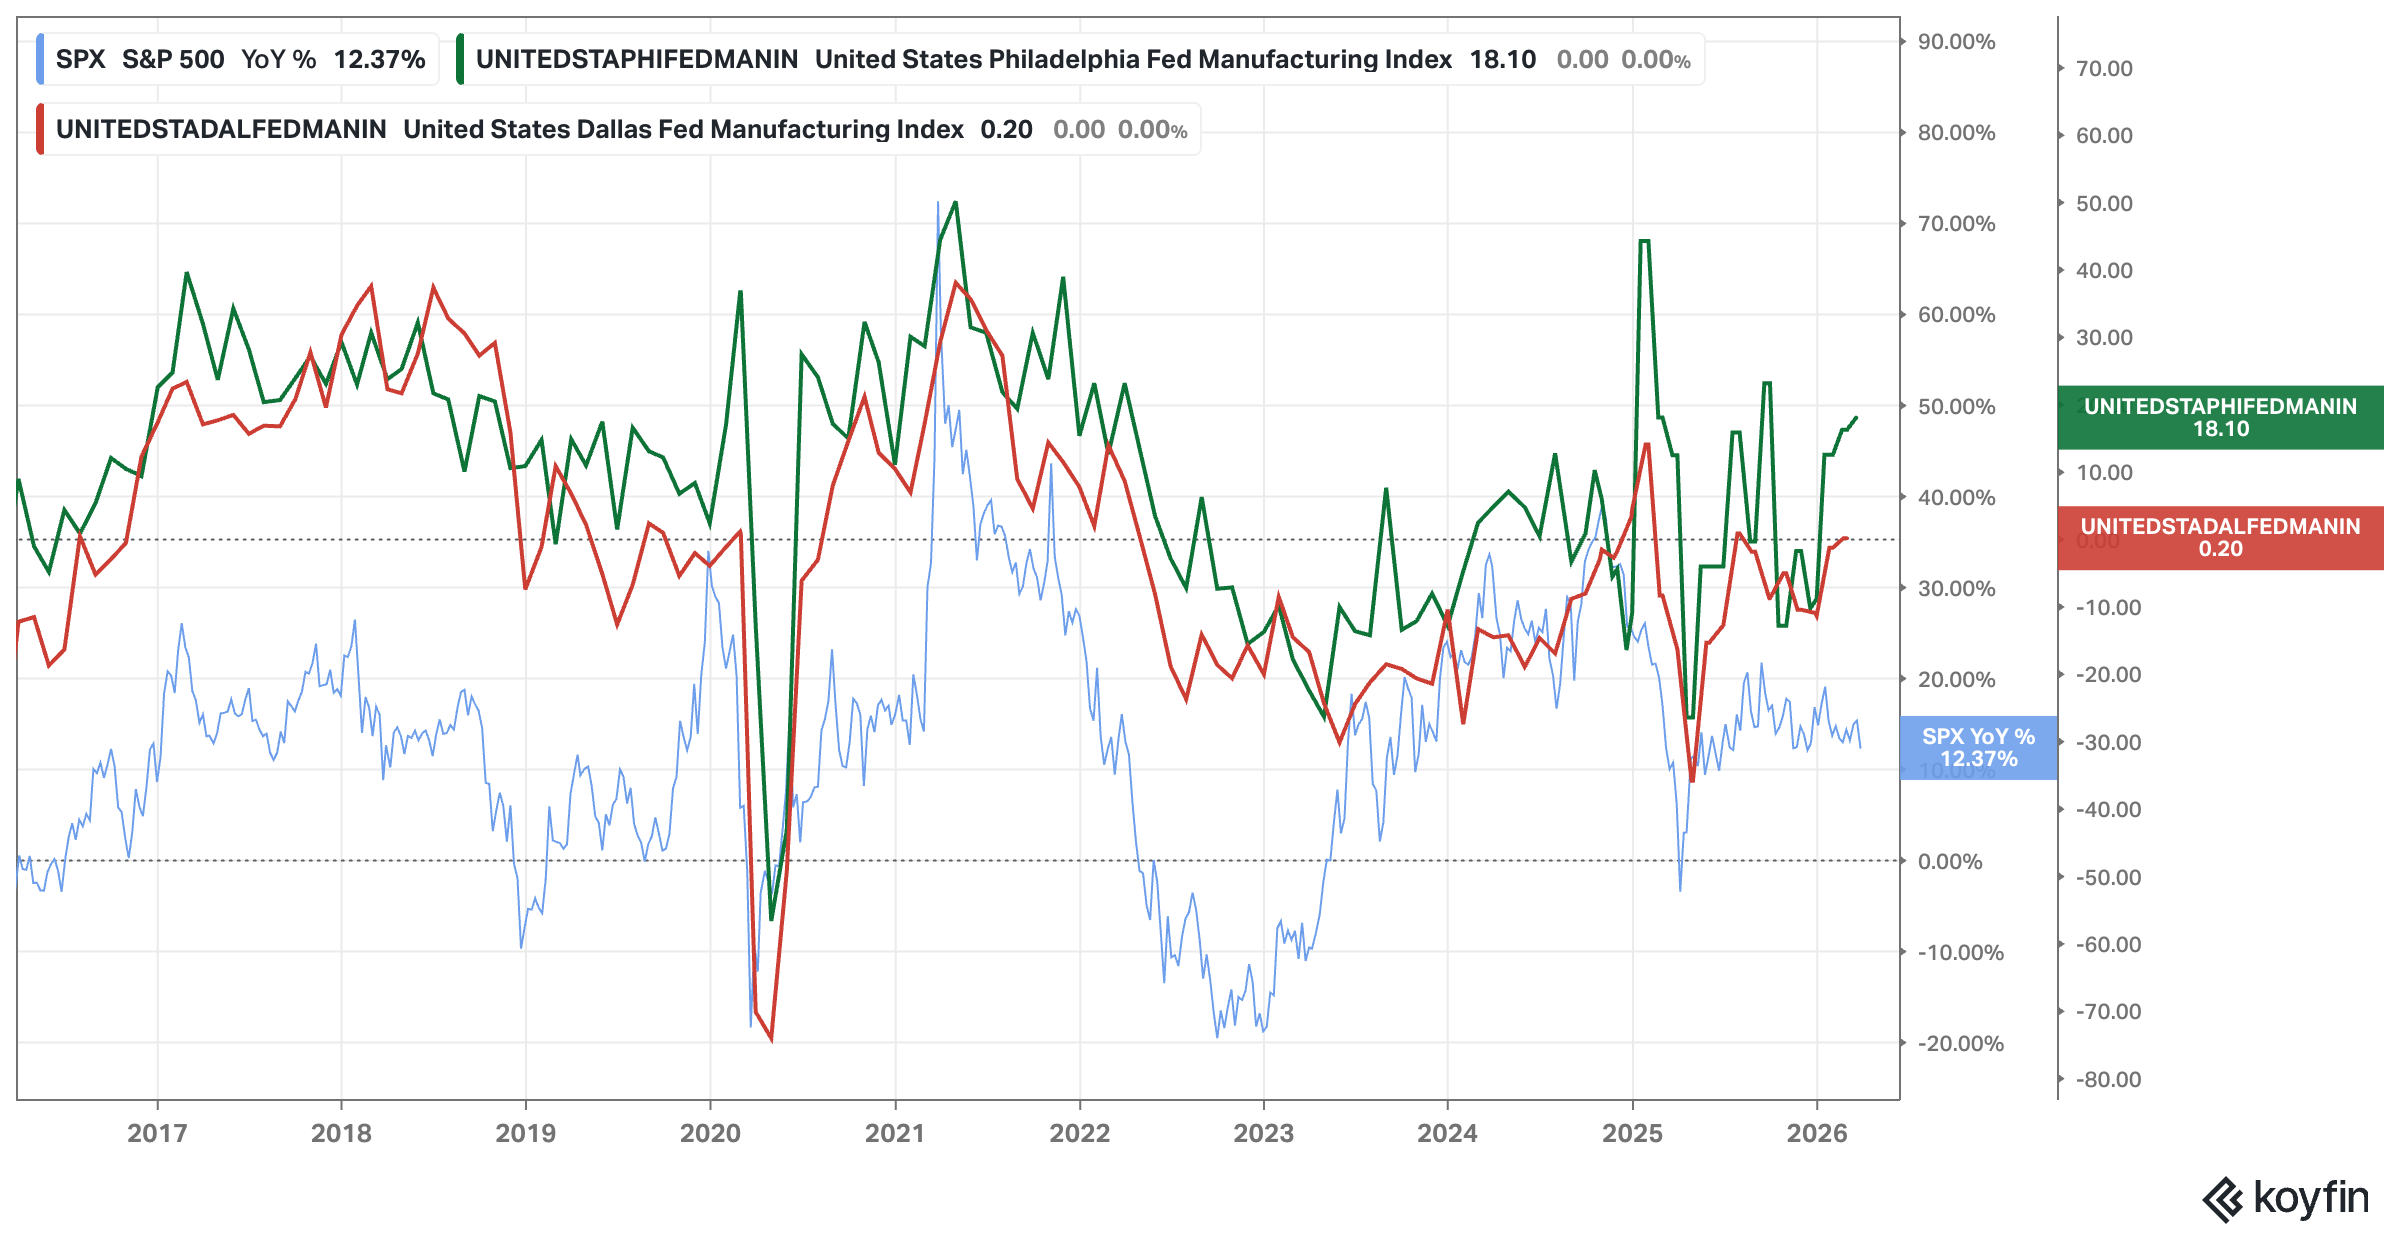
Analysis: Philadelphia Manufacturing Index improved.
Outlook: Bullish
Why is it happening? – Level 1
Economic Data: Consumption: Consumer Sentiment
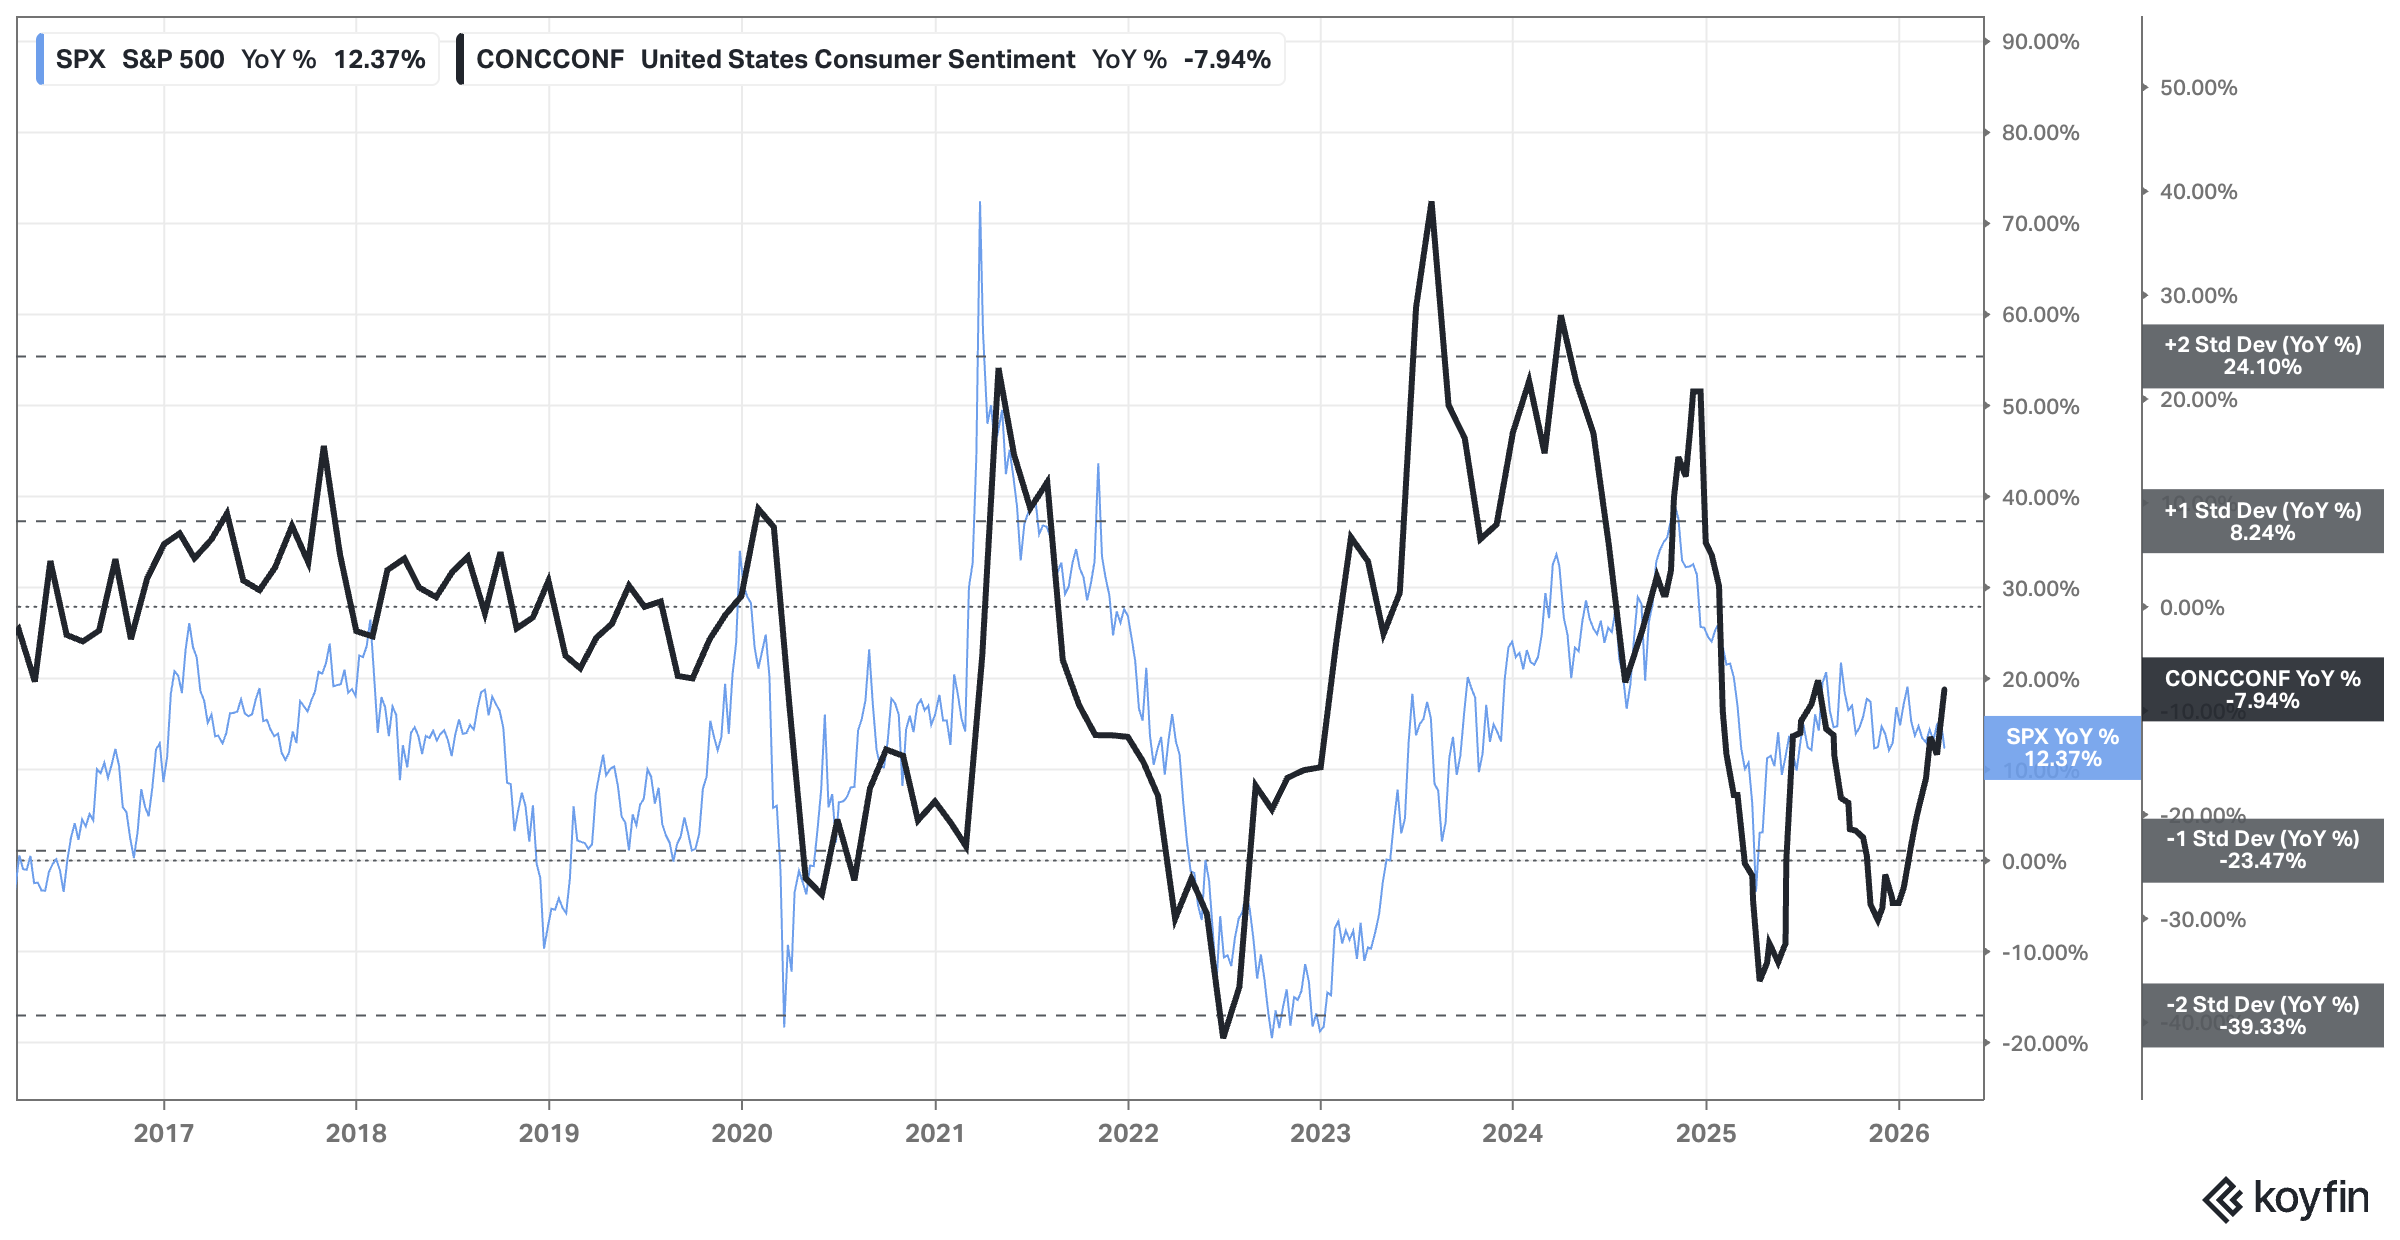
Analysis: New reading with an improvement in confidence.
Outlook: Bullish
Why is it happening? – Level 1
USD & Interest Rates: FED, 2yr, and 10yr Rates
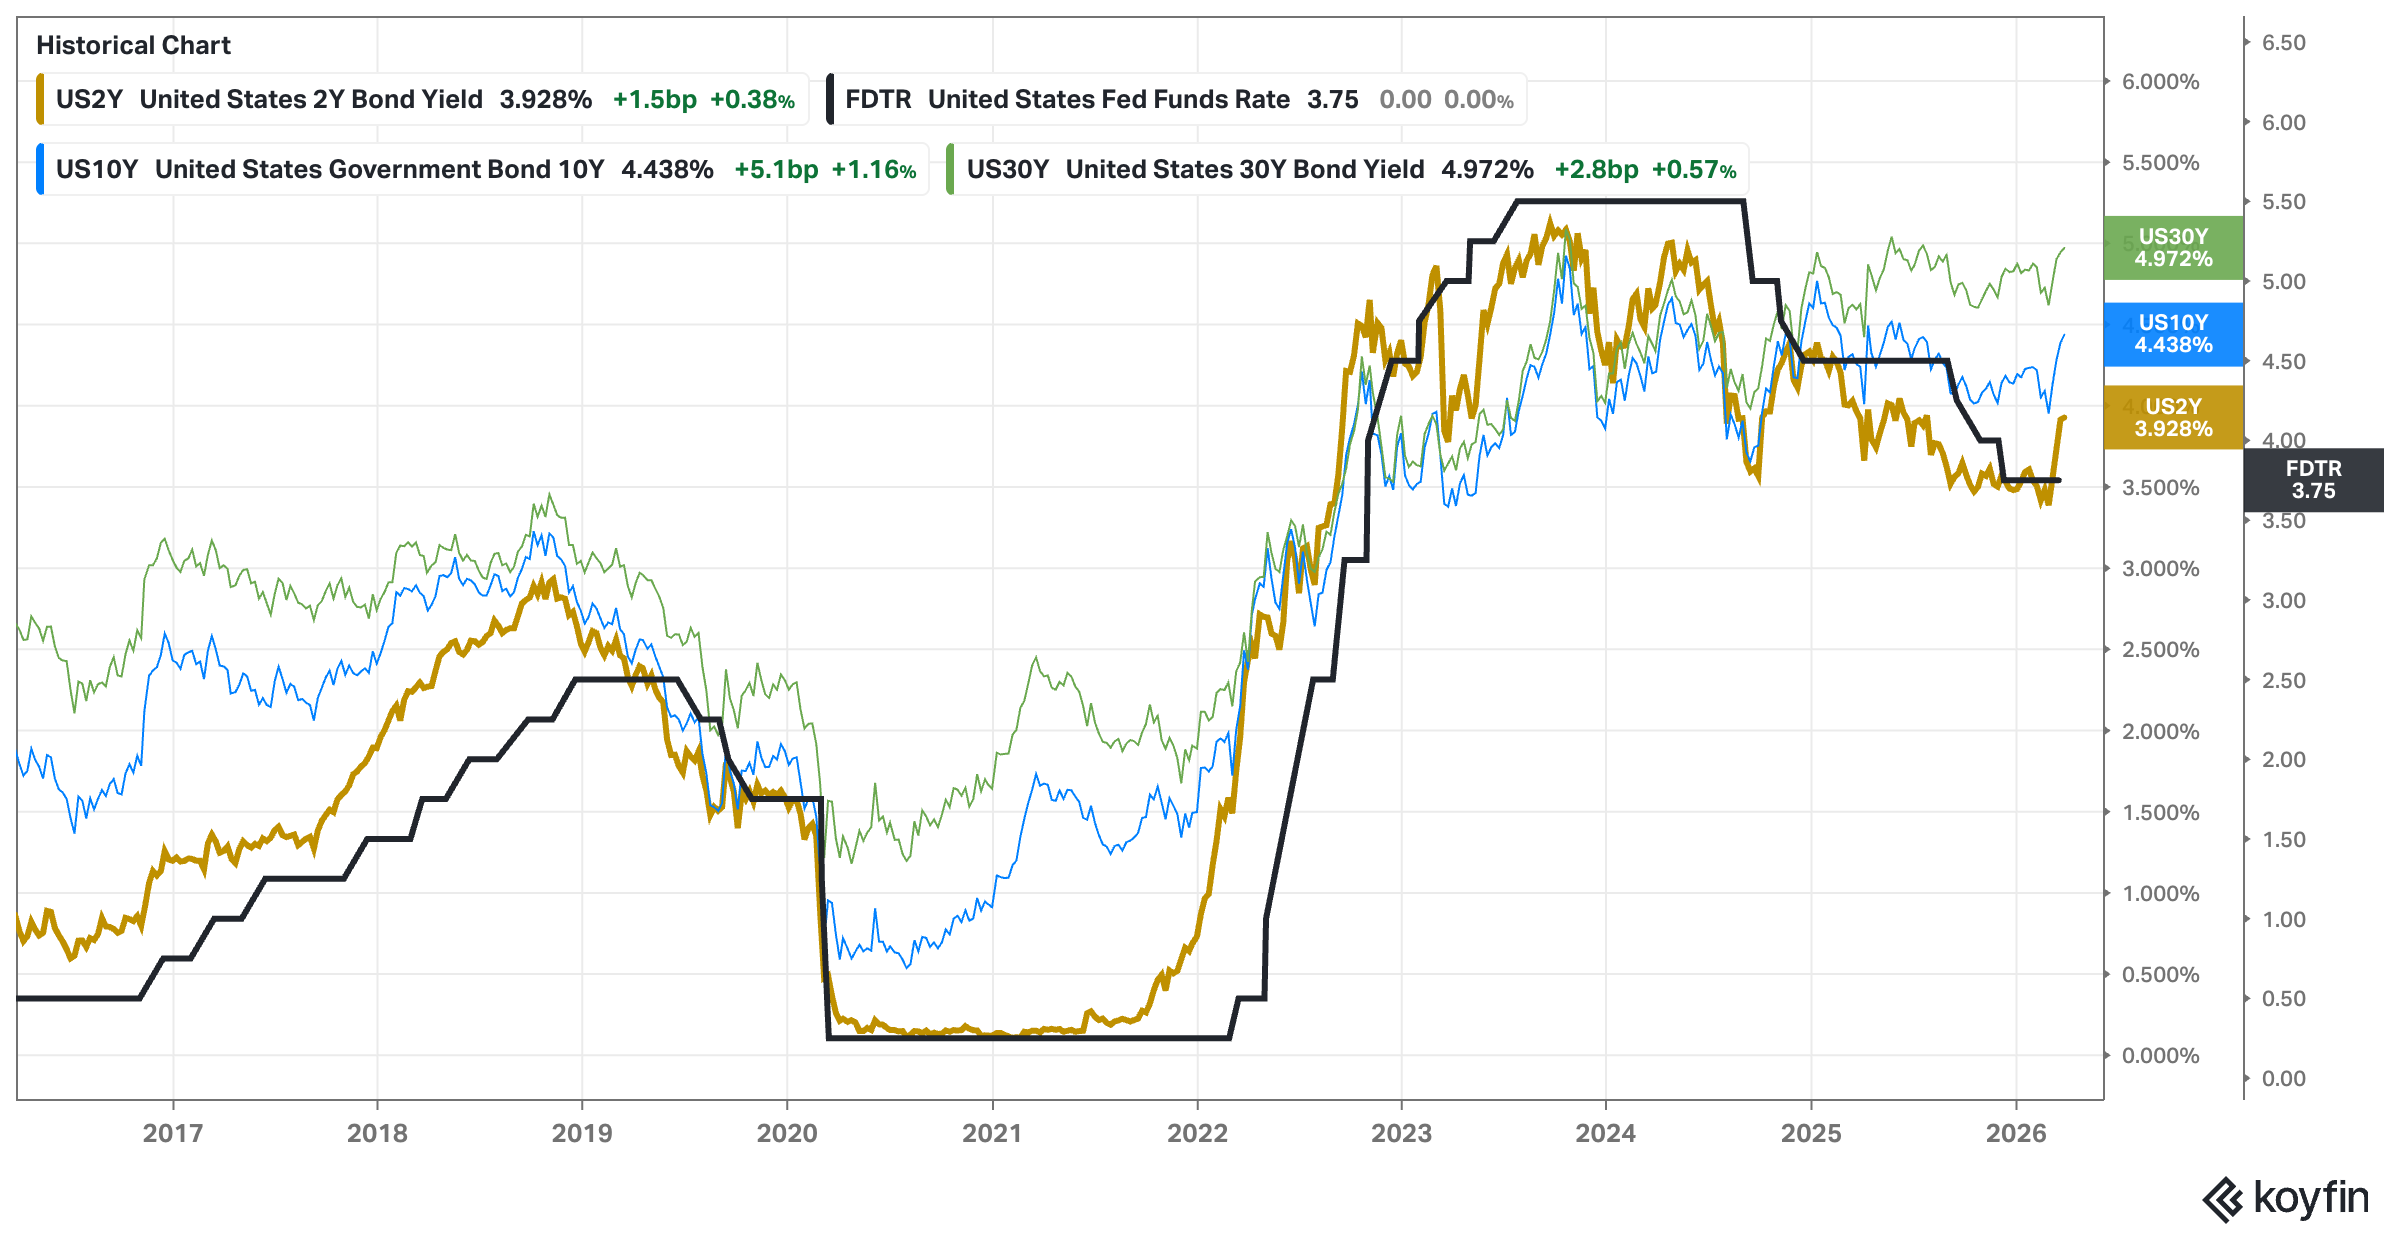
Analysis: Near-term interests continued increasing. This could force the Fed to pause rates cuts.
Outlook: Neutral to Bearish.
Why is it happening? – Level 1
USD & Interest Rates: USD vs EEM and S&P500
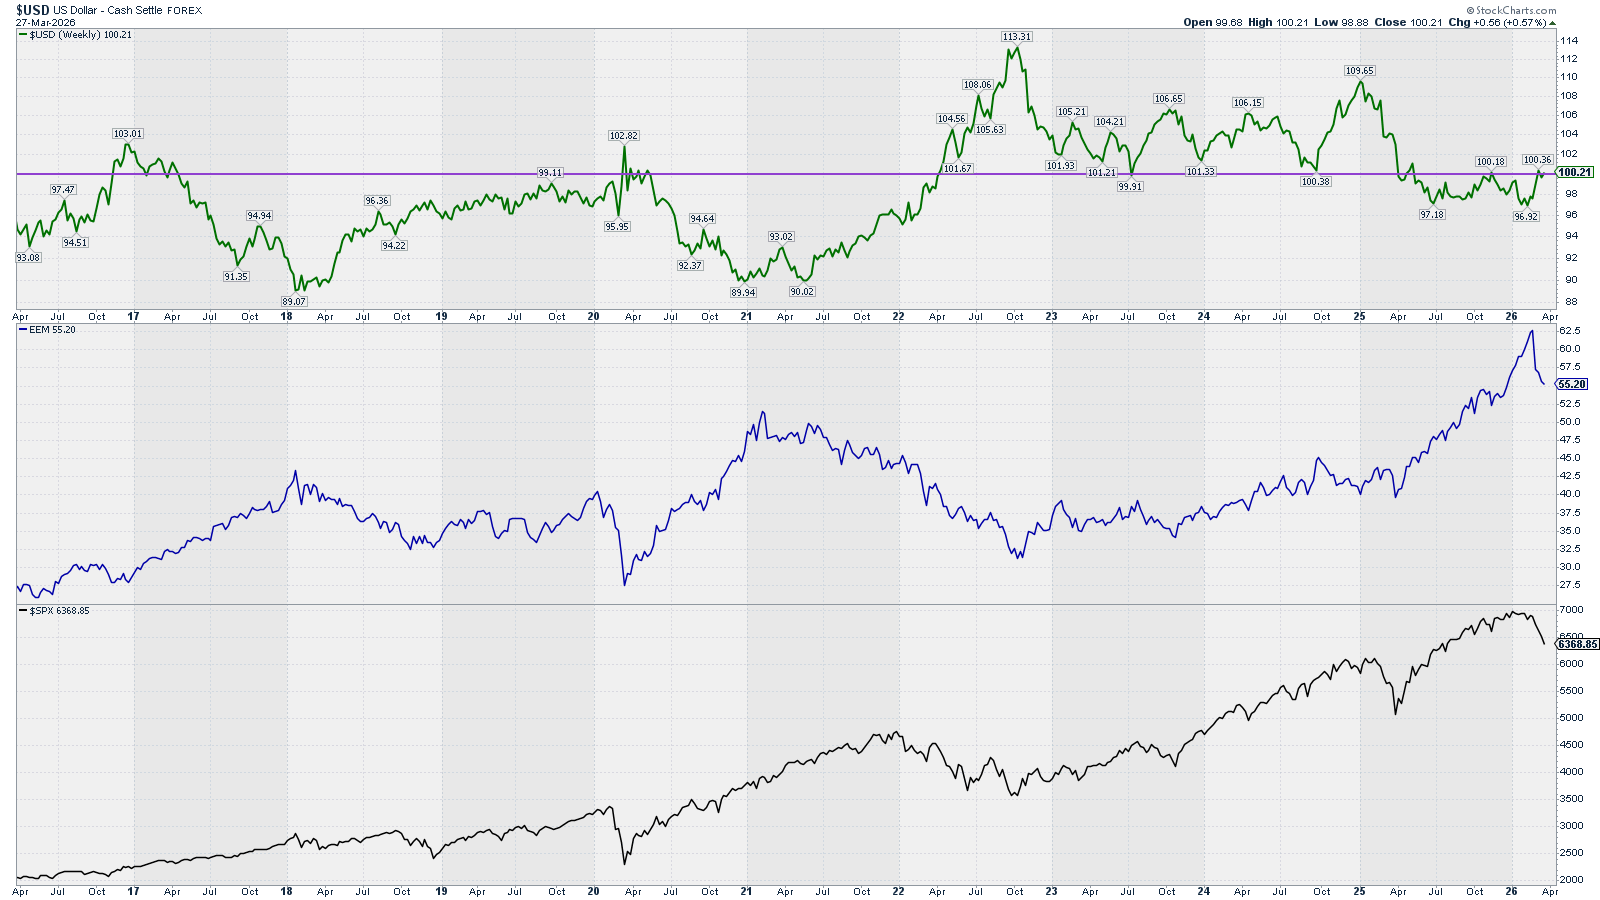
Analysis: Oil price and supply disruption and destruction is already having a real impact on EEM economies and markets. USD is struggling to break above 100 level resistance but geopolitical events are tailwinds to the USD. Only a sharp turn-around in Iran’s war could reconduct the USD and EEM to the previous trends.
Outlook: Bearish (the longer the war the higher the oil & gas disruption)
Why is it happening? – Level 1
Context Investors Sentiment: Credit Spreads
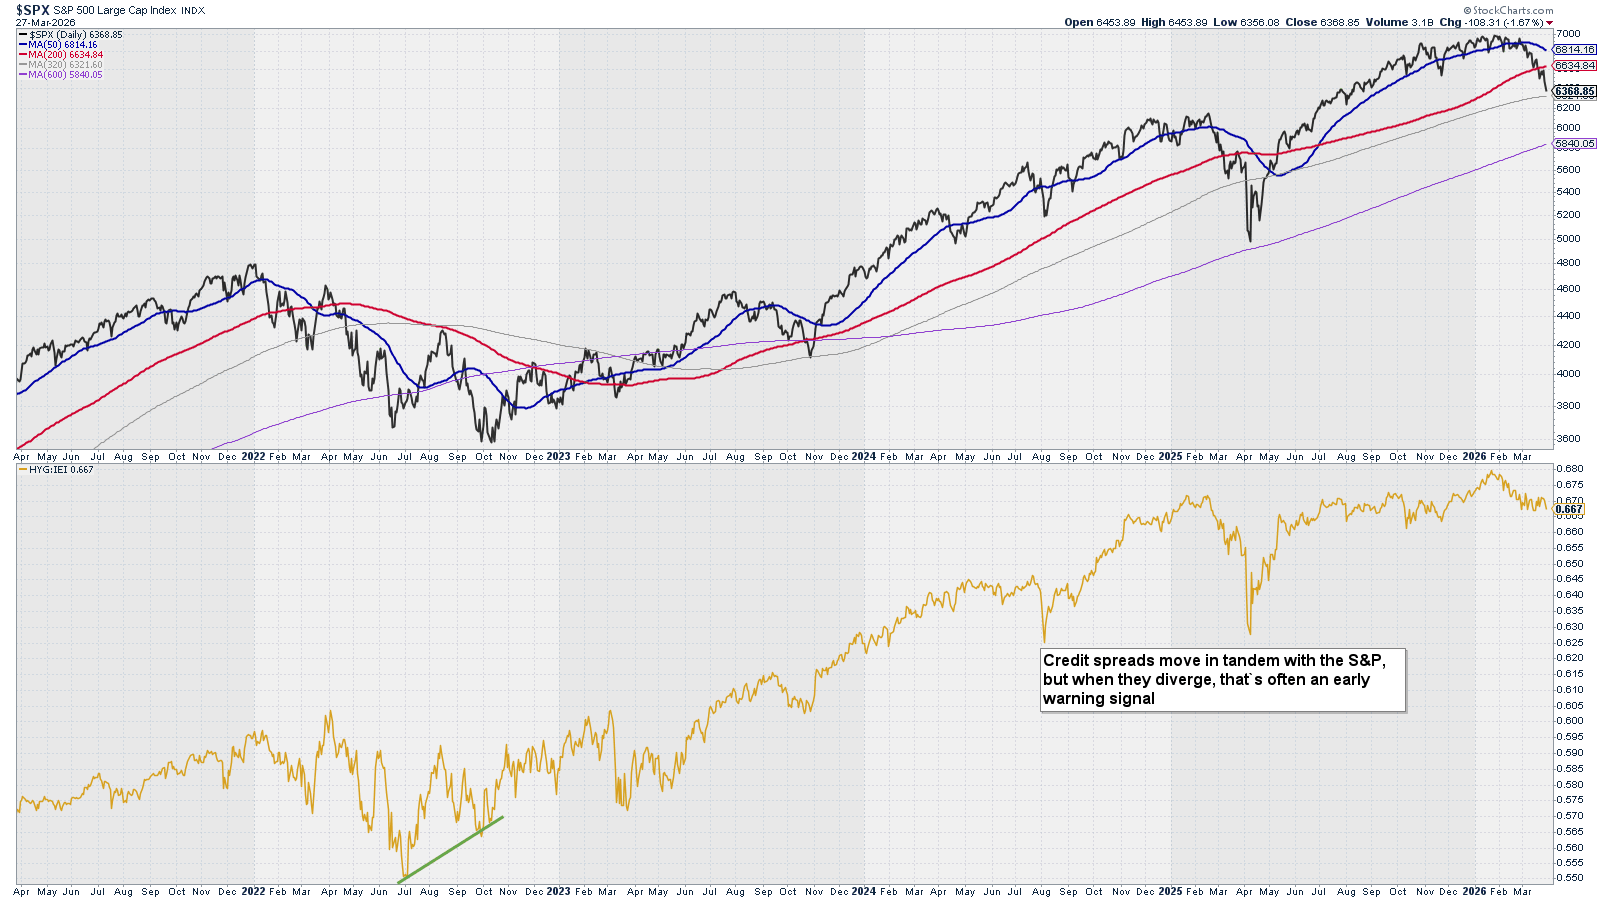
Credit spreads move in tandem with the S&P, but when they diverge, that’s often an early warning signal.
Analysis: There is a bit of divergence between S&P and credit spreads, with spreads more sideways than S&P. This could be a good signal for stocks, yet it is too early now.
Outlook: Bearish
Level 1 Summary
Economic Data (long-term): Bullish to Neutral
USD & Interest Rates: Bearish
Investors Sentiment: Bearish
What is happening? – Level 2
Price Action: SPX – Trend – 20 years
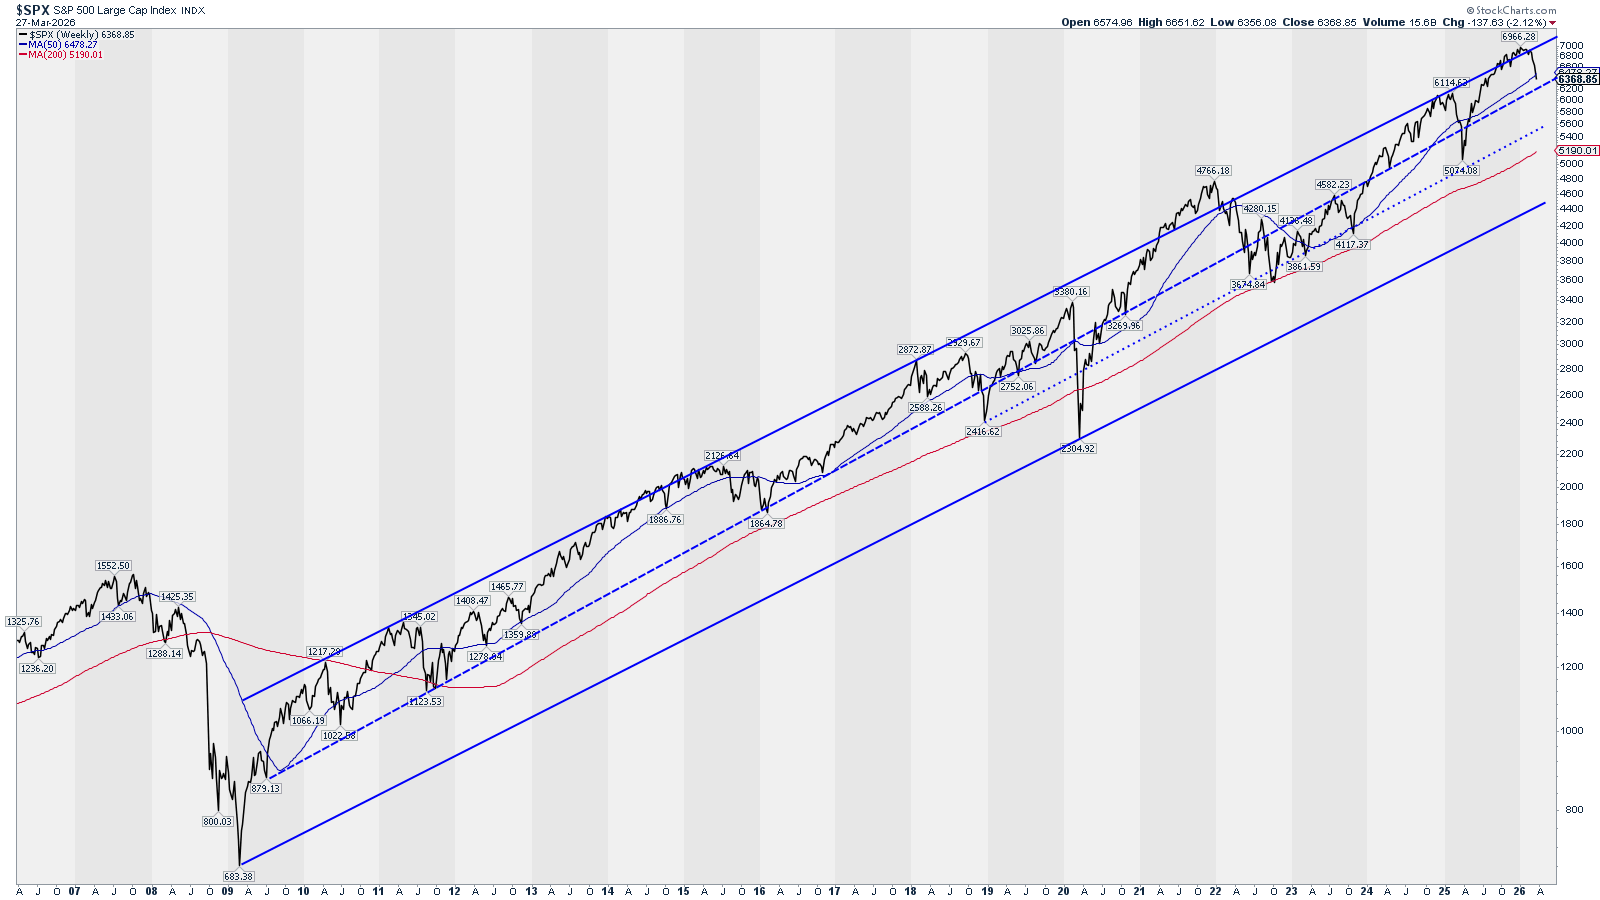
Analysis: Price, finally, fell below the upper channel of the last 20 years trend. There is still margin for the market to fall until any significant resistance is reached - for example the middle of the channel.
Outlook: Bearish
What is happening? – Level 2
Price Action: RSP – Trend – Weekly
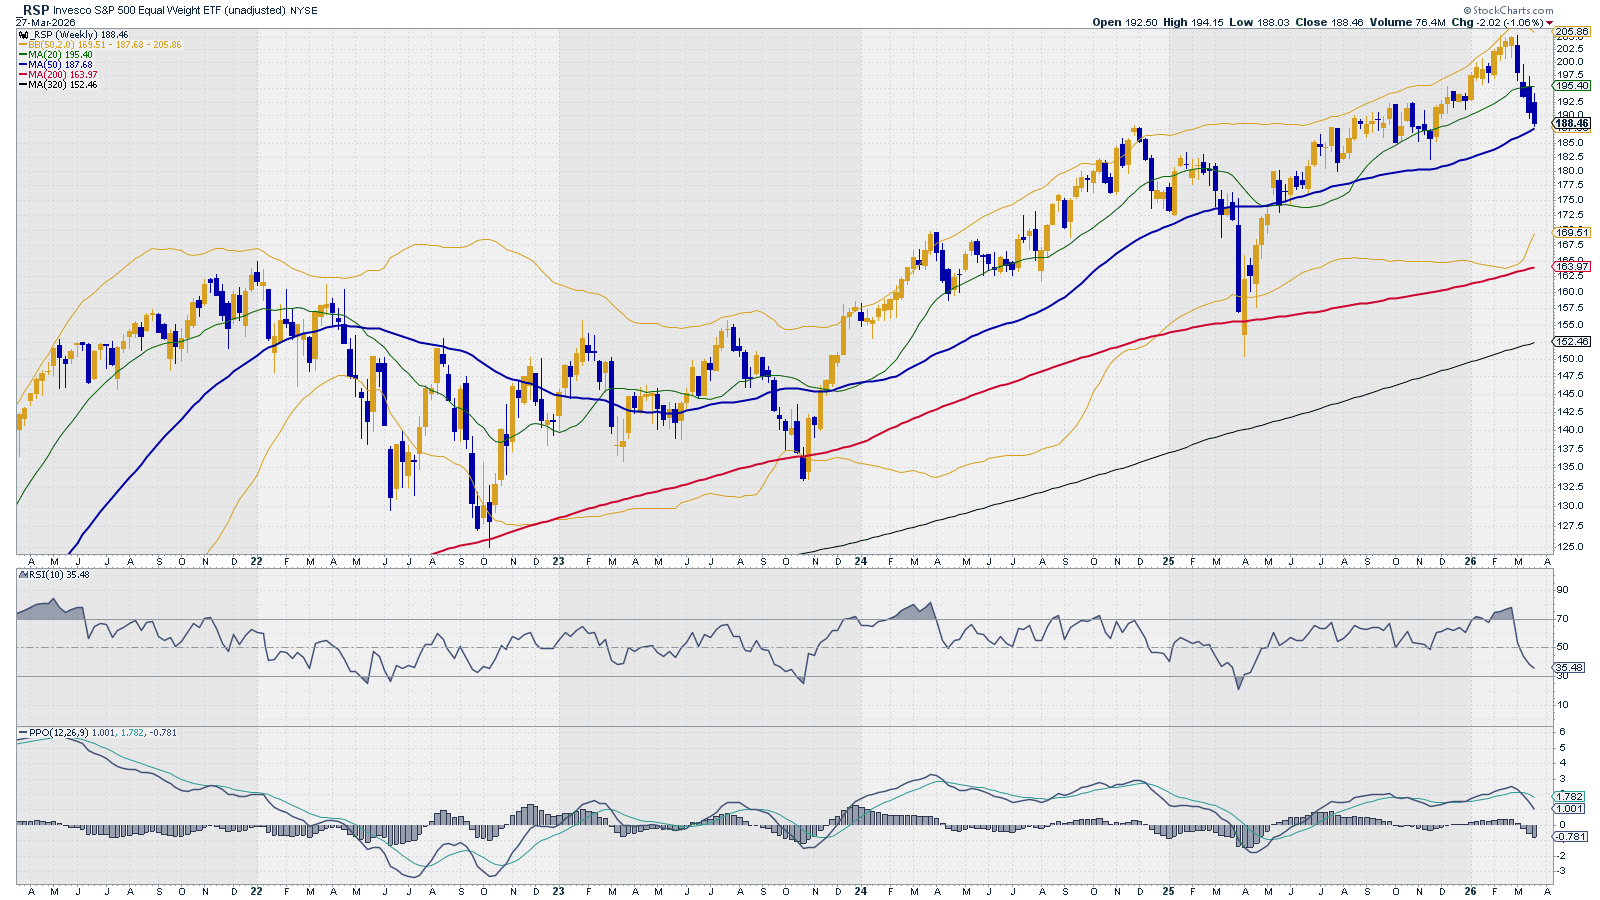
Analysis: Price reaching the 50 Week SMA (approx. 200 daily SMA). A break below this level could imply a larger bearish trend down to the 200 weekly SMA (red).
Outlook: Bearish
What is happening? – Level 2
Price Action: RSP – Trend – Daily
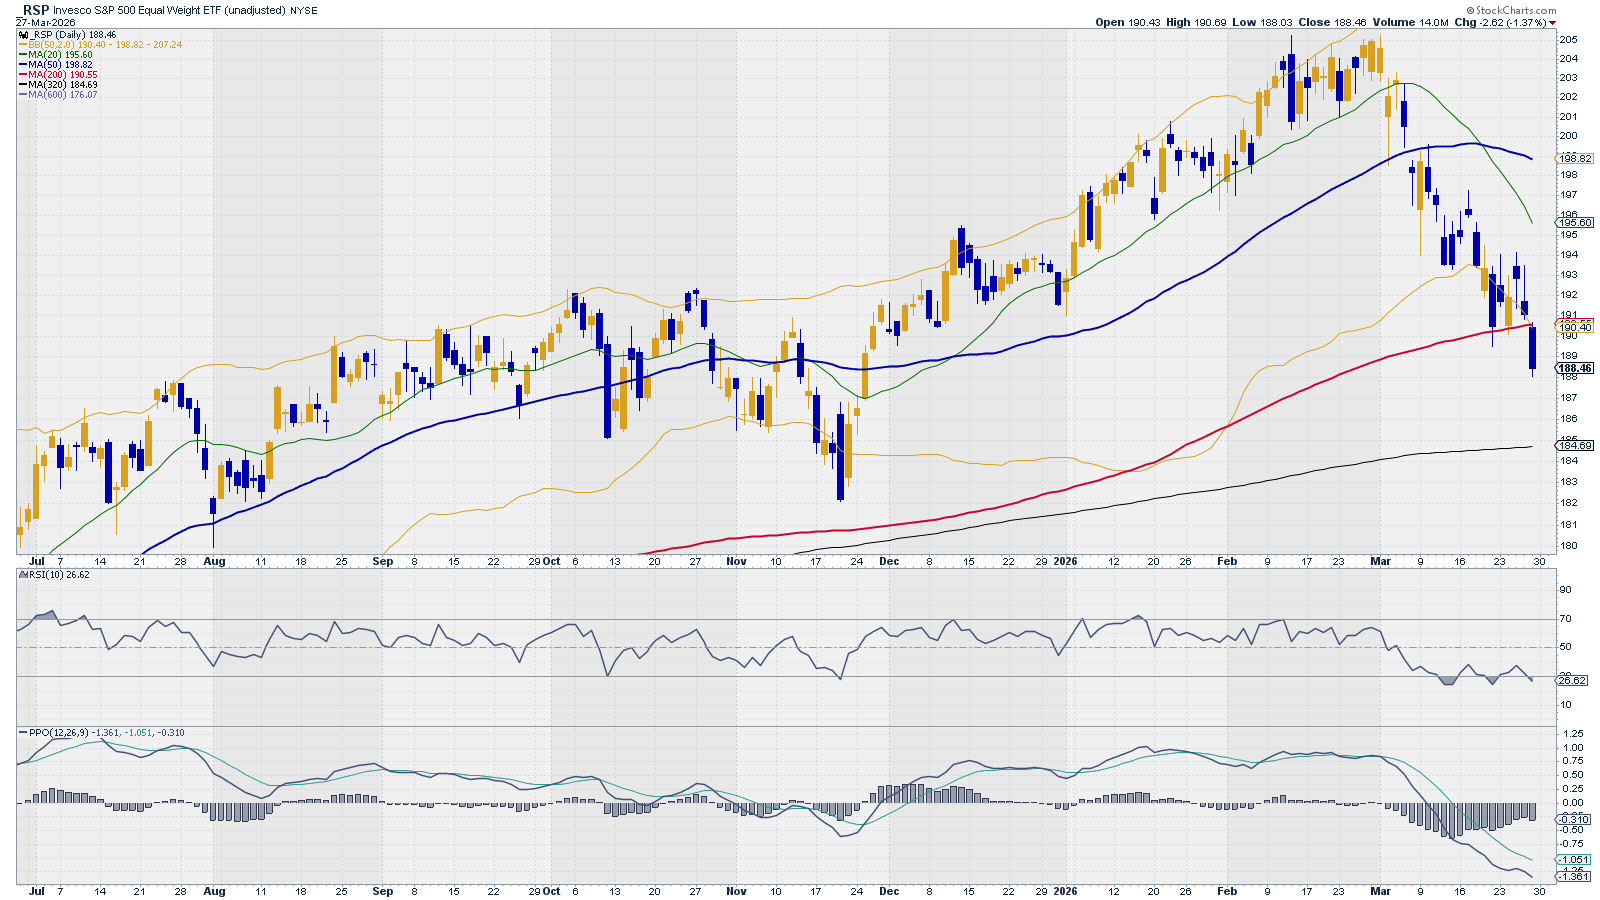
Analysis: RSP held above its 200 daily SMA until Friday. This is a clean and significant break below one of the most important S/R MA. The next support is at 320 days SMA.
Outlook: Bearish
What is happening? – Level 2
Breadth & Volatility: % Stocks above 200 SMA vs. RSP
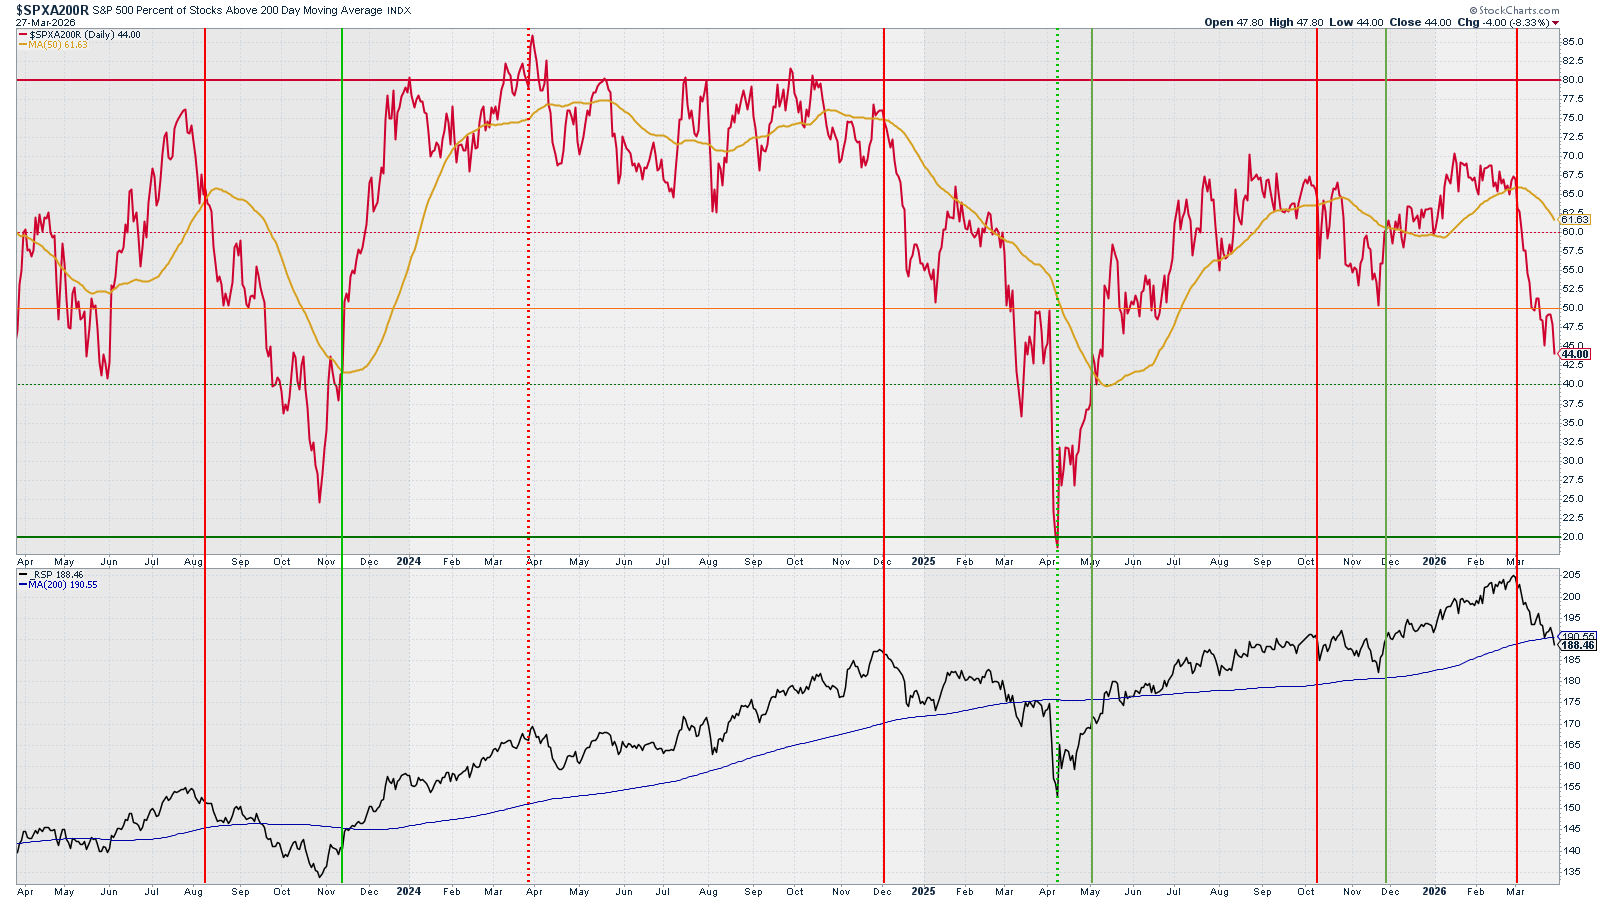
Analysis: We continue going lower, with a close on Friday at the 44% mark.
Outlook: Bearish
What is happening? – Level 2
Breadth & Volatility: RSP and % Stocks above 200, 50, and 20 SMA
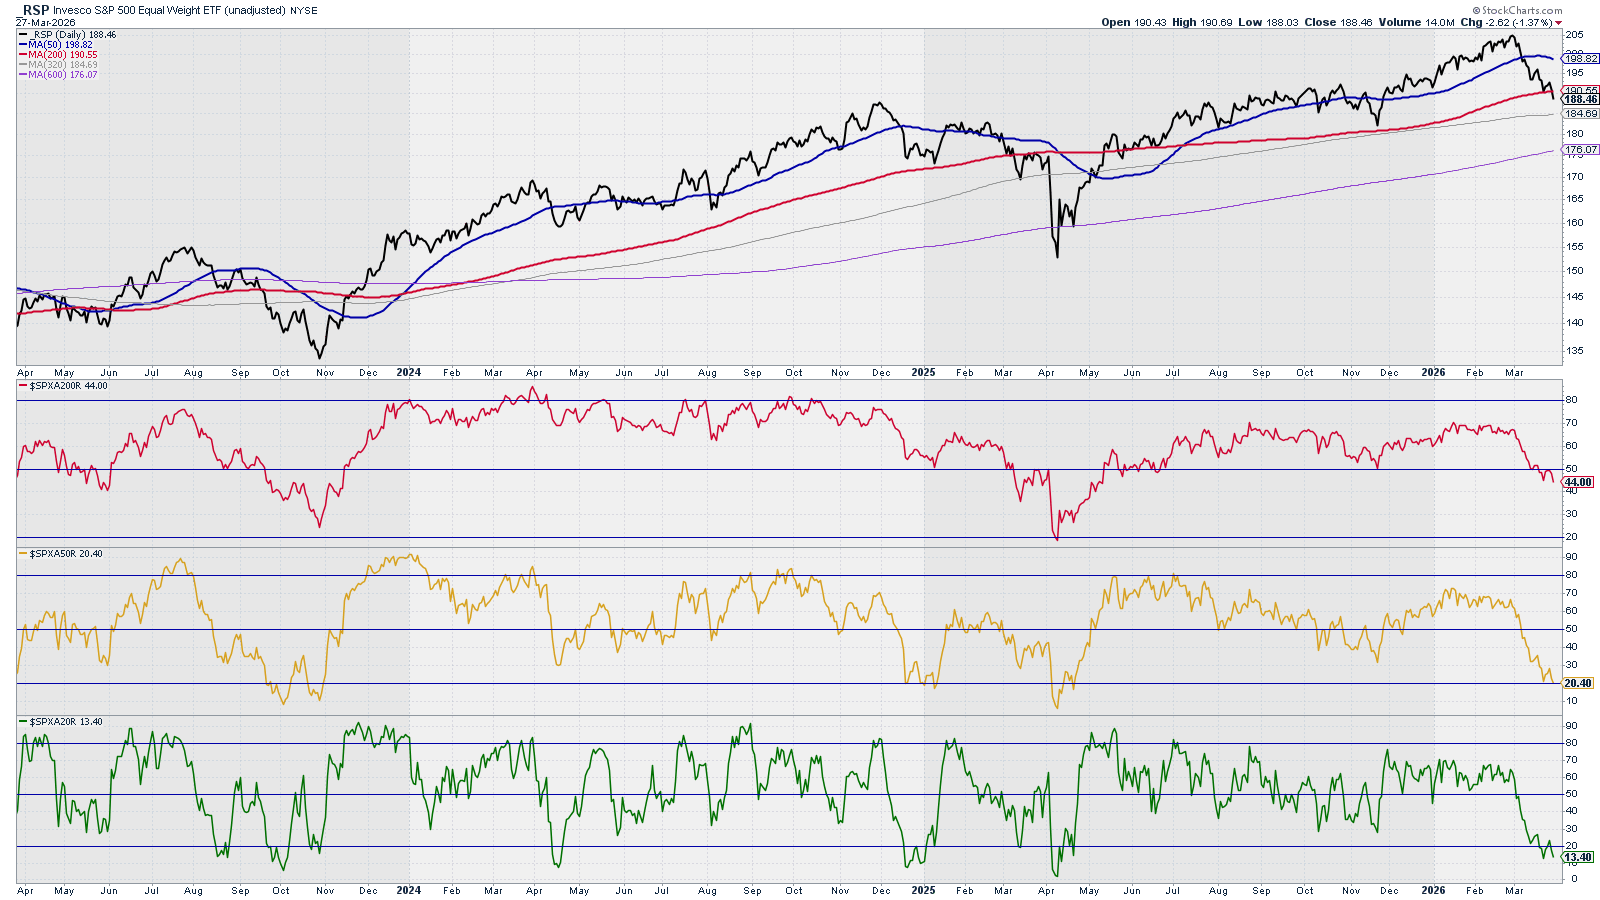
Analysis: SMA 20 in oversold territory. We shall expect a series of relief rallies to occur when there are so few stocks above their SMA 20 - currently less than 13% .
Outlook: Bearish
What is happening? – Level 2
Breadth & Volatility: Bullish Pct. Index & McClellan Summation Index
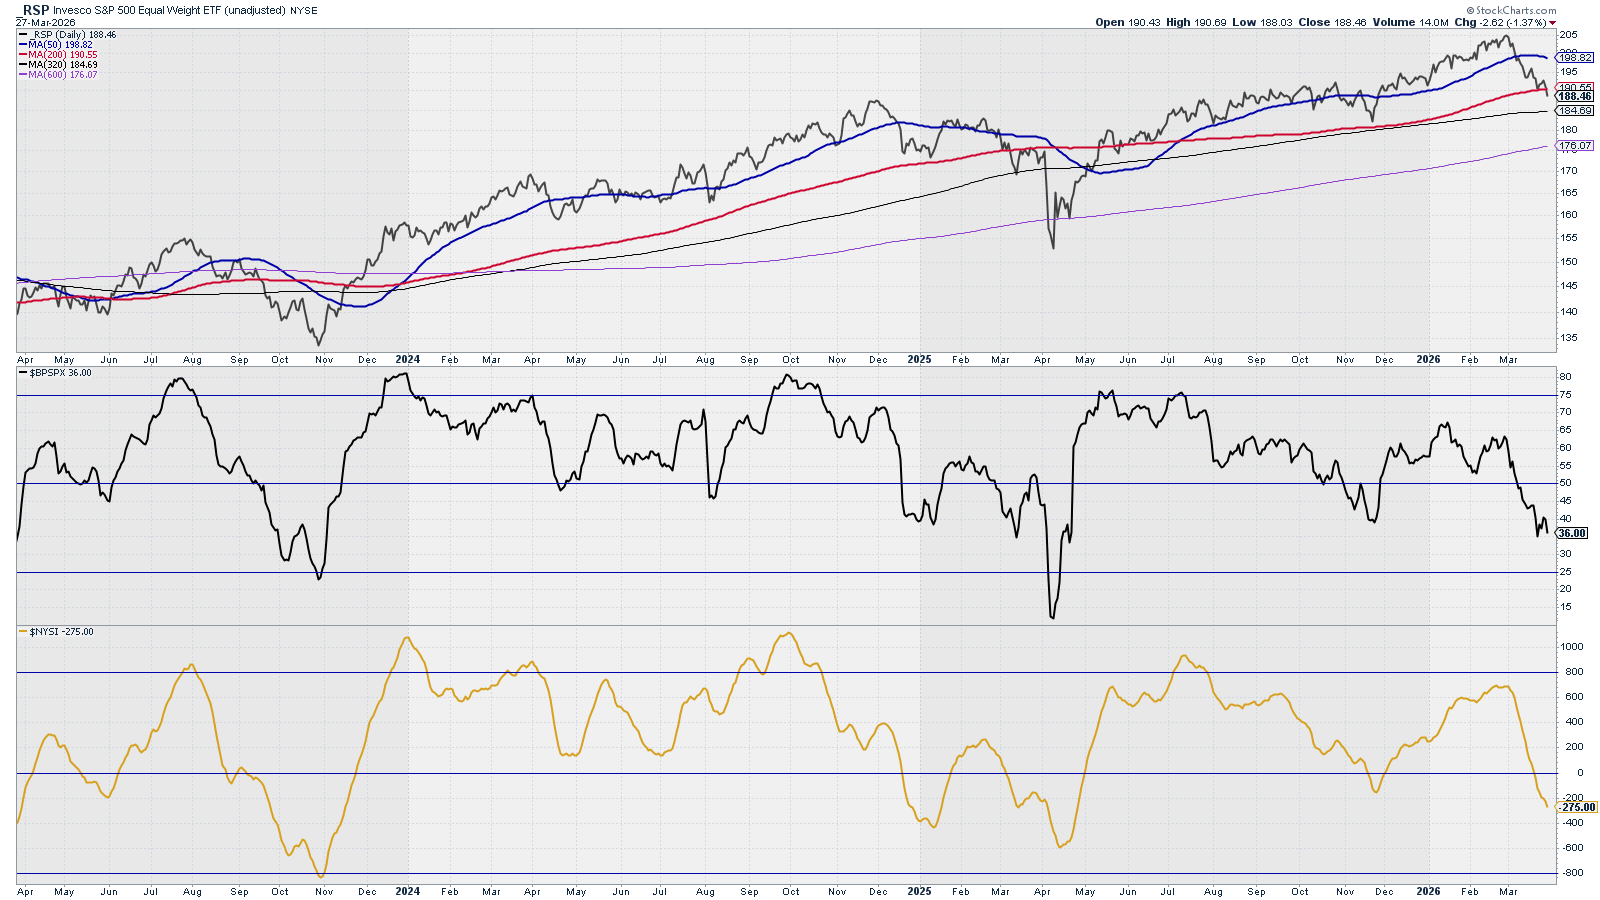
Analysis: Both signals in clear bear territory with no signals of stopping the downward trend.
Outlook: Bearish
What is happening? – Level 2
Breadth & Volatility: Ratio Low Volatility Stocks / SPY vs. SPY & RSP
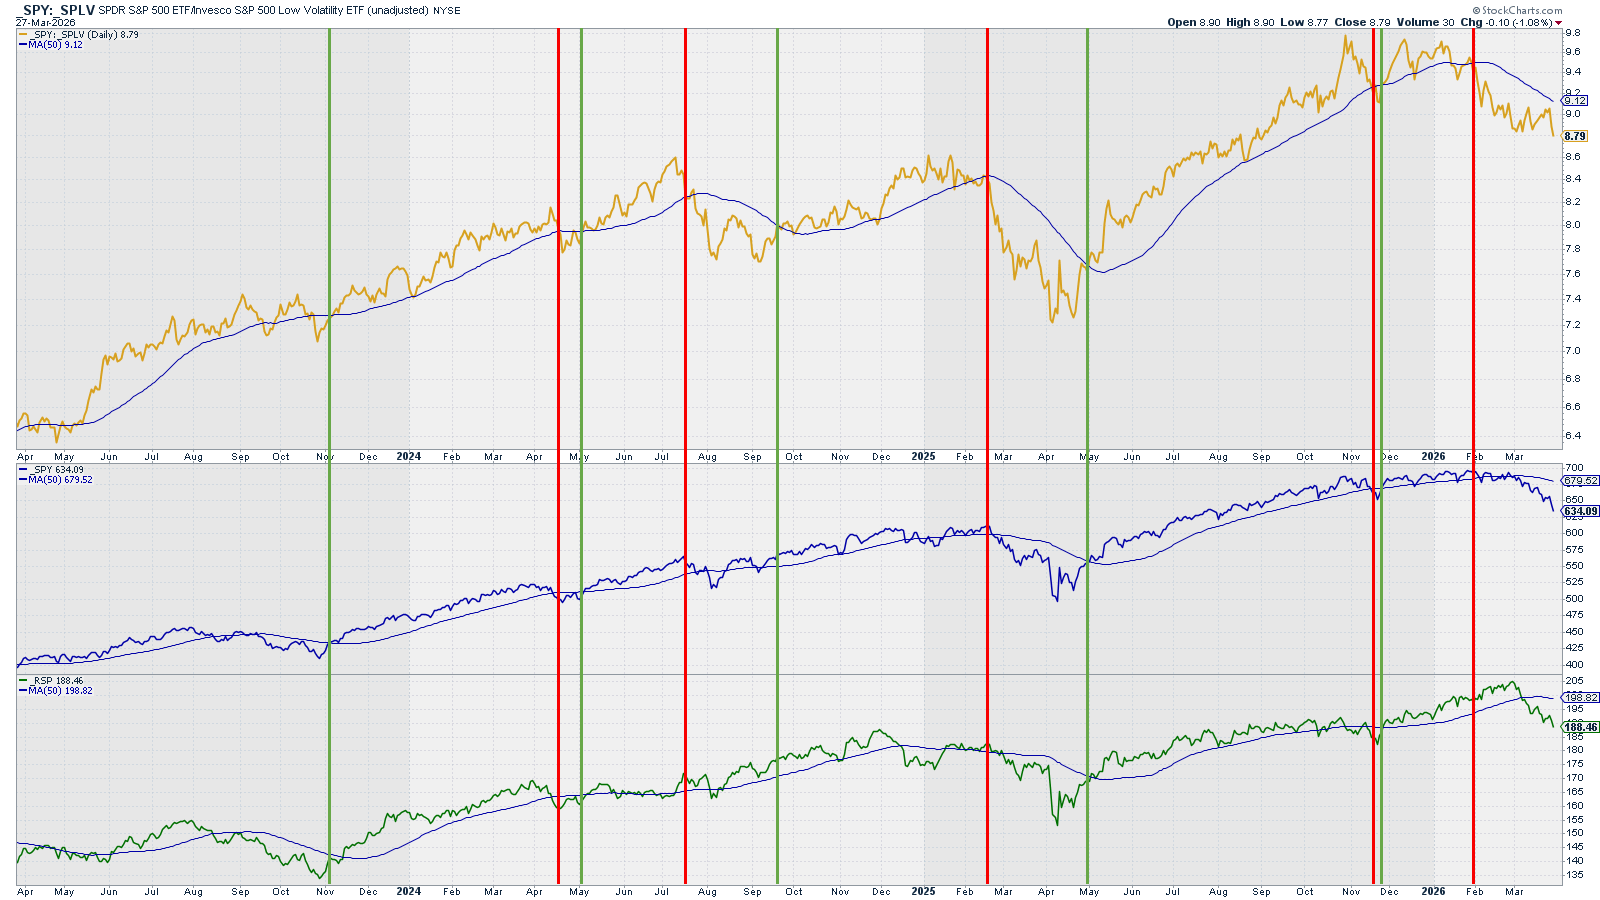
Analysis: Friday action took the ratio down.
Outlook: Bearish
What is happening? – Level 2
Breadth & Volatility: New Highs vs. SPY & RSP
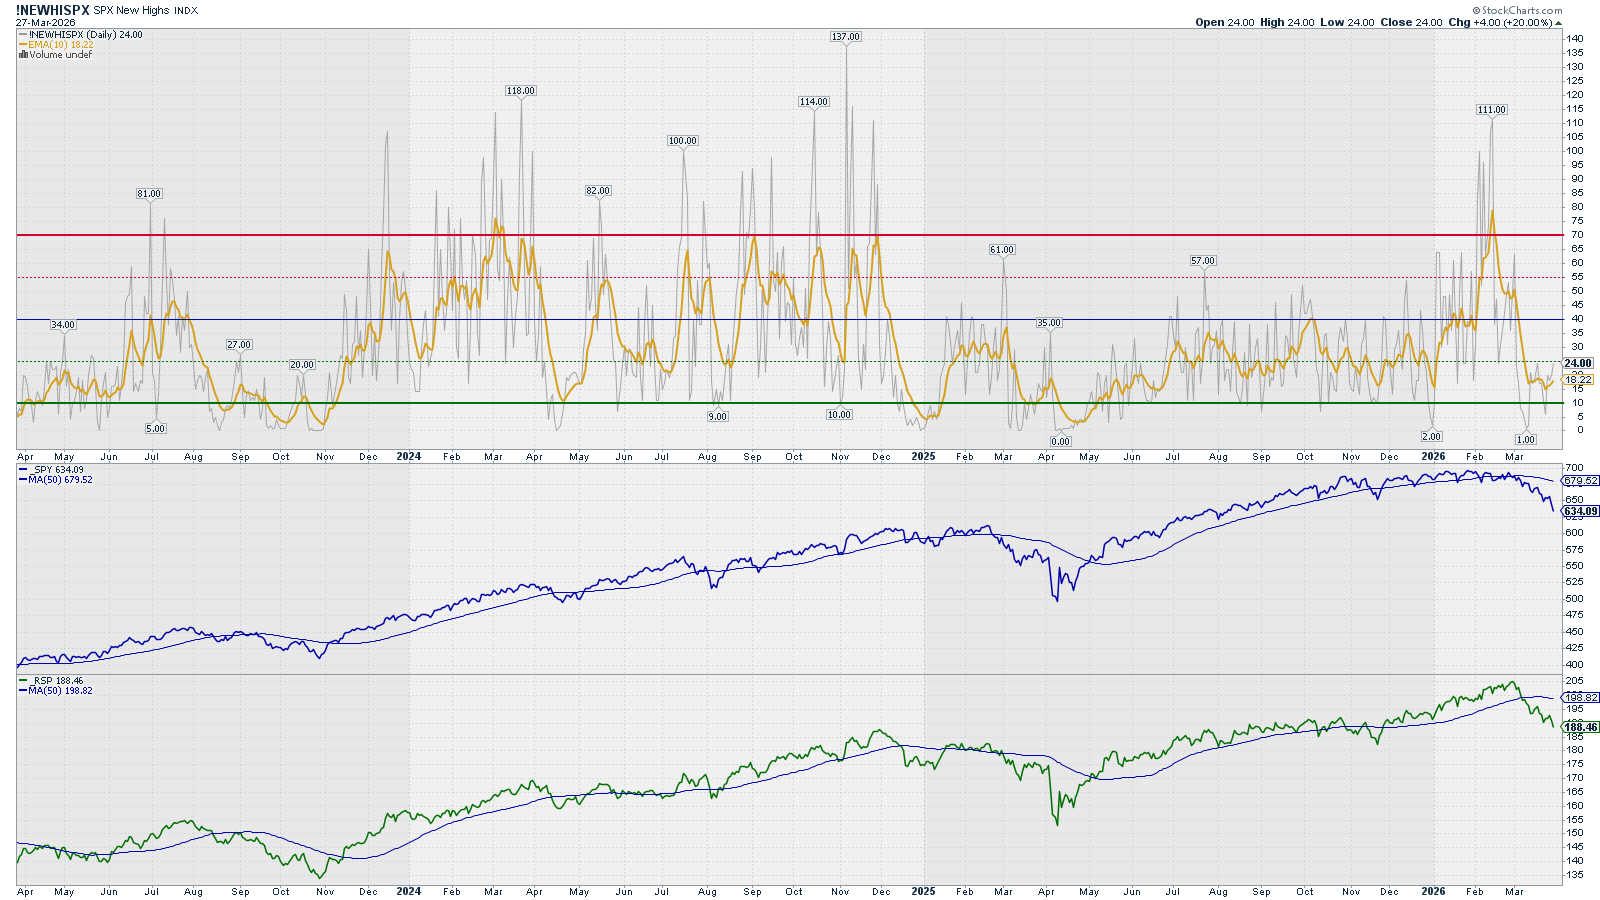
Analysis: New Highs have improved from last week (11 vs. 24). We keep the Bearish outlook. The market is still not flashing a bottom pattern with the New Highs SMA repeatedly below level 10.
Outlook: Bearish
What is happening? – Level 2
Breadth & Volatility: VIX vs. SPY & RSP
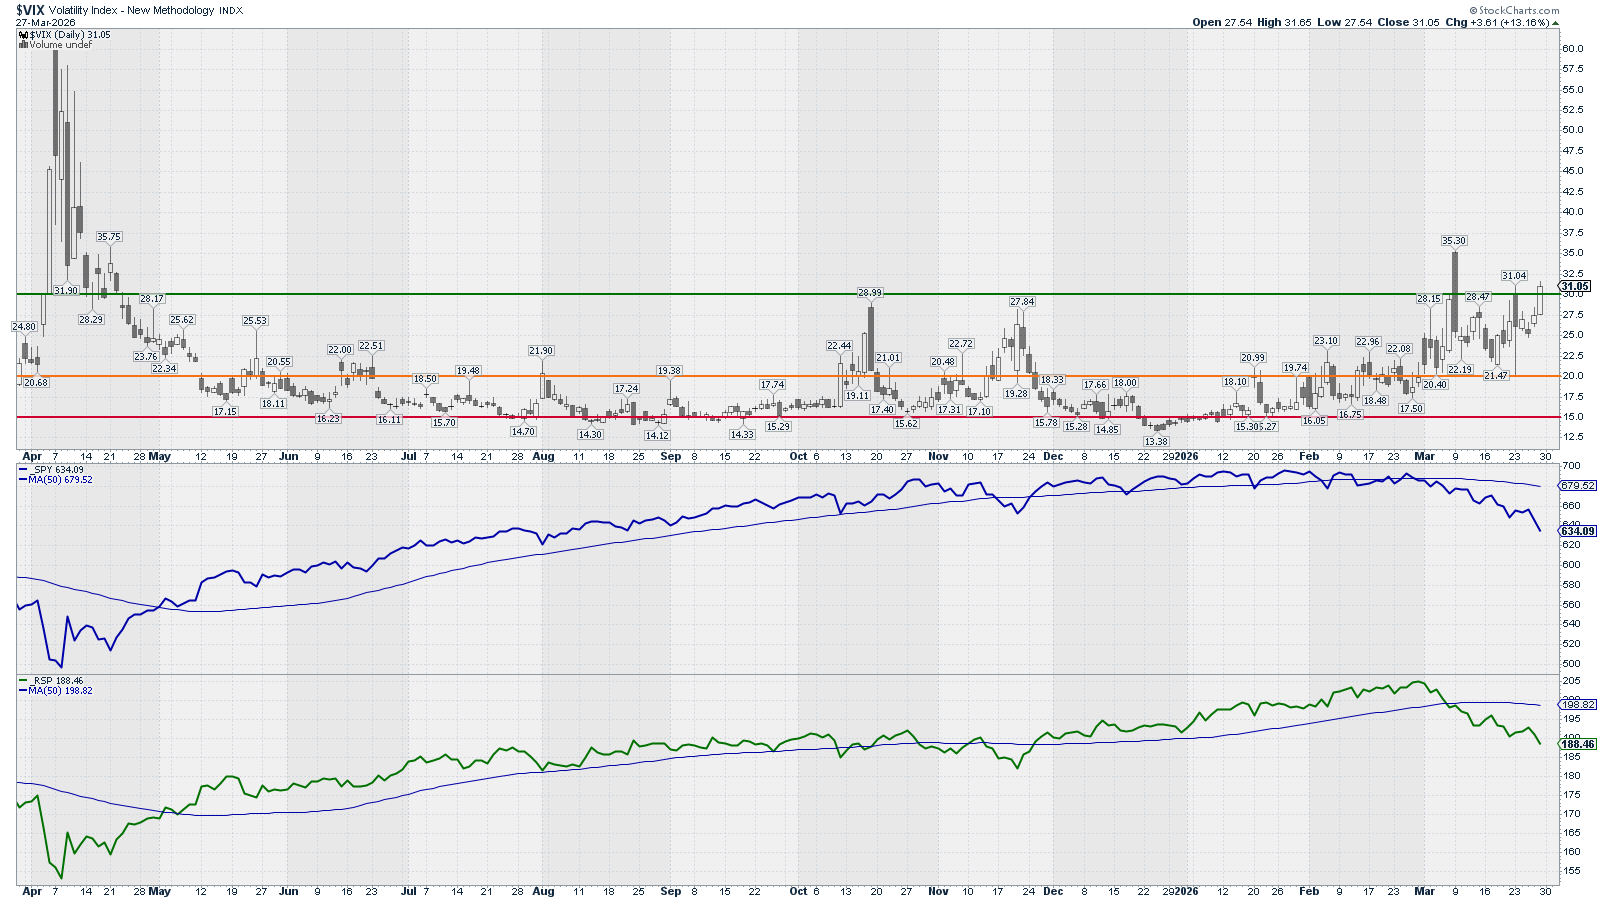
This chart is mainly to detect market bottoms.
Analysis: VIX above level 30. This could mark a local bottom for a relief rally if some sort of “good” news come from the Iran war front. Otherwise, expect more volatility.
Outlook: Expect high volatility.
What is happening? – Level 2
Options: (Inverted) Put/Call Ratio vs. SPY
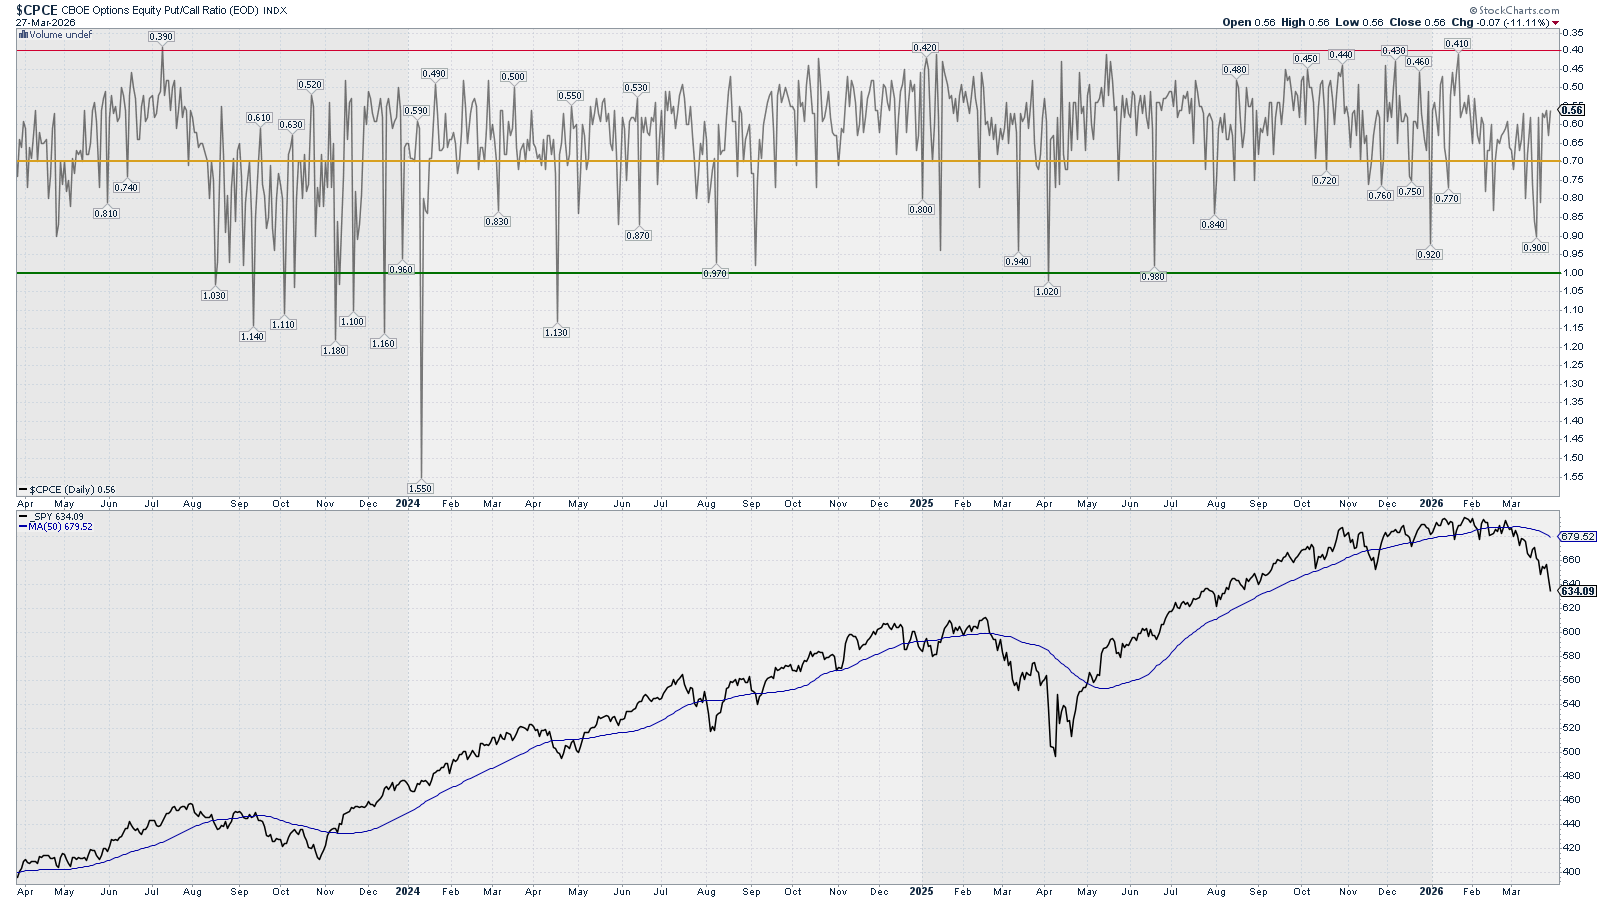
Analysis: The options market does not see neither a top nor a bottom in the markets forming. We shall expect the current situation, a grinding bear trend, to continue.
Outlook: Bearish
What is happening? – Level 2
Options: Gamma Exposure – SPX
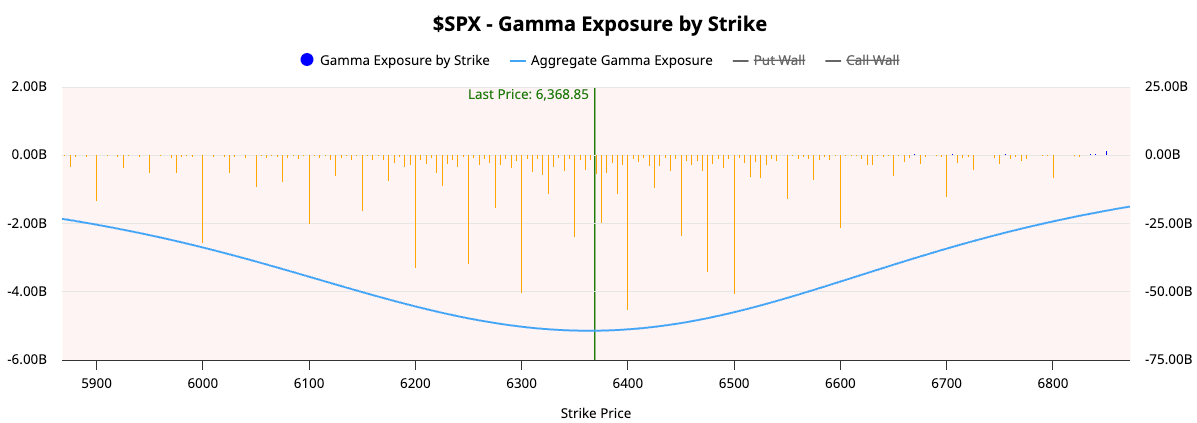
Analysis: In negative GEX. Expect higher volatility with rapid price movements.
Outlook: Neutral (expect choppiness)
Level 2 Summary
Price Action: Bearish
Breadth & Volatility: Bearish
Options: Bearish
What is happening? – Level 3
Bulls vs. Bears: RSP vs. RSPD (Cons. Disc. – Bulls) and RSPS (Cons. Sta. – Bears)
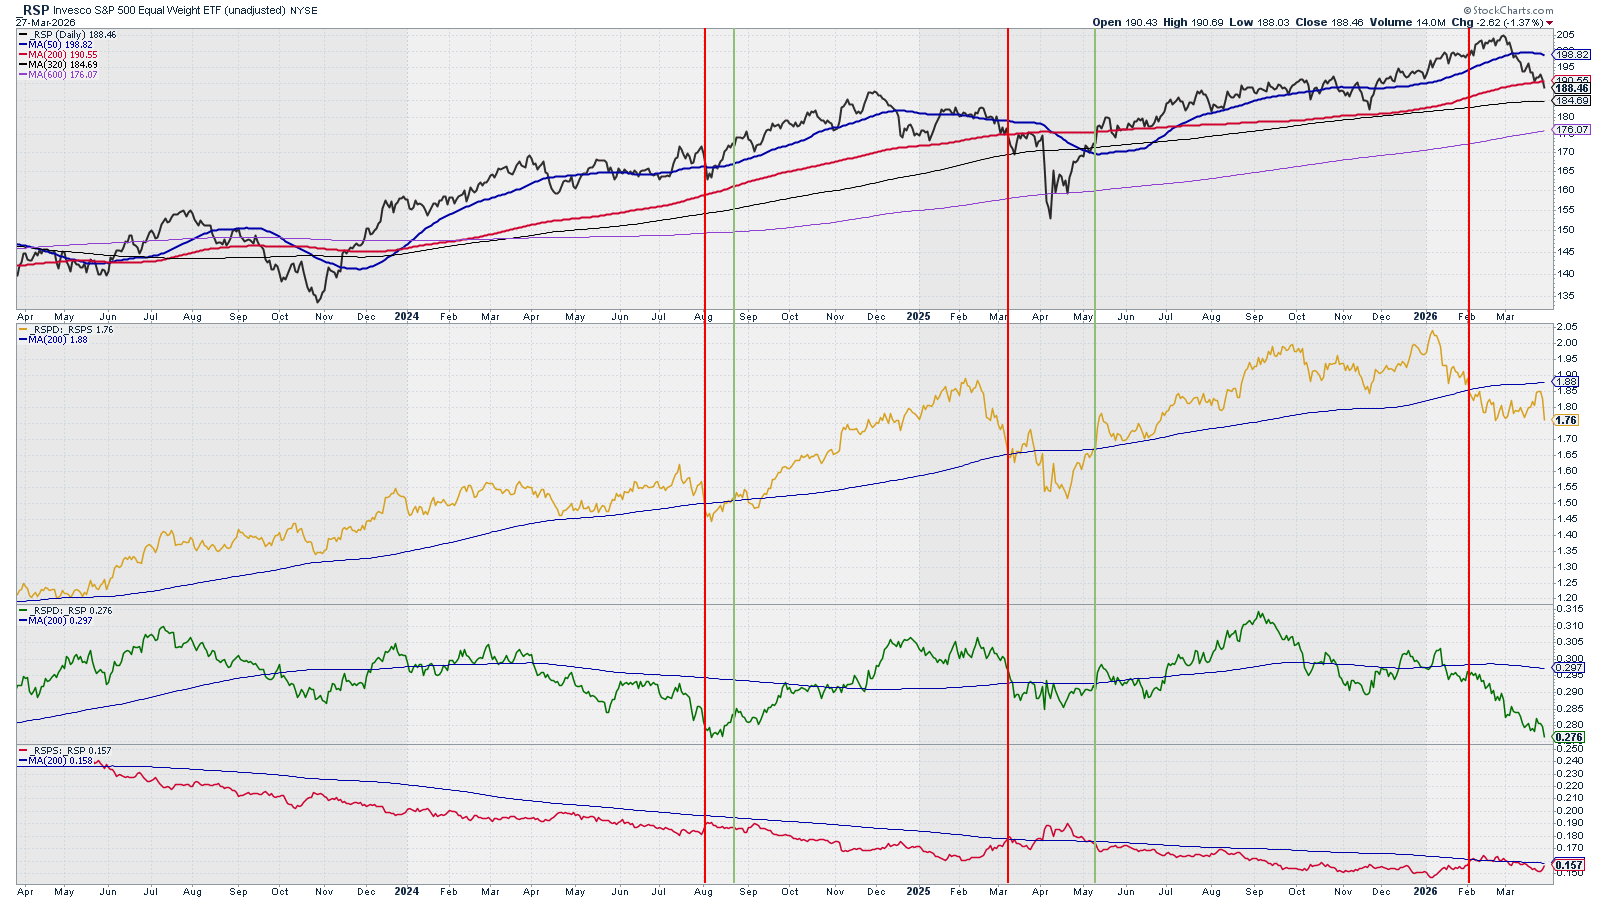
Analysis: The bears are getting stronger and the bulls weaker.
Outlook: Bearish
Commentary: With the benefit of the hindsight, the 3rd of February, the RSPD:RSPS ratio crossed below its SMA 200, giving us an early warning of what was to come. Markets reallly seem to have a crystal ball to see the future.
What is happening? – Level 3
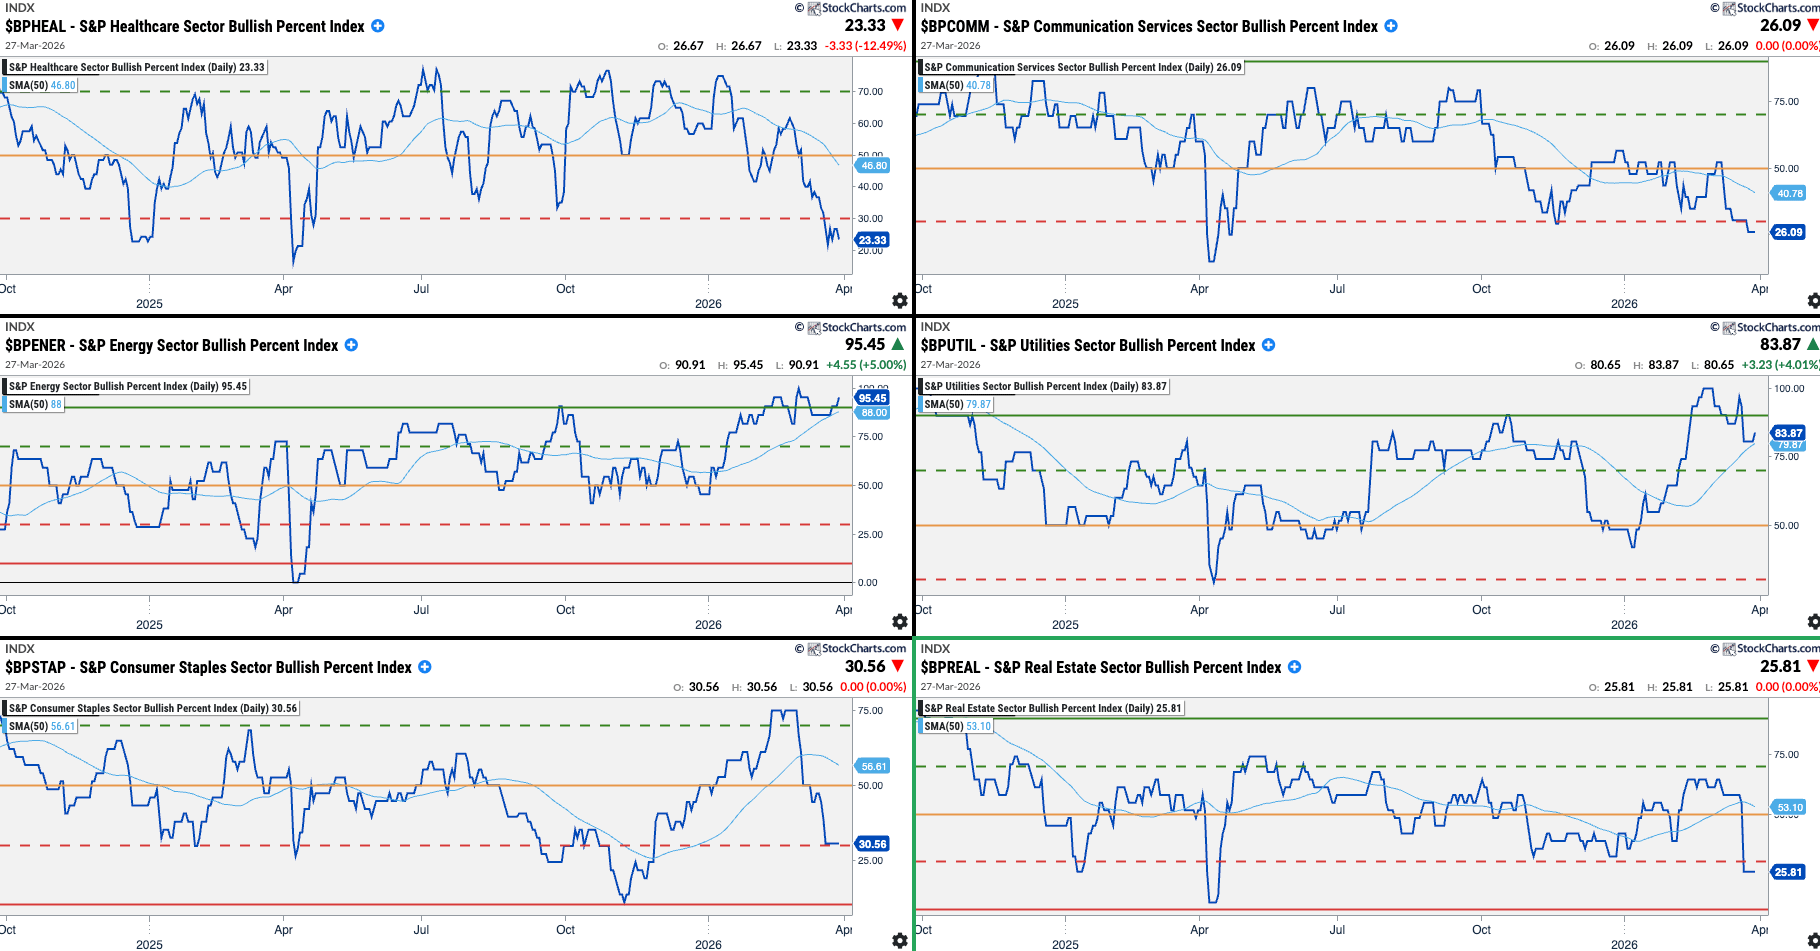
Sectors Rotation: Sectors Bullish Percent Index
Growth Sectors:
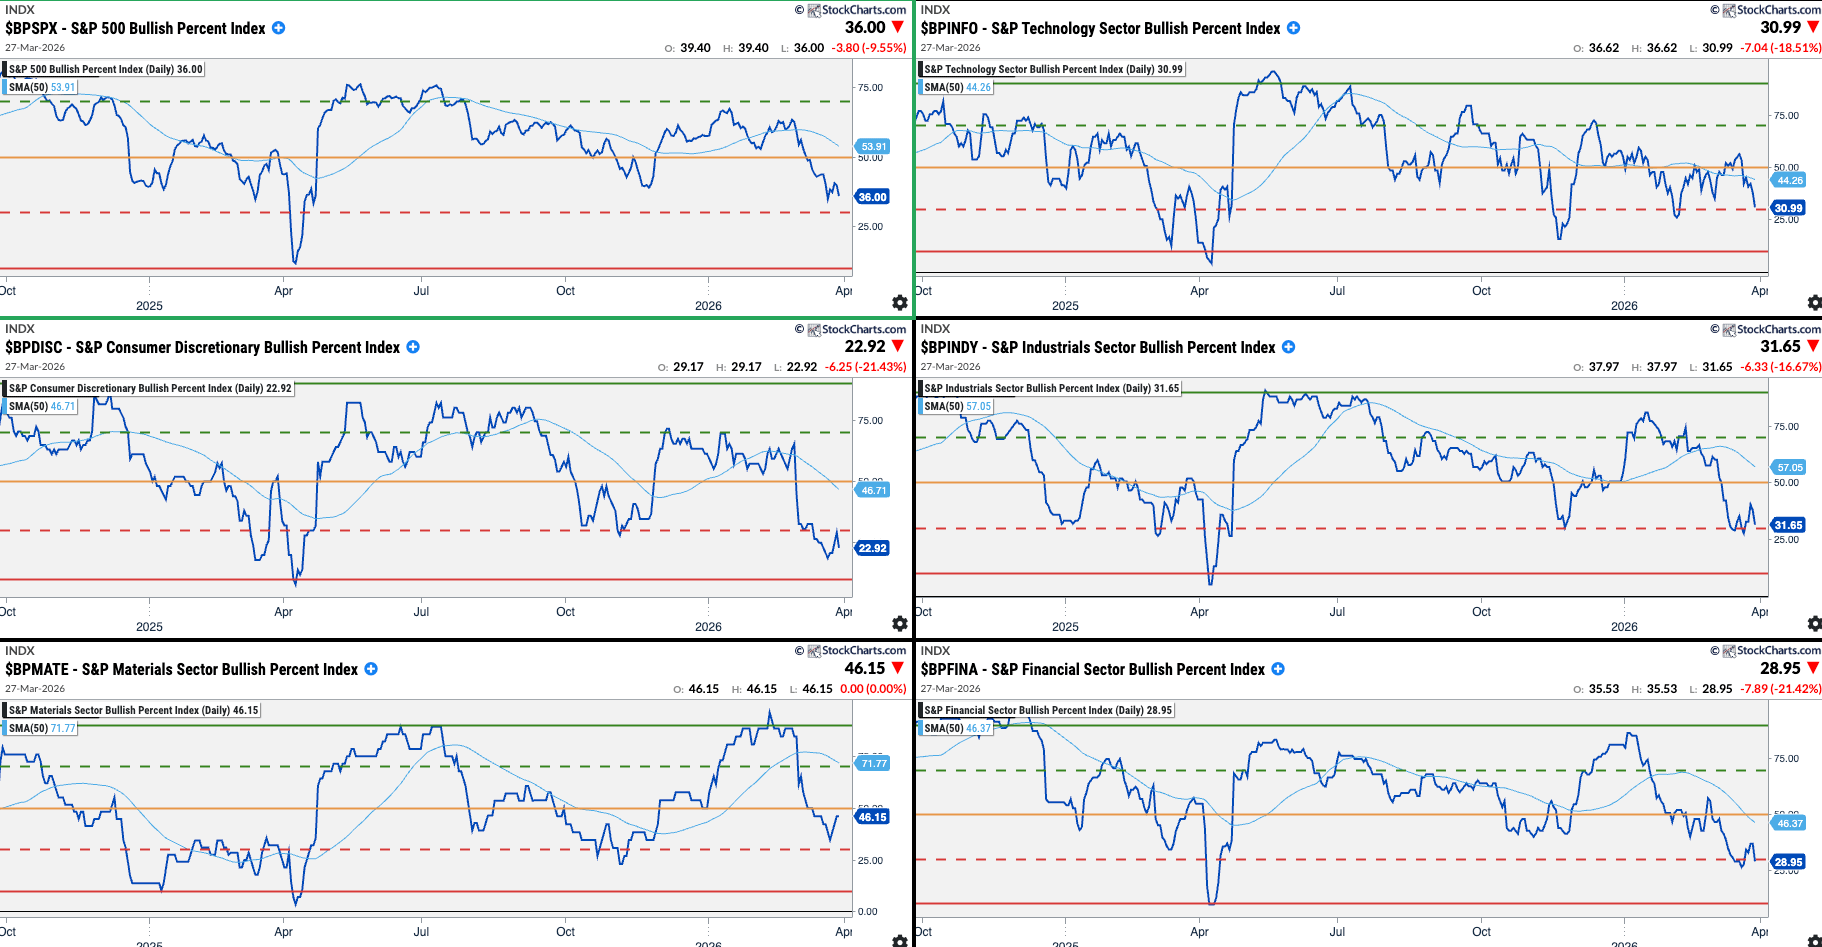
Value Sectors:
US Sectors order by ISM PMI Correlation (between parenthesis)
Growth Sectors - shall outperform when the market is bullish:
XLK: Technology (71%)
XLY: Cons. Discretionary (67%)
XLI: Industrials (66%)
XLB: Basic Materials (66%)
XLF: Financials (59%)
Value Sectors - shall outperform when the market is bearish:
XLV: Healthcare (55%)
XLC: Communications (49%)
XLE: Energy (44%)
XLU: Utilities (35%)
XLP: Cons. Staples (30%)
XLRE: Real Estate (16%)
Analysis:
Any sectors below their red levels are good opportunities to find great companies at good valuations, yet the market can still go lower as there is no sign of extreme oversold situations.
The only sector that is performing well is XLE. All the others are falling due to the energy shockwaves from the Iran war. In situations like this, just stay away from the markets.
Outlook: Bearish for both Growth and Value
Level 3 Summary
Bulls vs. Bears: Bearish
Sectors Rotation: Bearish for both Growth and Value
All Levels Summary and Final Thoughts
Level 1 Summary
Economic Data (long-term): Bullish to Neutral
USD & Interest Rates: Bearish
Investors Sentiment: Bearish
Level 2 Summary
Price Action: Bearish
Breadth & Volatility: Bearish
Options: Bearish
Level 3 Summary
Bulls vs. Bears: Bearish
Sectors Rotation: Bearish for both Growth and Value
Final Thoughts
Dominant Narrative: Iran’s war and the impact of supply destruction
Our analysis doesn’t show any exhaustion bearish momentum. There are no signs of extreme oversold conditions. Any rallies shall be seen as relief rallies, except if there is a major Iran-US war peace agreement. Until the geopolitical situation doesn’t change, we are in a bear market with sellers in the driving seat. Do not buy the bottom.
Disclaimer: The content on AMAT Investing is strictly for educational and learning purposes. The author is not a licensed financial advisor and holds no formal financial education. This post does not constitute professional financial advice. All investing involves risk of loss. Always conduct your own research and consult a licensed professional before making any investment decisions.