

Weekly Review - 2026-Mar-20
Iran's war will have a great impact on non-US markets.

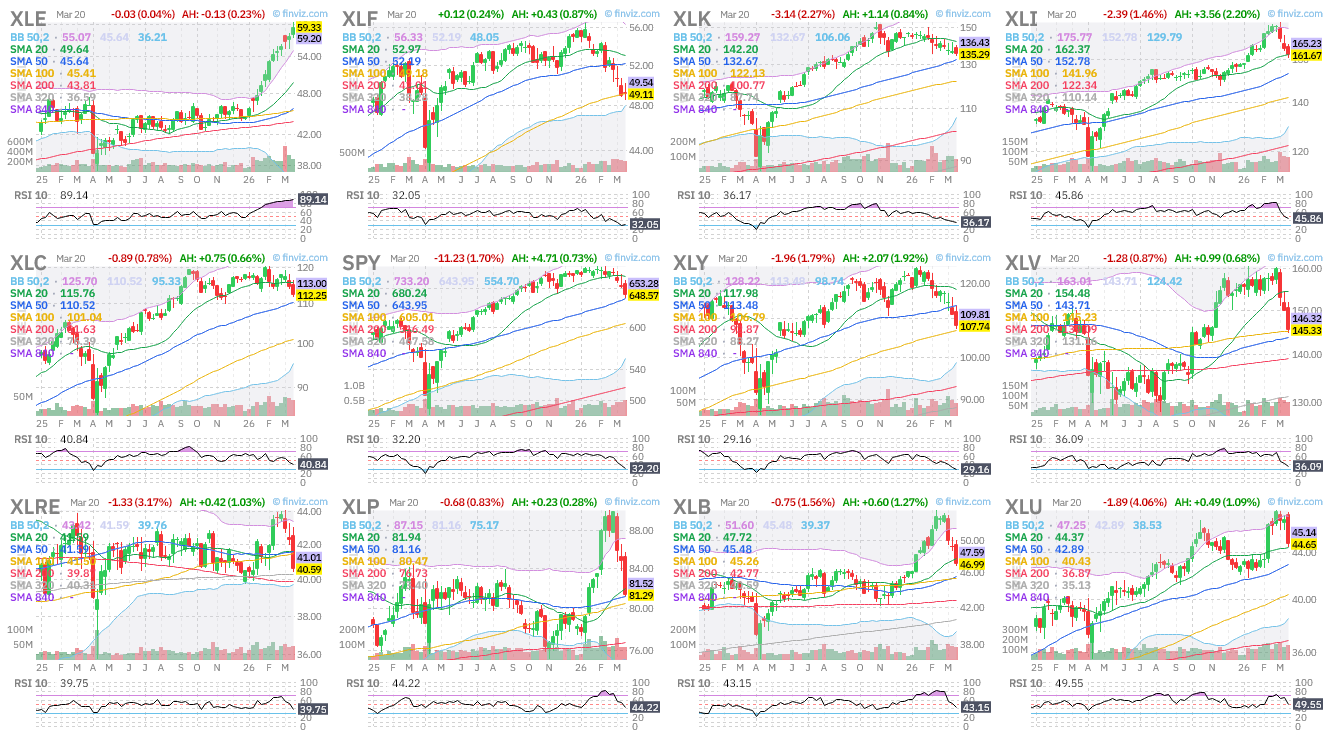
US Cap. Weighted Sectors ordered by weekly performance (desc):
Weekly:
Daily:
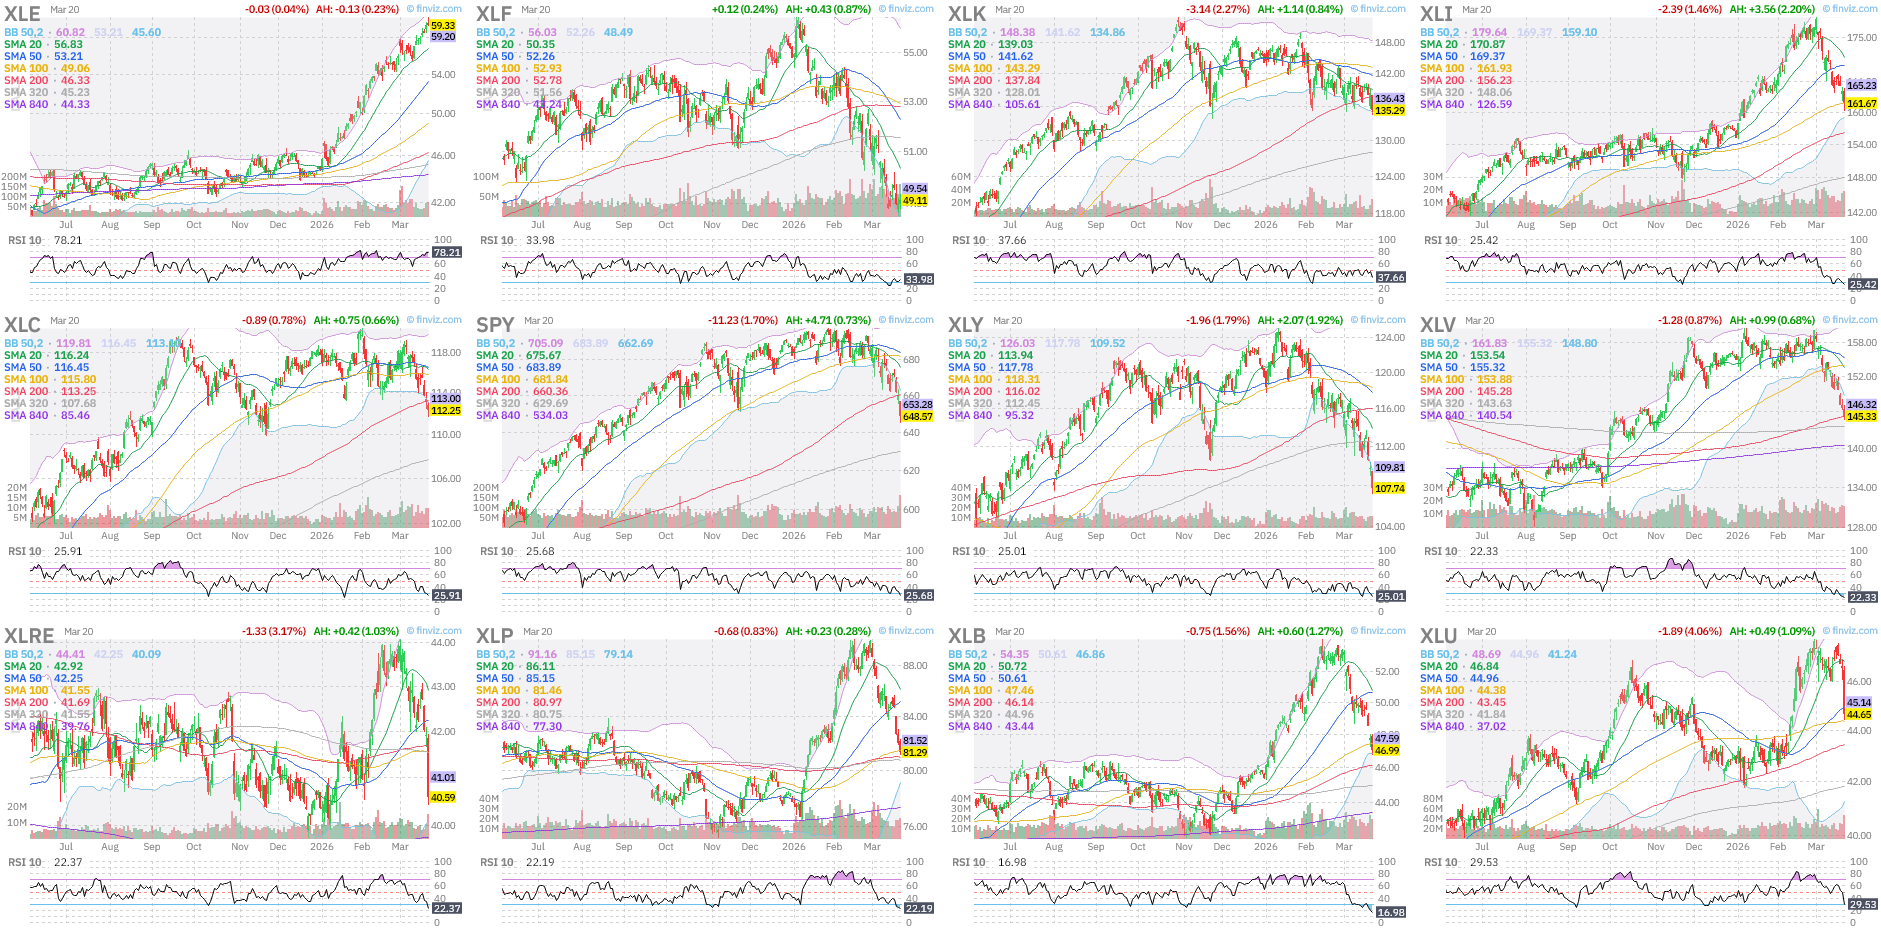
Comment: SPY crossed below SMA 200. The next support will be down around 630 level at the SMA 320. We may see extreme selling at that level and a good candidate for a bottom.
Good relative performance this week on the XLF, which is the sector that we need for a bull market - "there is no bull market without finance”
Big low candle on XLP, XLRE, and XLU, as higher energy prices for longer will have a direct negative impact in the sector, by squeezing profits.
Knowing market sectors rotation theory, money leaving value sectors such as XLP, XLRE, and XLU will enter growth sectors like XLK, XLC, and XLI. As these sectors are bigger than anything else in the market, they will take the indexes to ATH once the geopolitical events are priced in and calmer waters return to the political arena.
Why is it happening? – Level 1
Economic Data: Production: ISM PMI vs. SPX
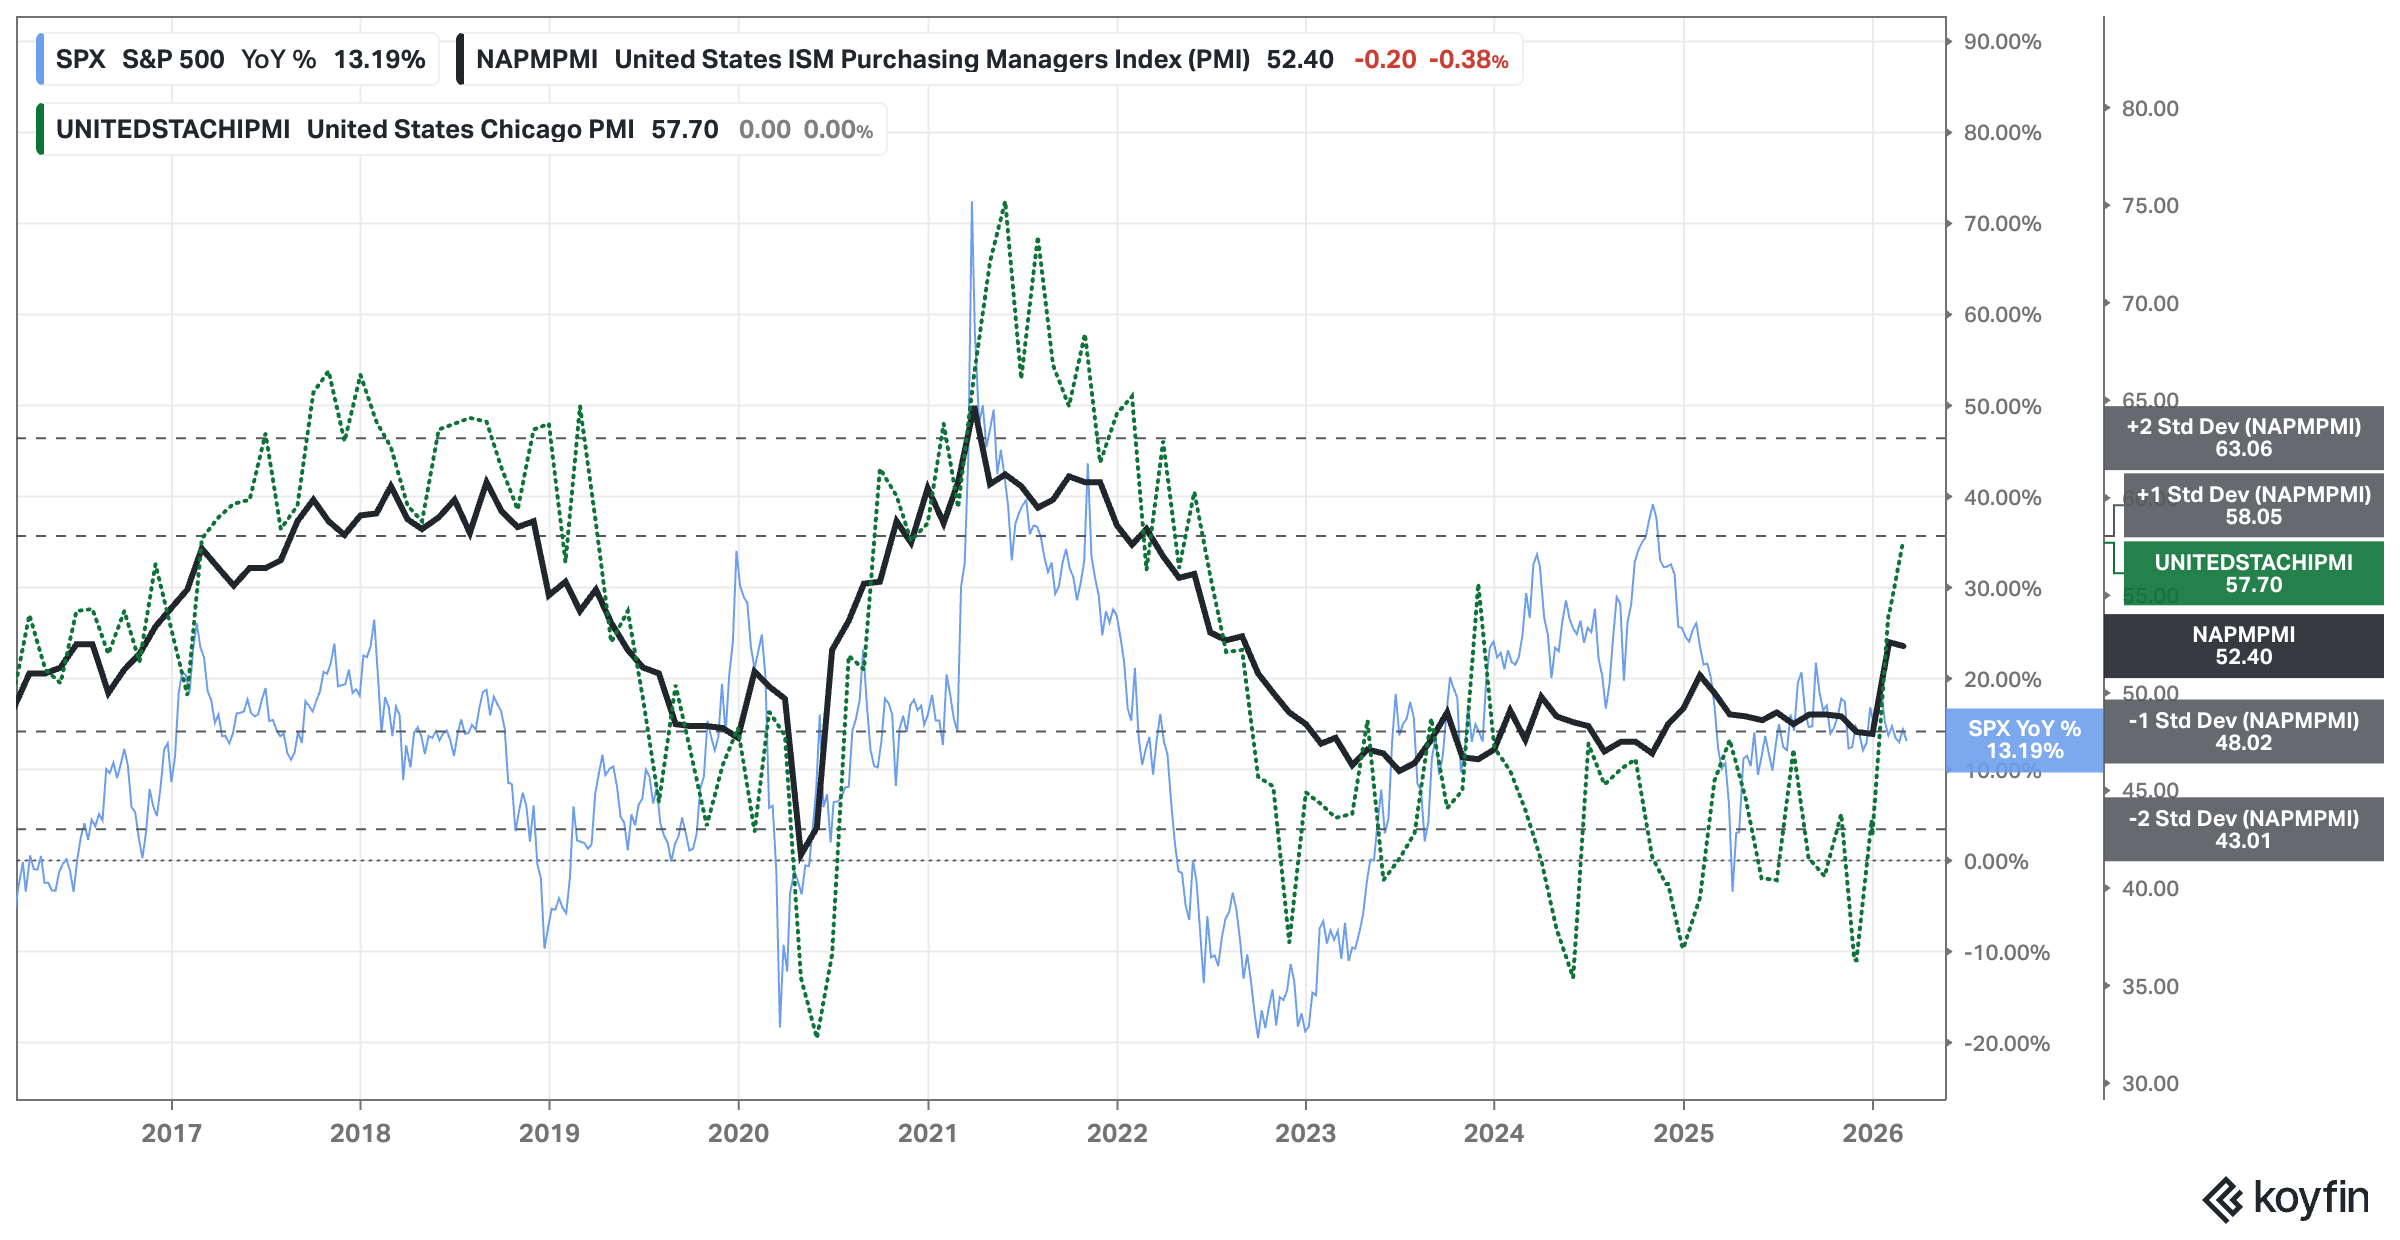
Analysis: No changes since last week.
Outlook: Bullish
Why is it happening? – Level 1
Economic Data: Production: Dallas & Philadelphia Manufacturing vs. SPX
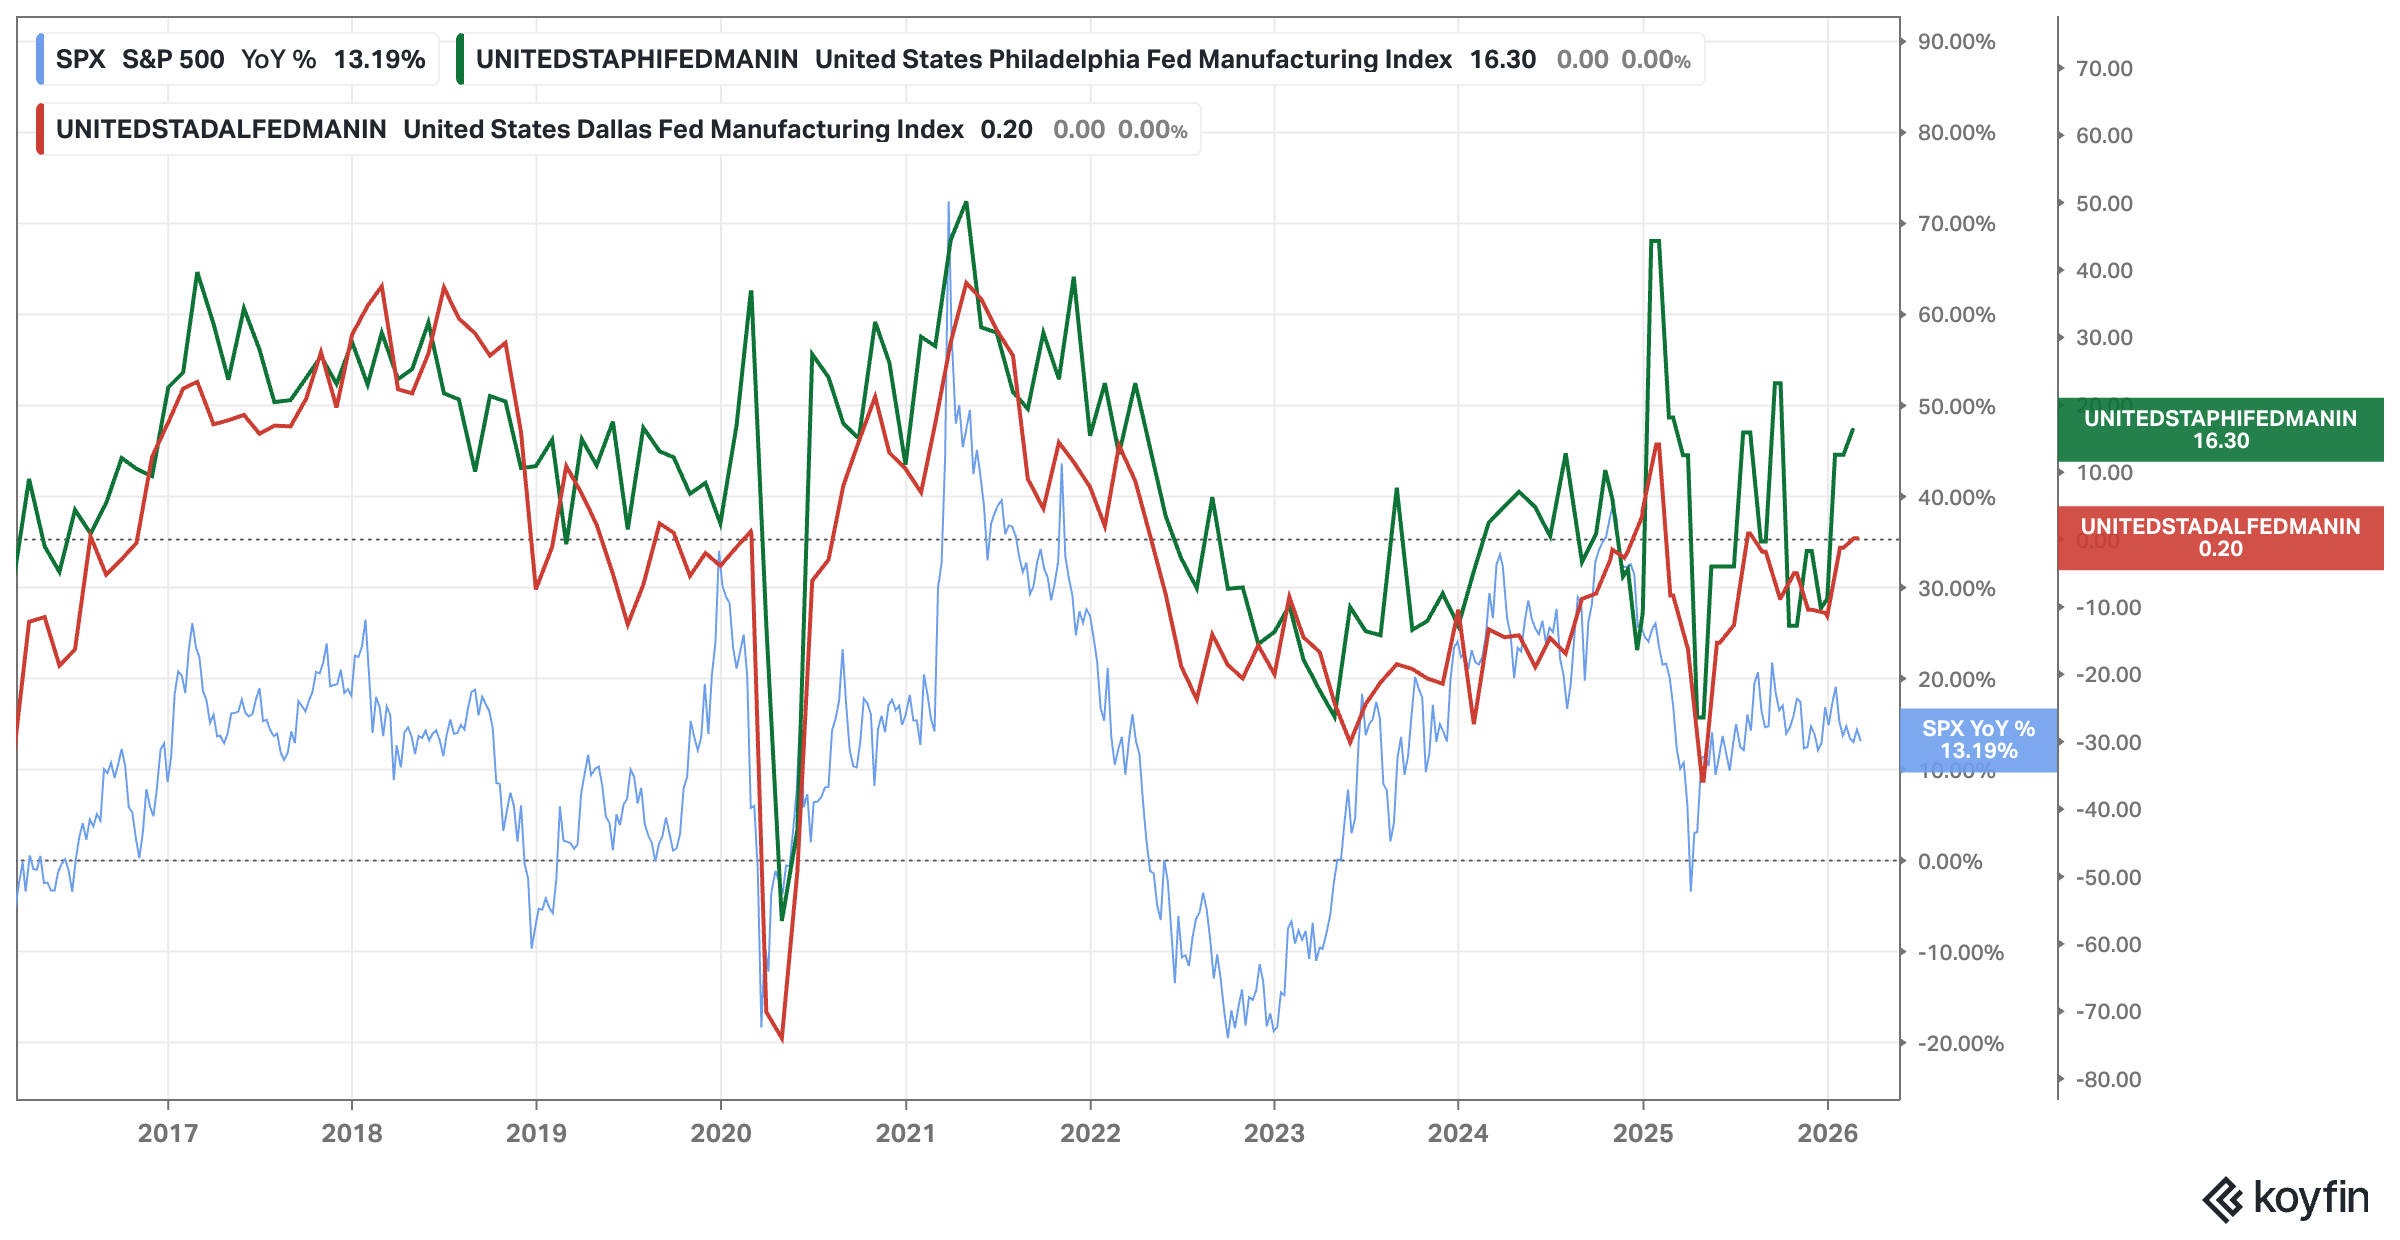
Analysis: No changes since last week.
Outlook: Bullish
Why is it happening? – Level 1
Economic Data: Consumption: Consumer Sentiment
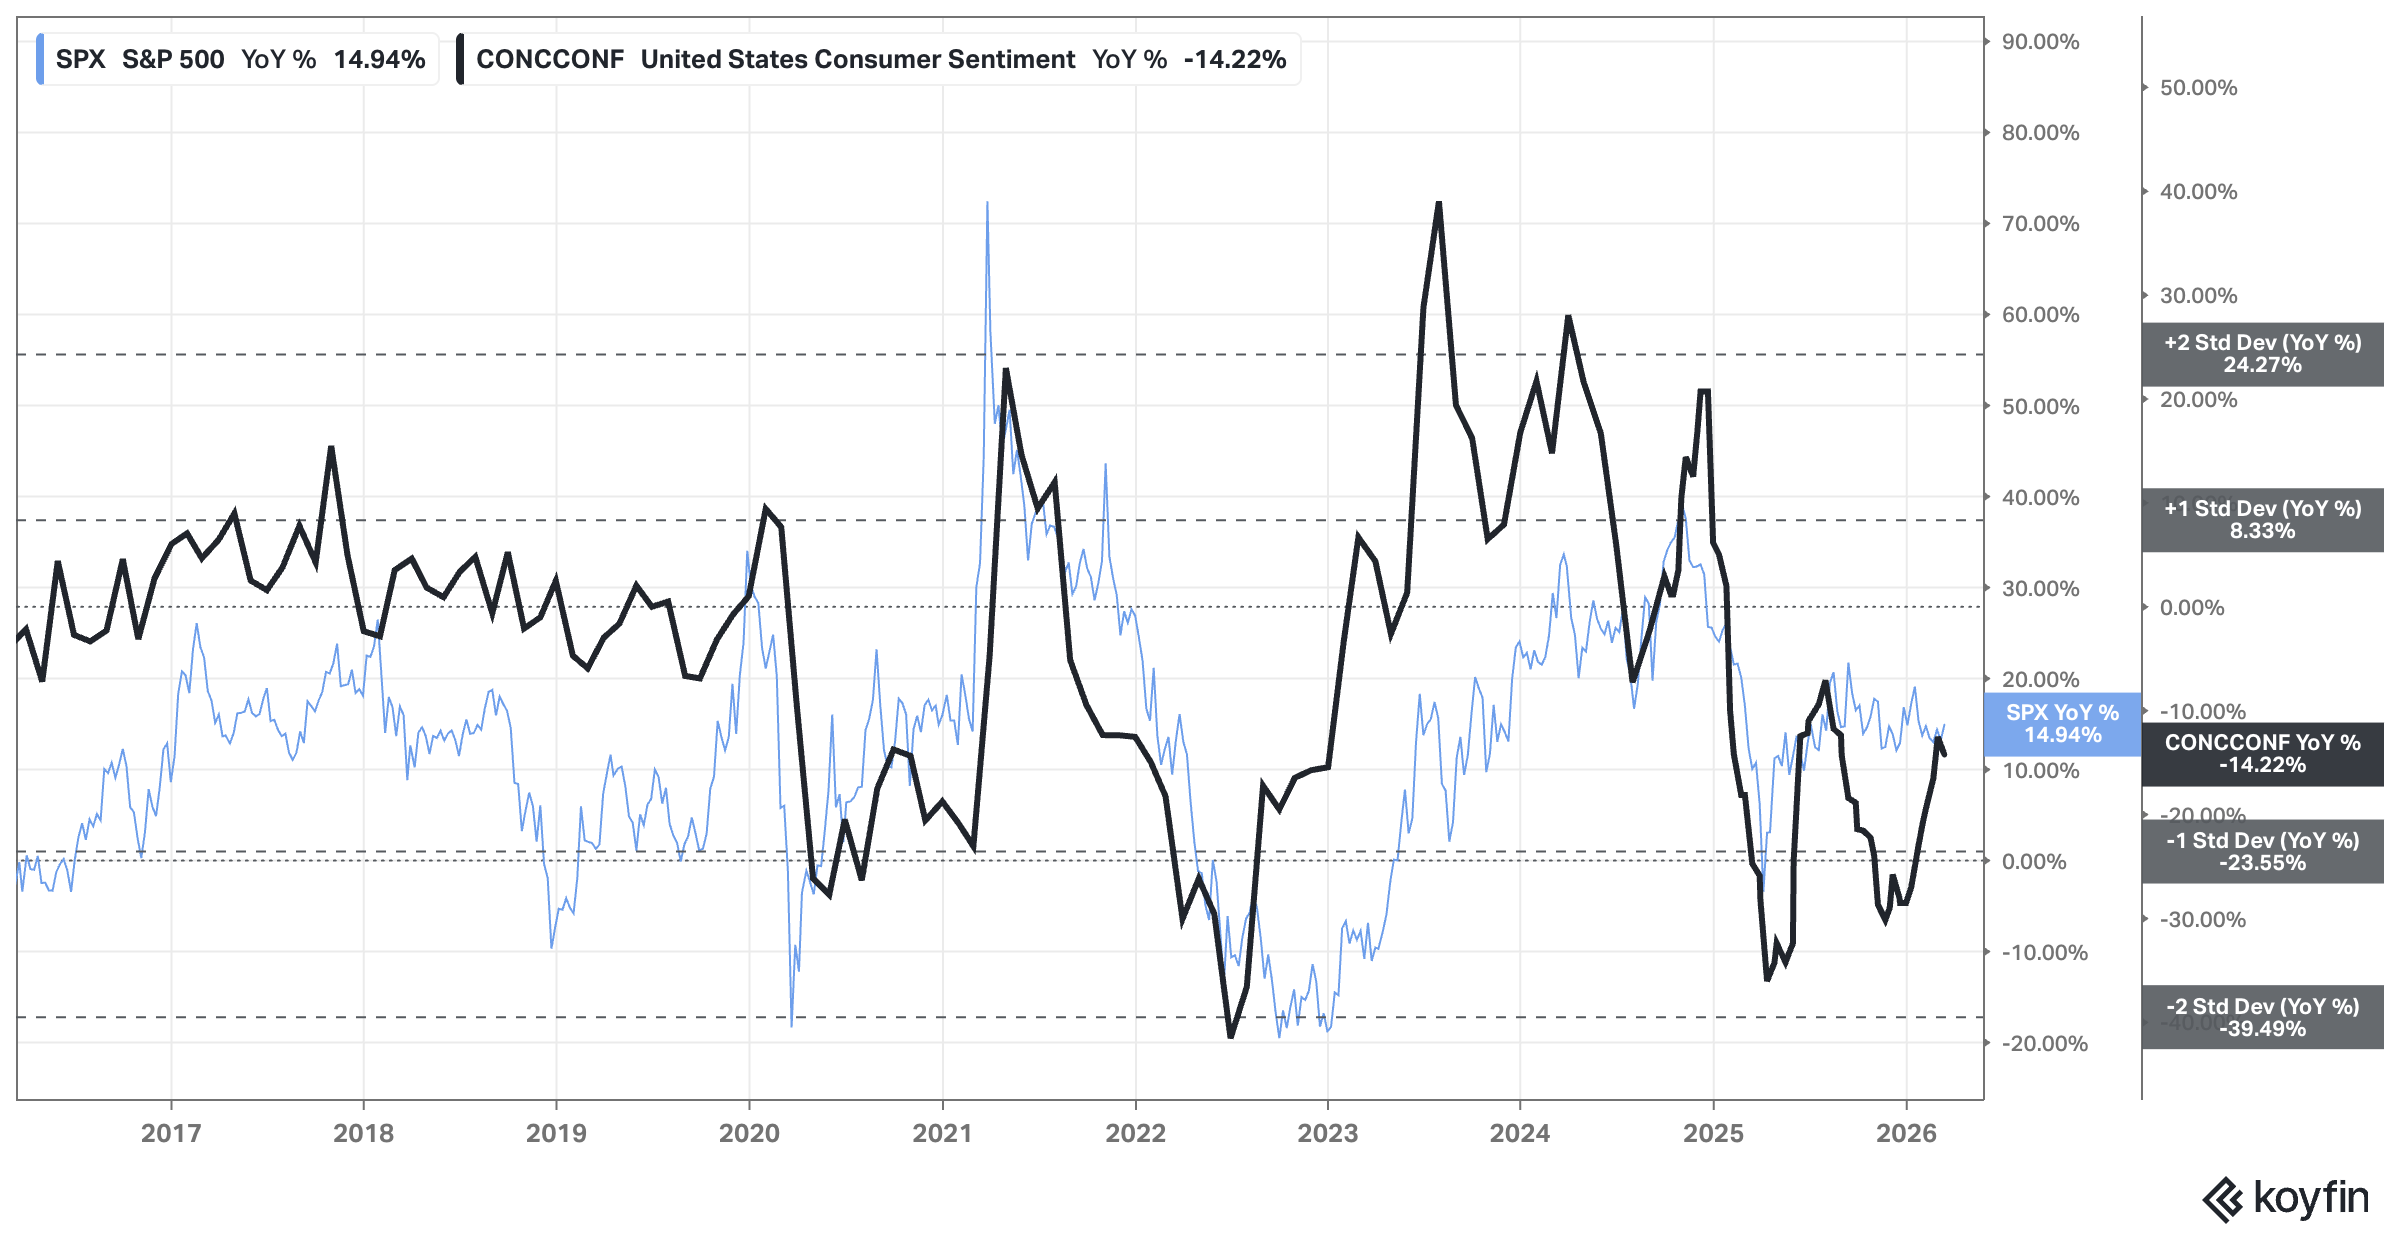
Analysis: No changes since last week. Consumer confidence deteriorated a bit on the last report. We keep our bullish outlook due to the low reading and the expectation of future improvement.
Outlook: Bullish
Why is it happening? – Level 1
USD & Interest Rates: FED, 2yr, and 10yr Rates
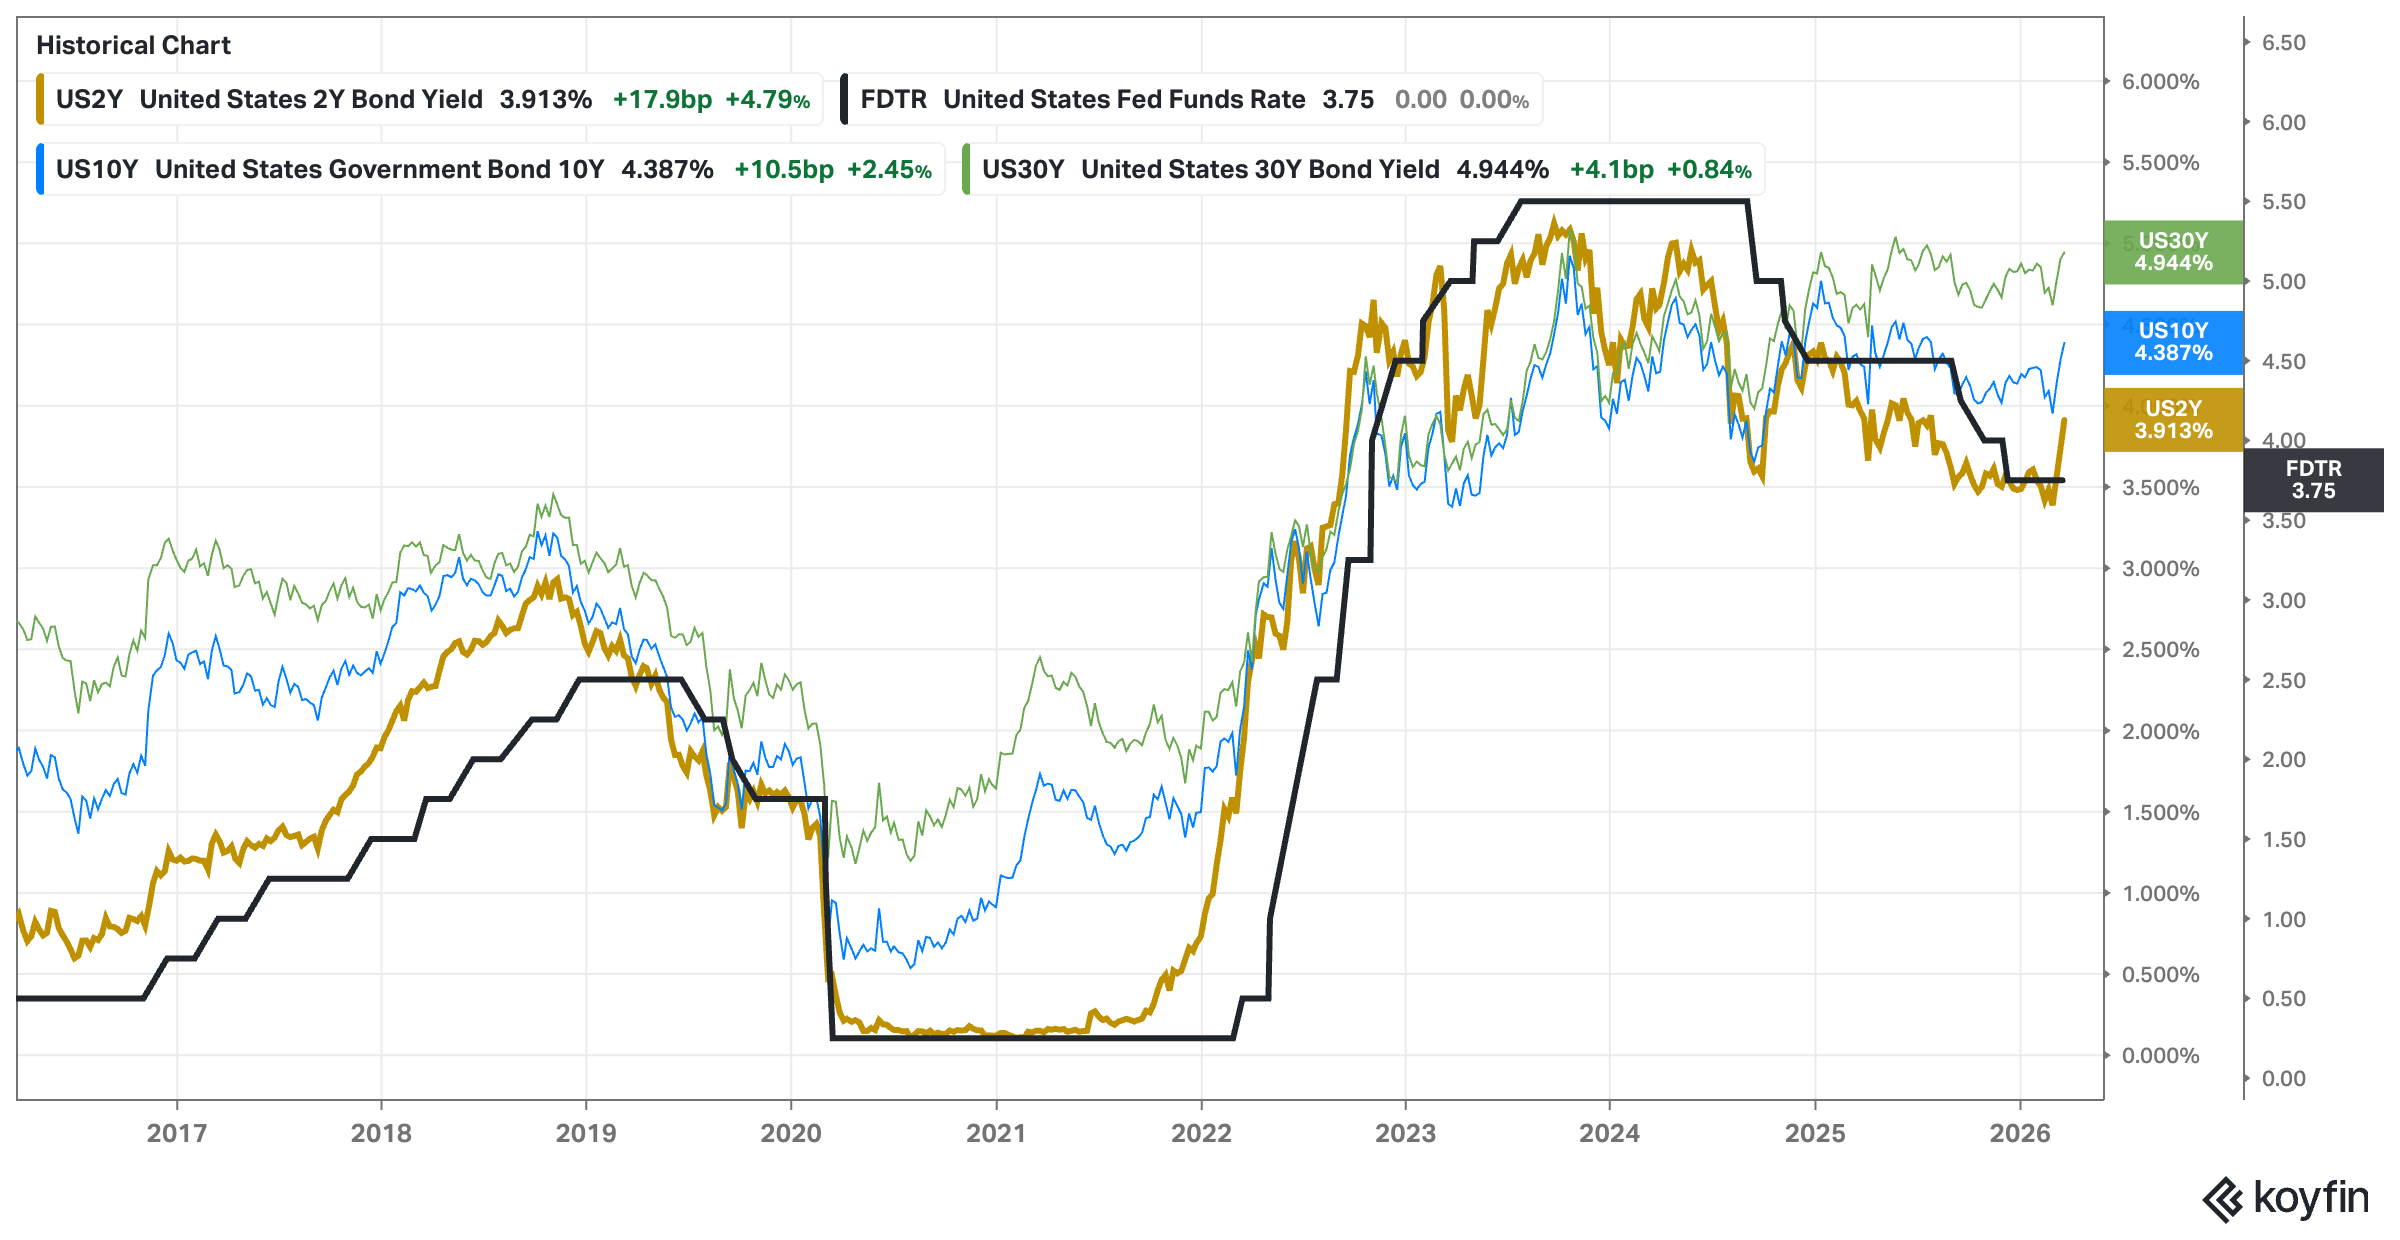
Analysis: Long-dated rates continued trending higher this week due to the Iranian war. The impact on Fed Rates and Stocks will depends on the war’s length. As it is now is not good for the markets.
Outlook: Neutral to Bearish.
Why is it happening? – Level 1
USD & Interest Rates: USD vs EEM and S&P500
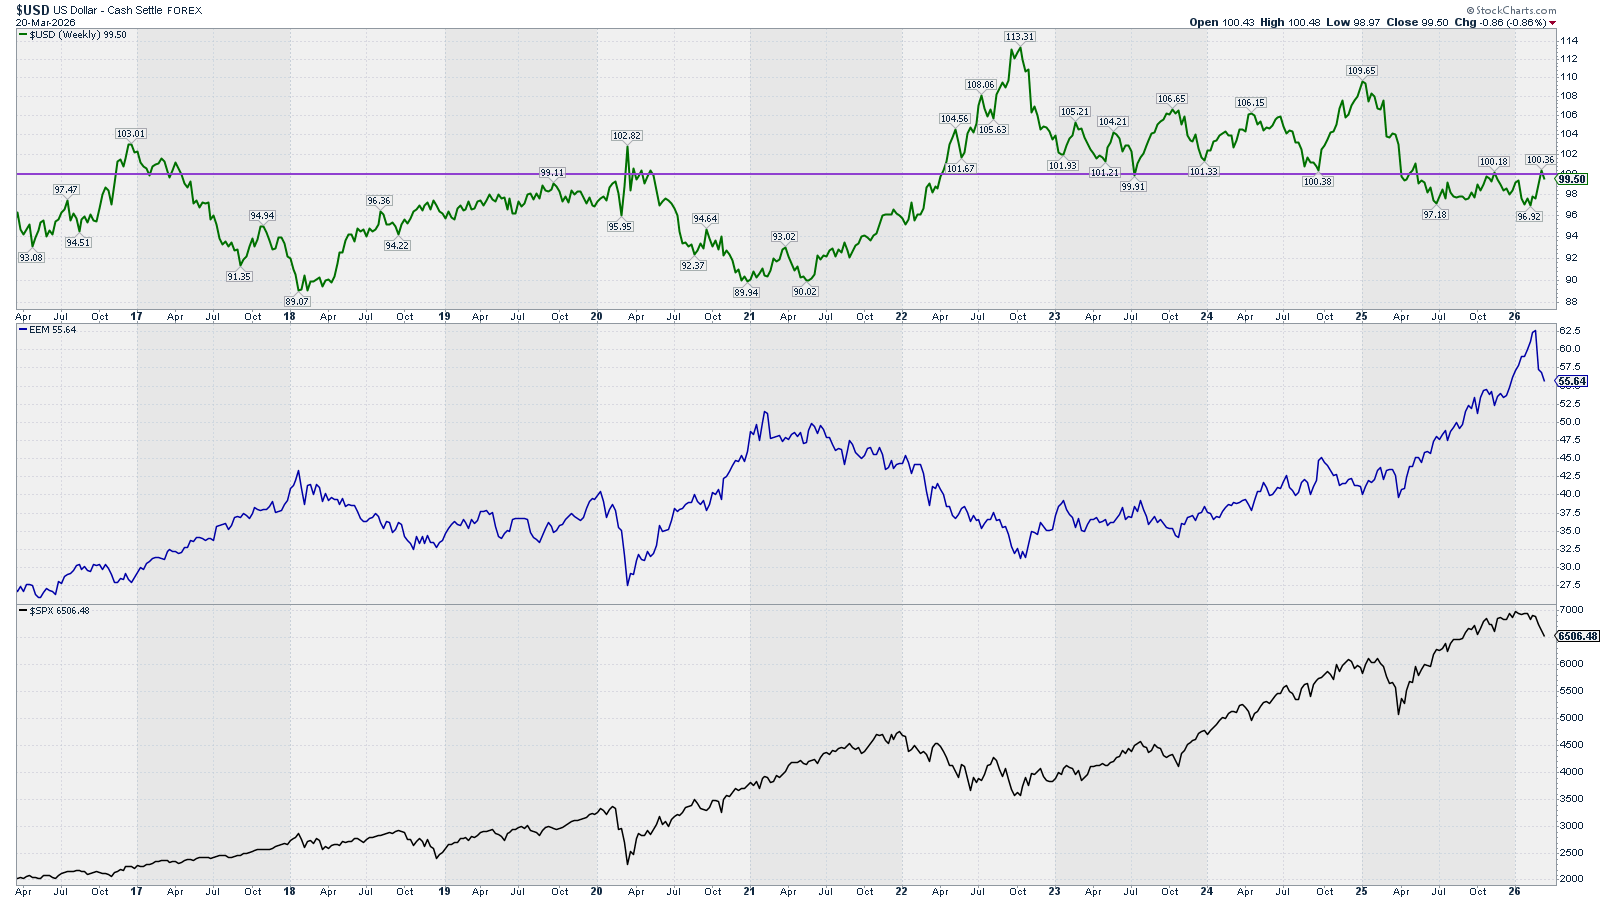
Analysis: USD struggled and failed to break above the 100 level resistance. The Iran war raised the USD and made EEM to fall sharply, as the impact on higher oil & gas prices will have a great impact on EEM.
Outlook: Bearish (the longer the war the higher the oil & gas disruption)
Why is it happening? – Level 1
Context Investors Sentiment: Credit Spreads
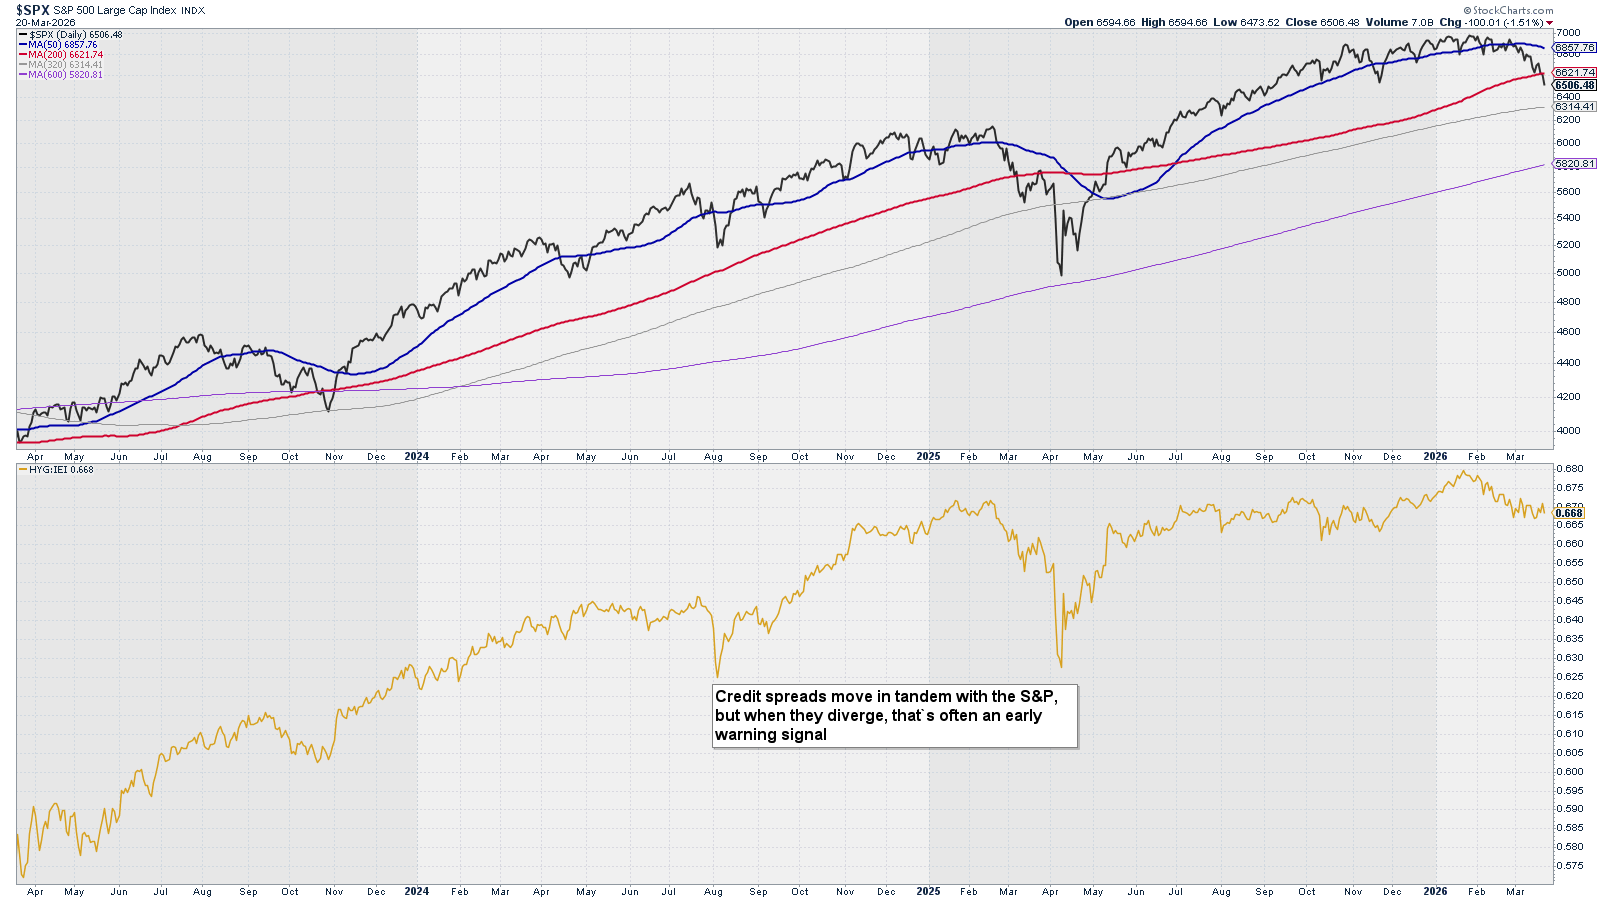
Credit spreads move in tandem with the S&P, but when they diverge, that’s often an early warning signal.
Analysis: There is a bit of divergence between S&P and credit spreads, with spreads more sideways than S&P. This could be a good signal for stocks, yet it is too early now.
Outlook: Bearish
Level 1 Summary
Economic Data (long-term): Bullish to Neutral
USD & Interest Rates: Bearish
Investors Sentiment: Bearish
What is happening? – Level 2
Price Action: SPX – Trend – 20 years
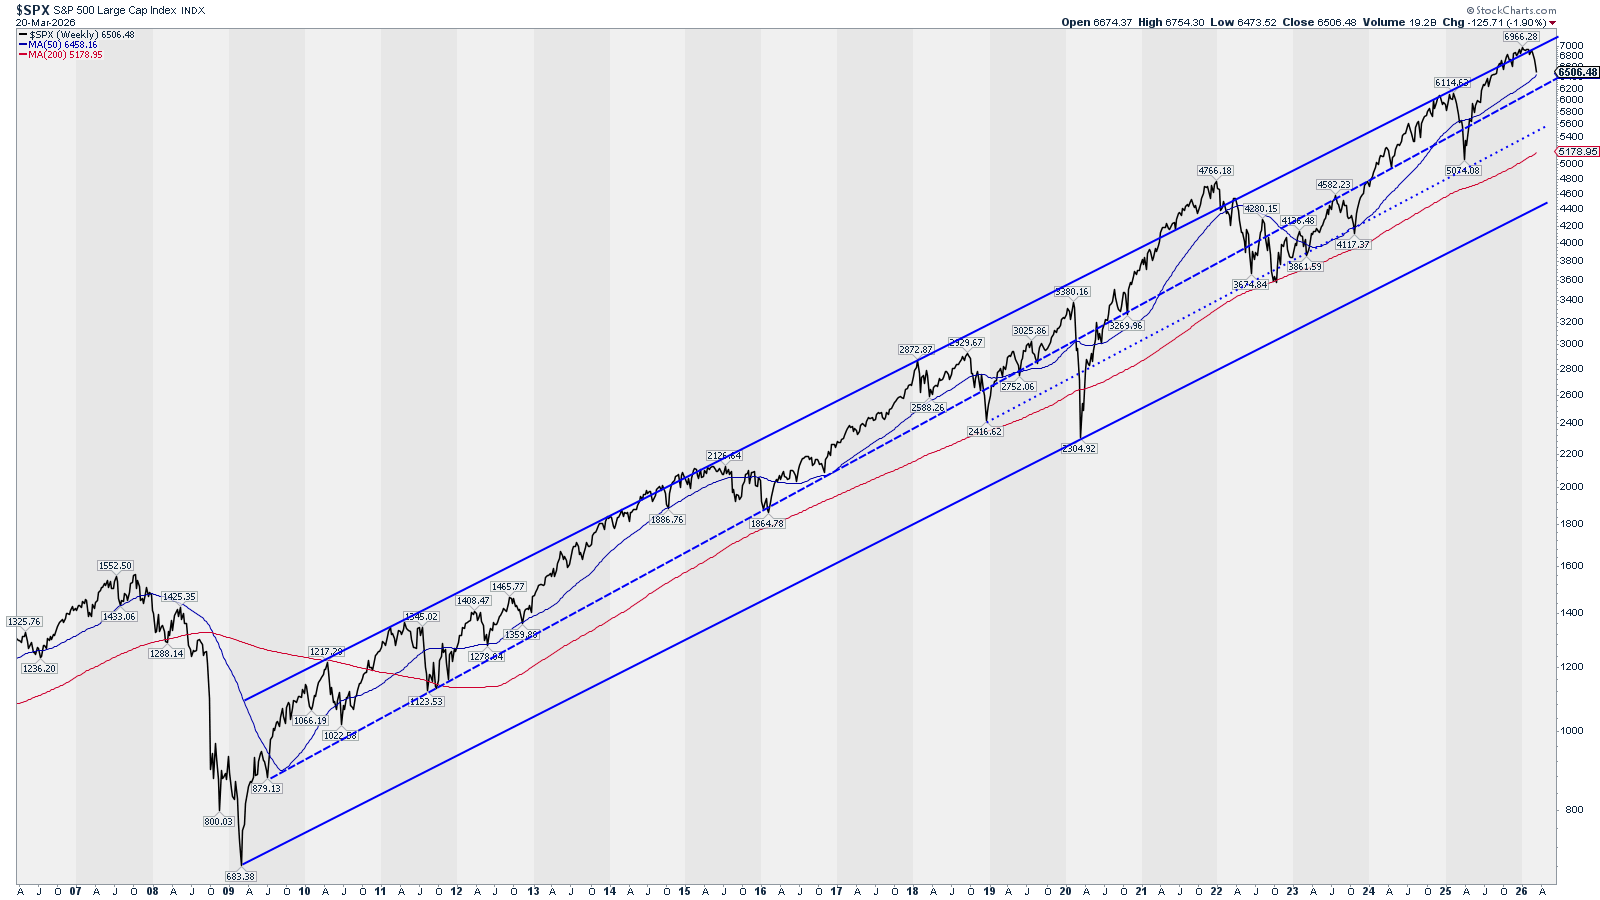
Analysis: Price, finally, fell below the upper channel of the last 20 years trend. There is still margin for the market to fall until any significant resistance is reached - for example the middle of the channel.
Outlook: Bearish
What is happening? – Level 2
Price Action: RSP – Trend – Weekly
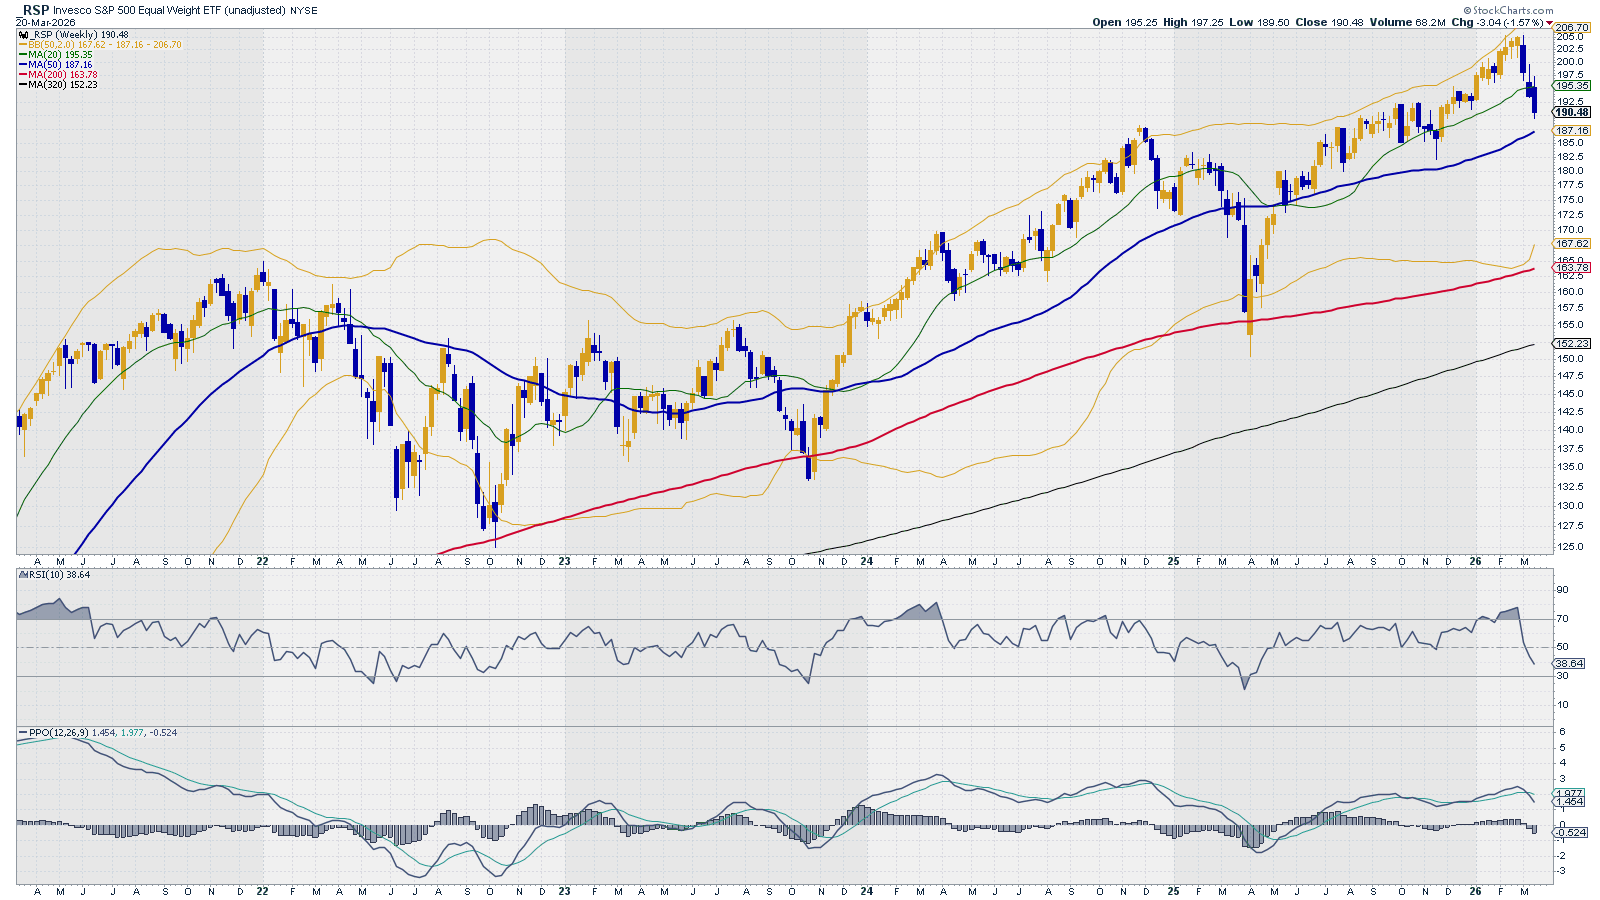
Analysis: Sharp decline in price and reversal on RSI and PPO.
Outlook: Bearish
What is happening? – Level 2
Price Action: RSP – Trend – Daily
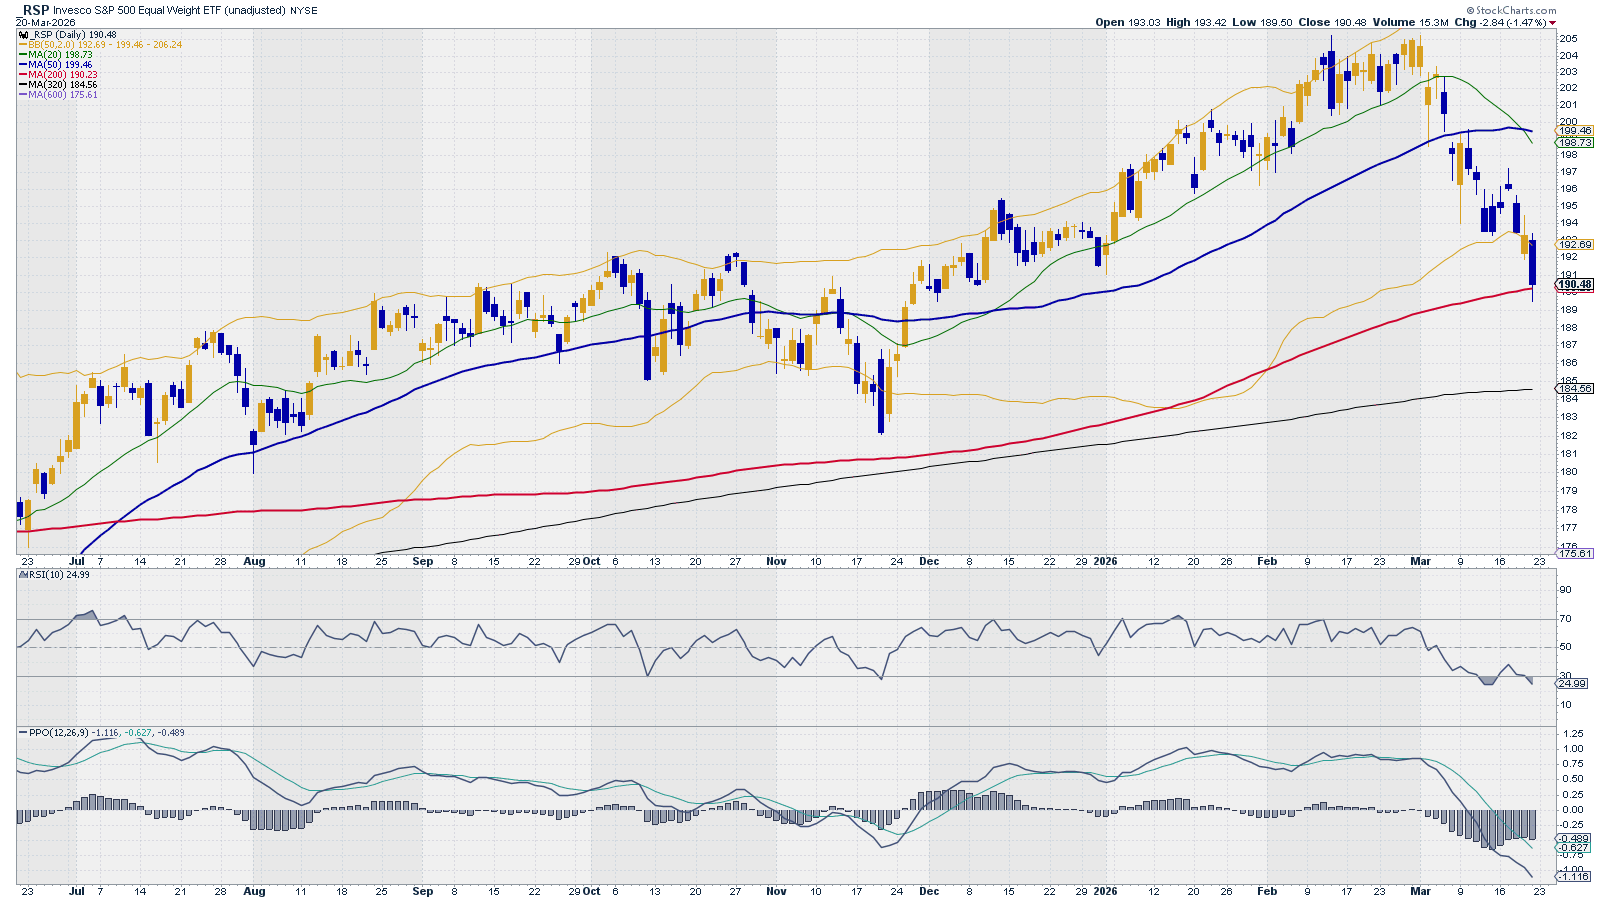
Analysis: One of the rare occasions where RSP’s RSI is oversold. Previous occasions offered great entry points. We will wait to see if there is a positive price reaction and the RSI leaves the oversold area to change the outlook to Bullish. Ideally, we would like to see a bullish divergence with RSI pointing to a recovery and price making a new low.
Outlook: Bearish
What is happening? – Level 2
Breadth & Volatility: % Stocks above 200 SMA vs. RSP
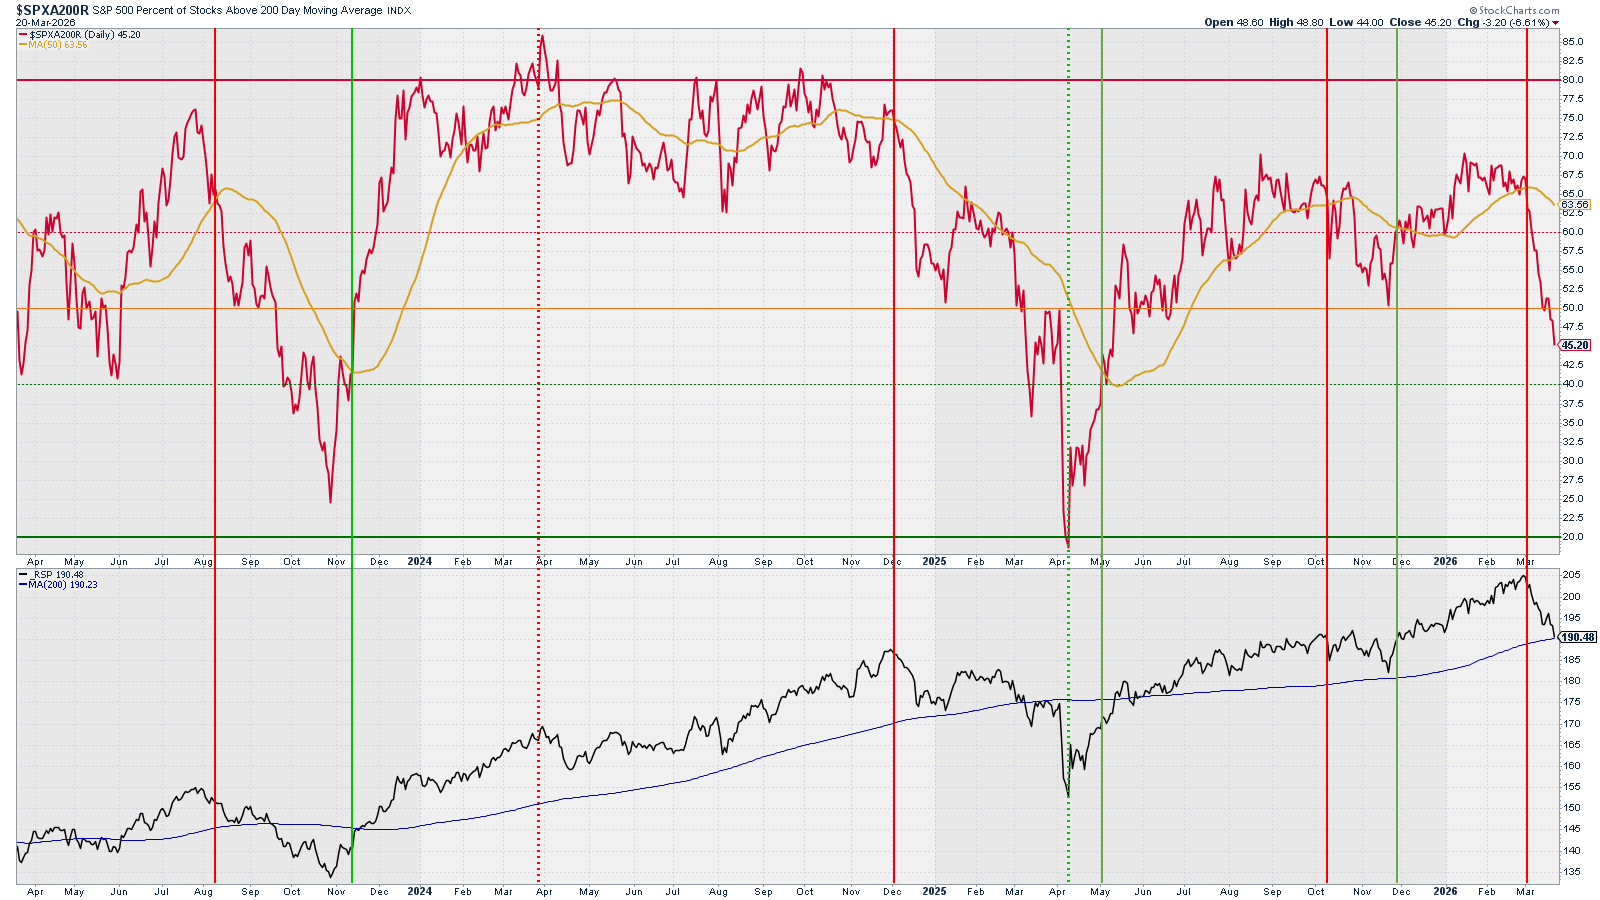
Analysis: Only 45% of the market is above their SMA 200. Definitely a bearish situation.
Outlook: Bearish
What is happening? – Level 2
Breadth & Volatility: RSP and % Stocks above 200, 50, and 20 SMA
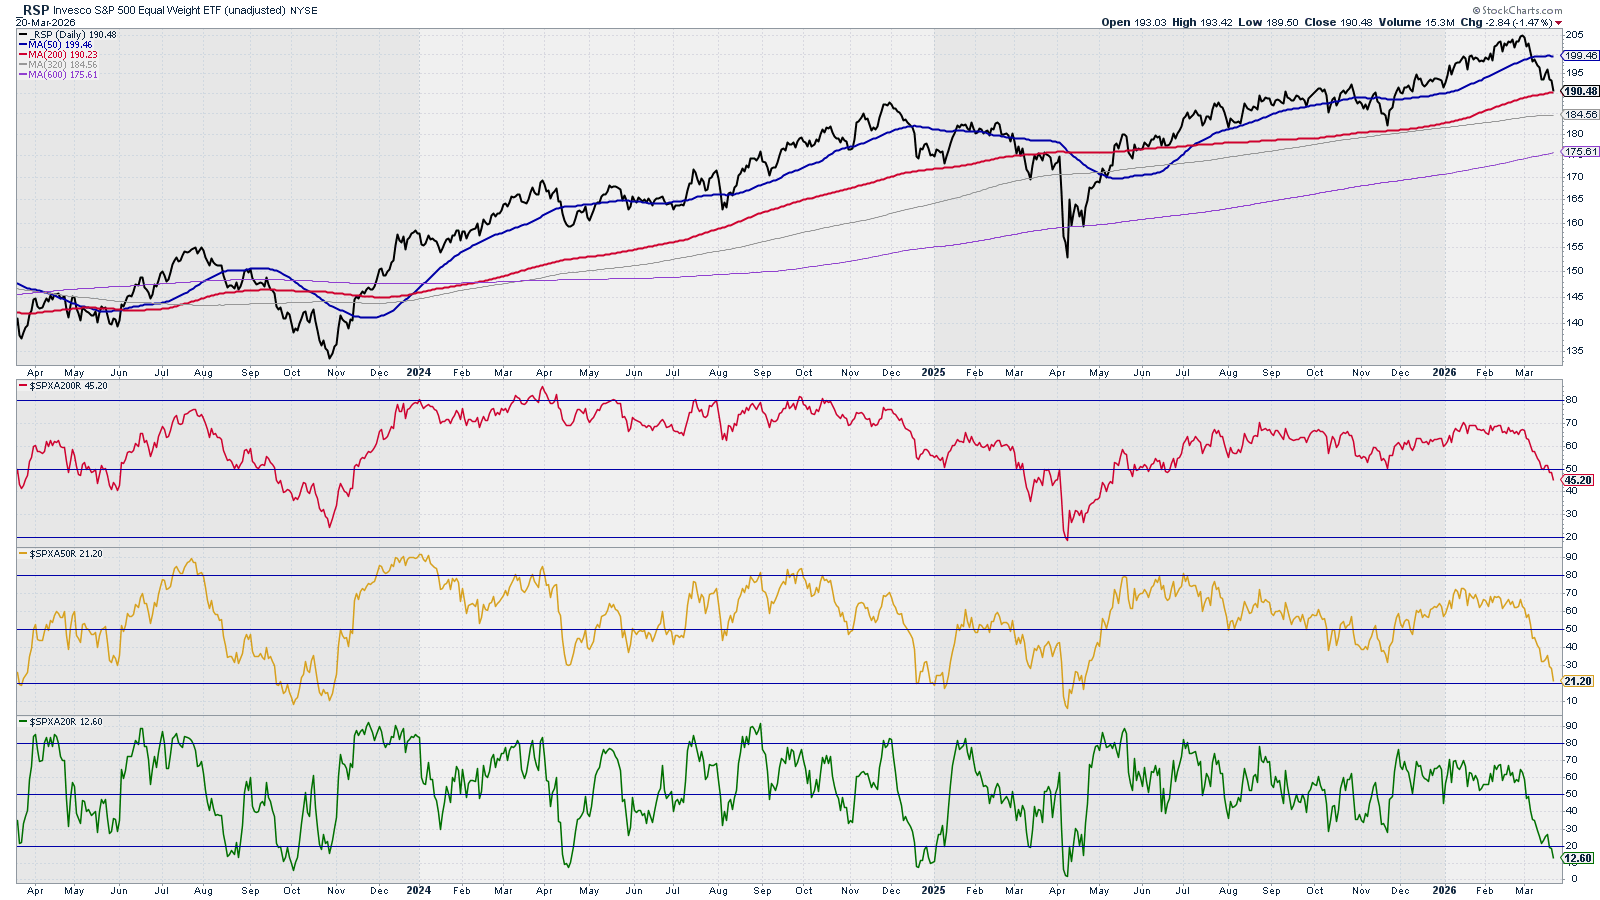
Analysis: All percentage signals in bear territory, with SMA 20 entering oversold territory. We may expect a relief rally sometime soon maybe, but we need to see other breadth indicators improving before calling the bottom.
Outlook: Bearish
What is happening? – Level 2
Breadth & Volatility: Bullish Pct. Index & McClellan Summation Index
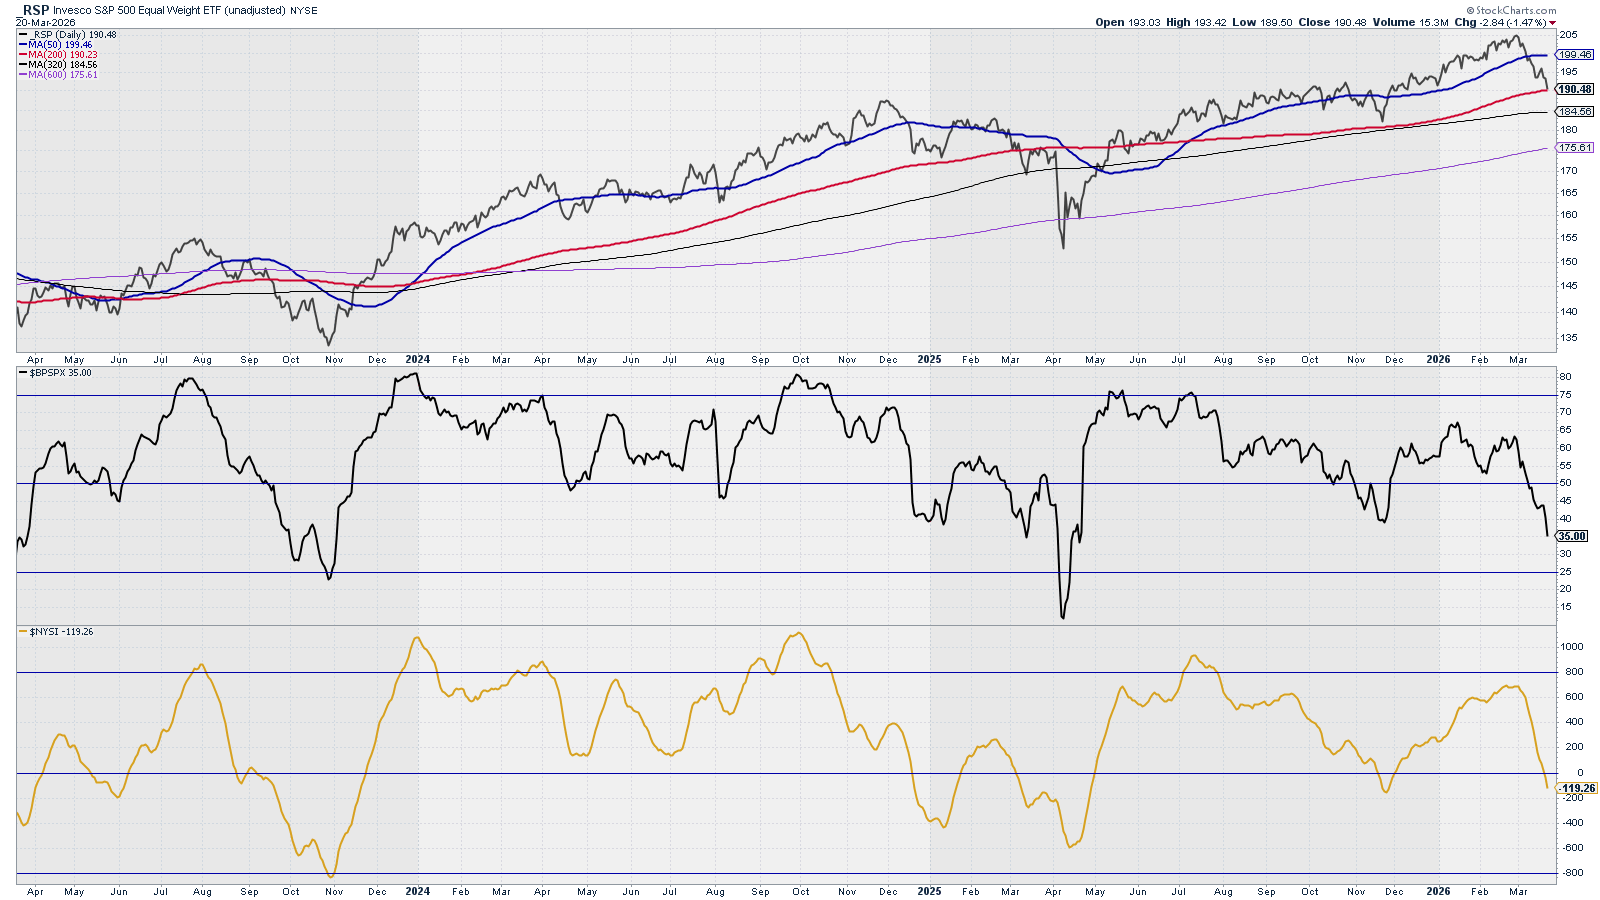
Analysis: Both signals in clear bear territory with no signals of stopping the downward trend.
Outlook: Bearish
What is happening? – Level 2
Breadth & Volatility: Ratio Low Volatility Stocks / SPY vs. SPY & RSP
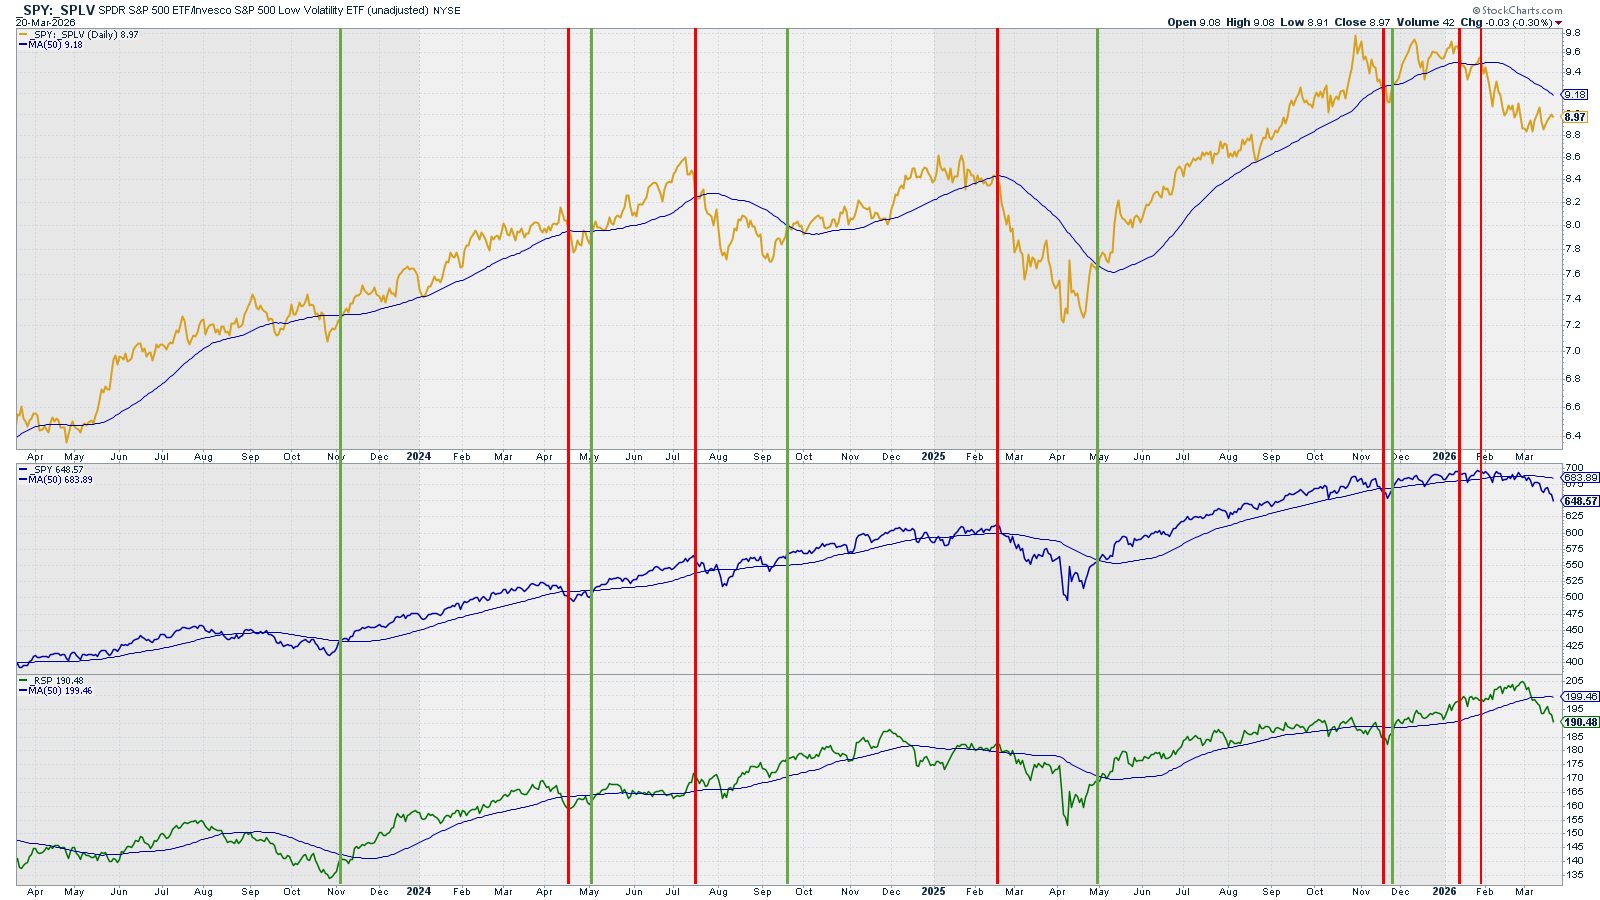
Analysis: Ratio went sideways this week, which is a good sign or early recovery, yet markets went down. The coming days will show us how this divergence unfolds.
Outlook: Bearish
What is happening? – Level 2
Breadth & Volatility: New Highs vs. SPY & RSP
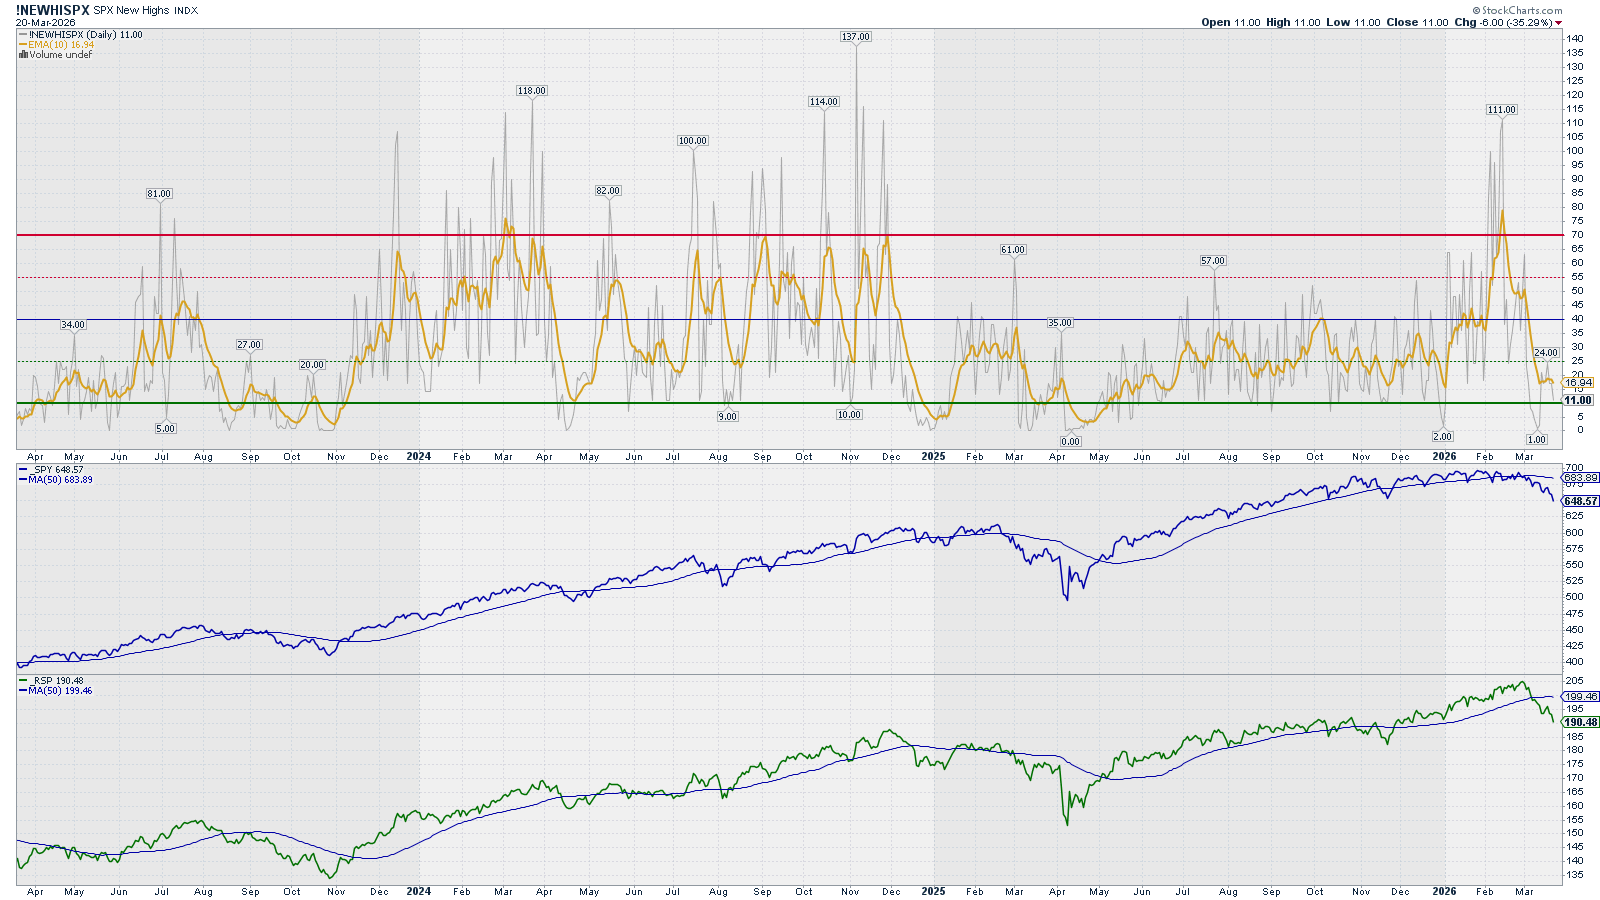
Analysis: New Highs continue lowering but they are not at extreme lows. We keep the Bearish outlook.
Outlook: Bearish
What is happening? – Level 2
Breadth & Volatility: VIX vs. SPY & RSP
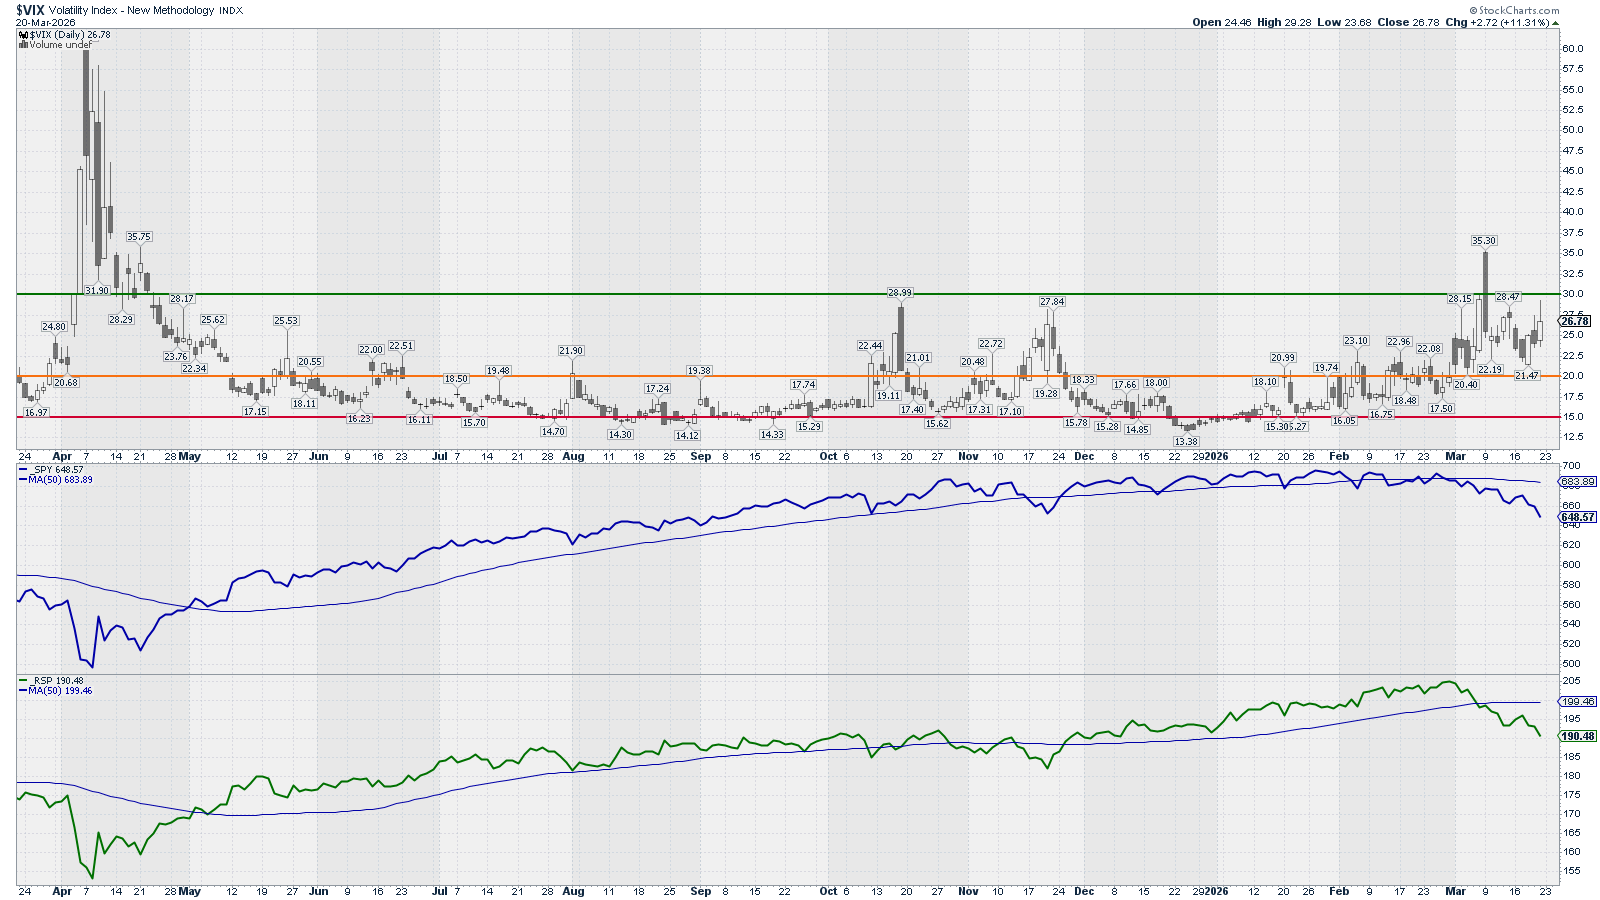
This chart is mainly to detect market bottoms.
Analysis: VIX still not above level 30.
Outlook: Expect high volatility. Markets can fall sharp here for a quick rebound later.
What is happening? – Level 2
Options: (Inverted) Put/Call Ratio vs. SPY
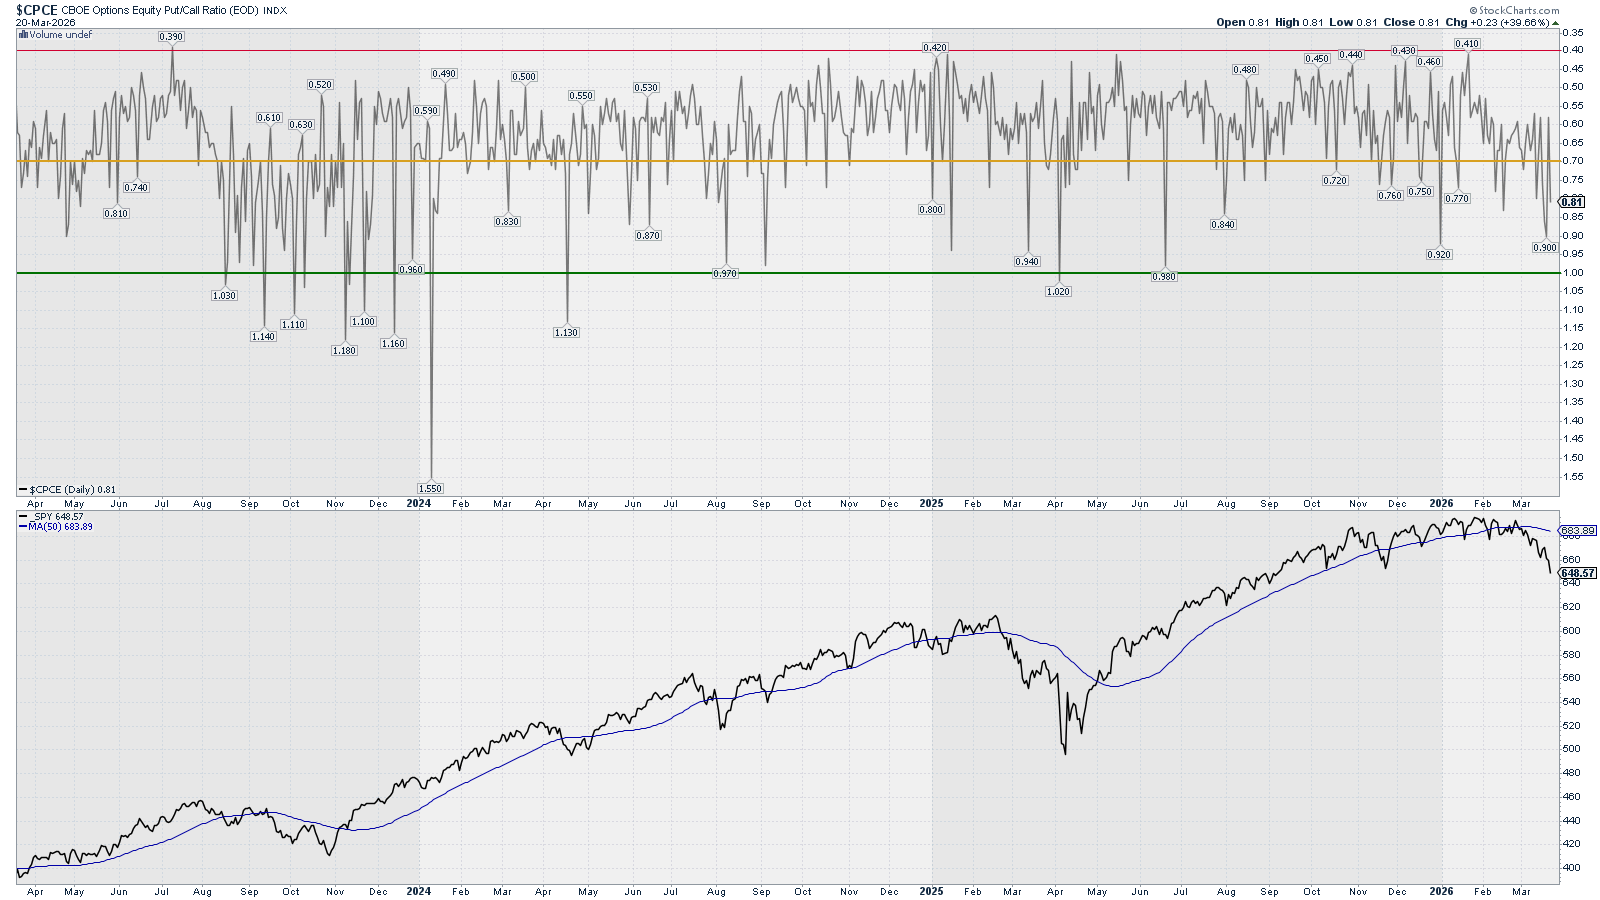
Analysis: P/C ratio in middle ground. Not too bearish not too bullish. Observe that from the peak on the 22nd of January, the market couldn’t advance. We shall see an extreme low reading for us to mark a Bullish opportunity.
Outlook: Neutral (expect choppiness)
What is happening? – Level 2
Options: Gamma Exposure – SPX
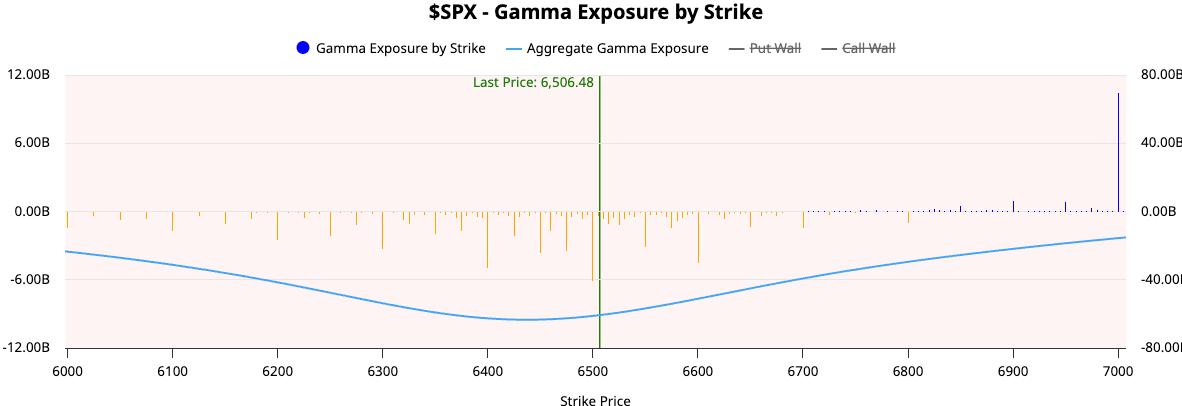
Analysis: In negative GEX. Expect higher volatility with rapid price movements.
Outlook: Neutral (expect choppiness)
Level 2 Summary
Price Action: Bearish
Breadth & Volatility: Bearish
Options: Neutral (expect choppiness)
What is happening? – Level 3
Bulls vs. Bears: RSP vs. RSPD (Cons. Disc. – Bulls) and RSPS (Cons. Sta. – Bears)
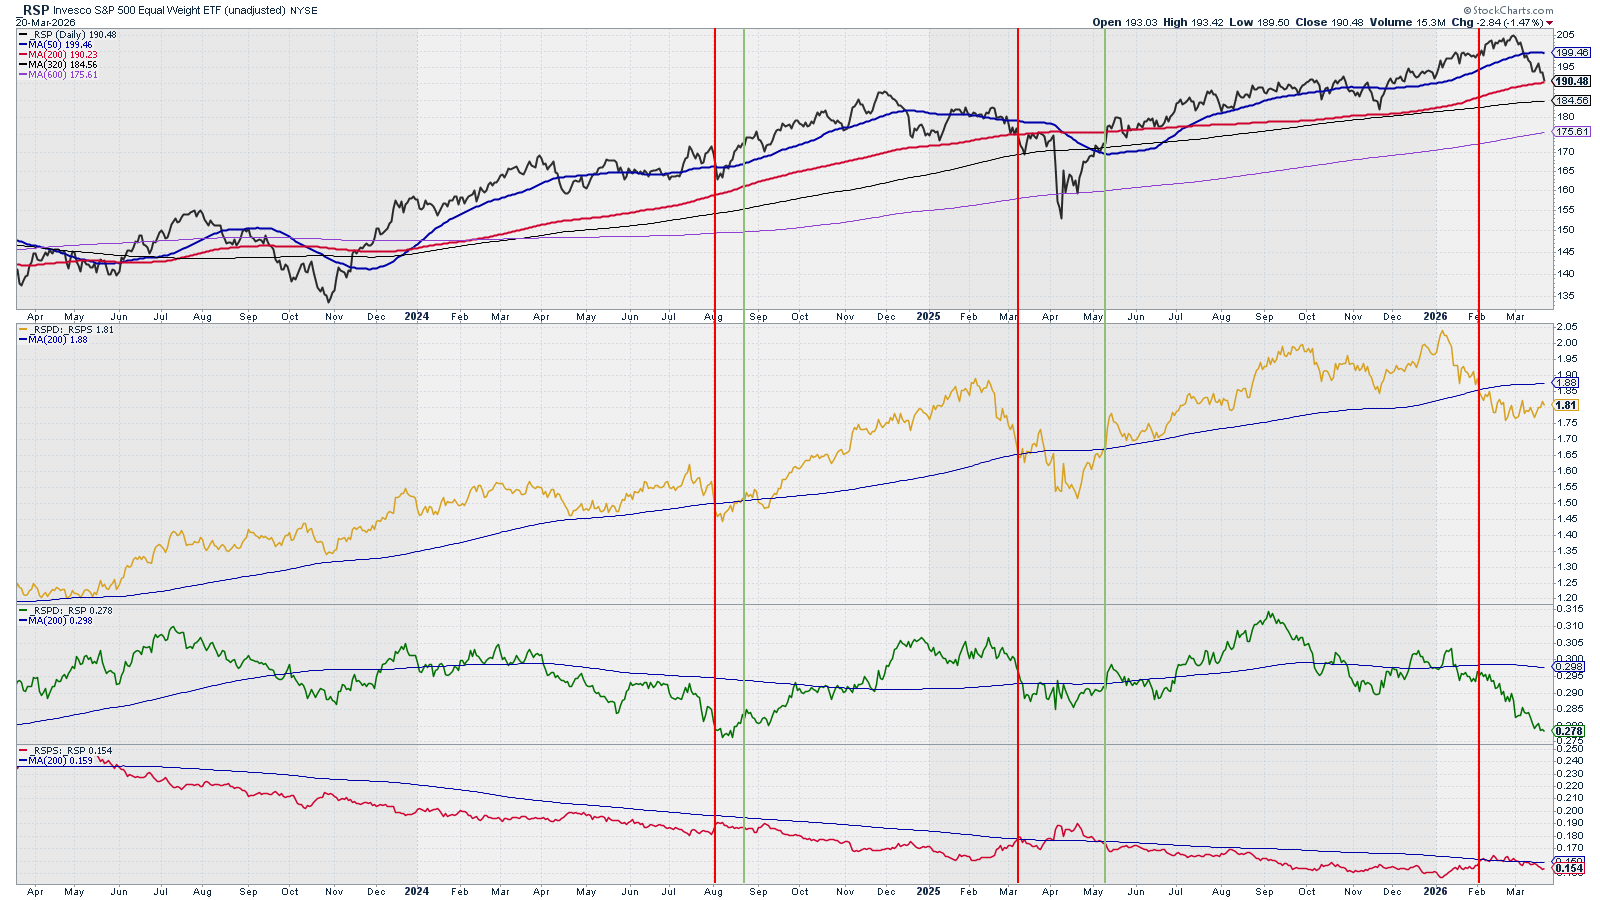
Analysis: Due to this week’s strong selling in XLP, XLRE, and XLU the “Bears”
Outlook: Bearish
What is happening? – Level 3
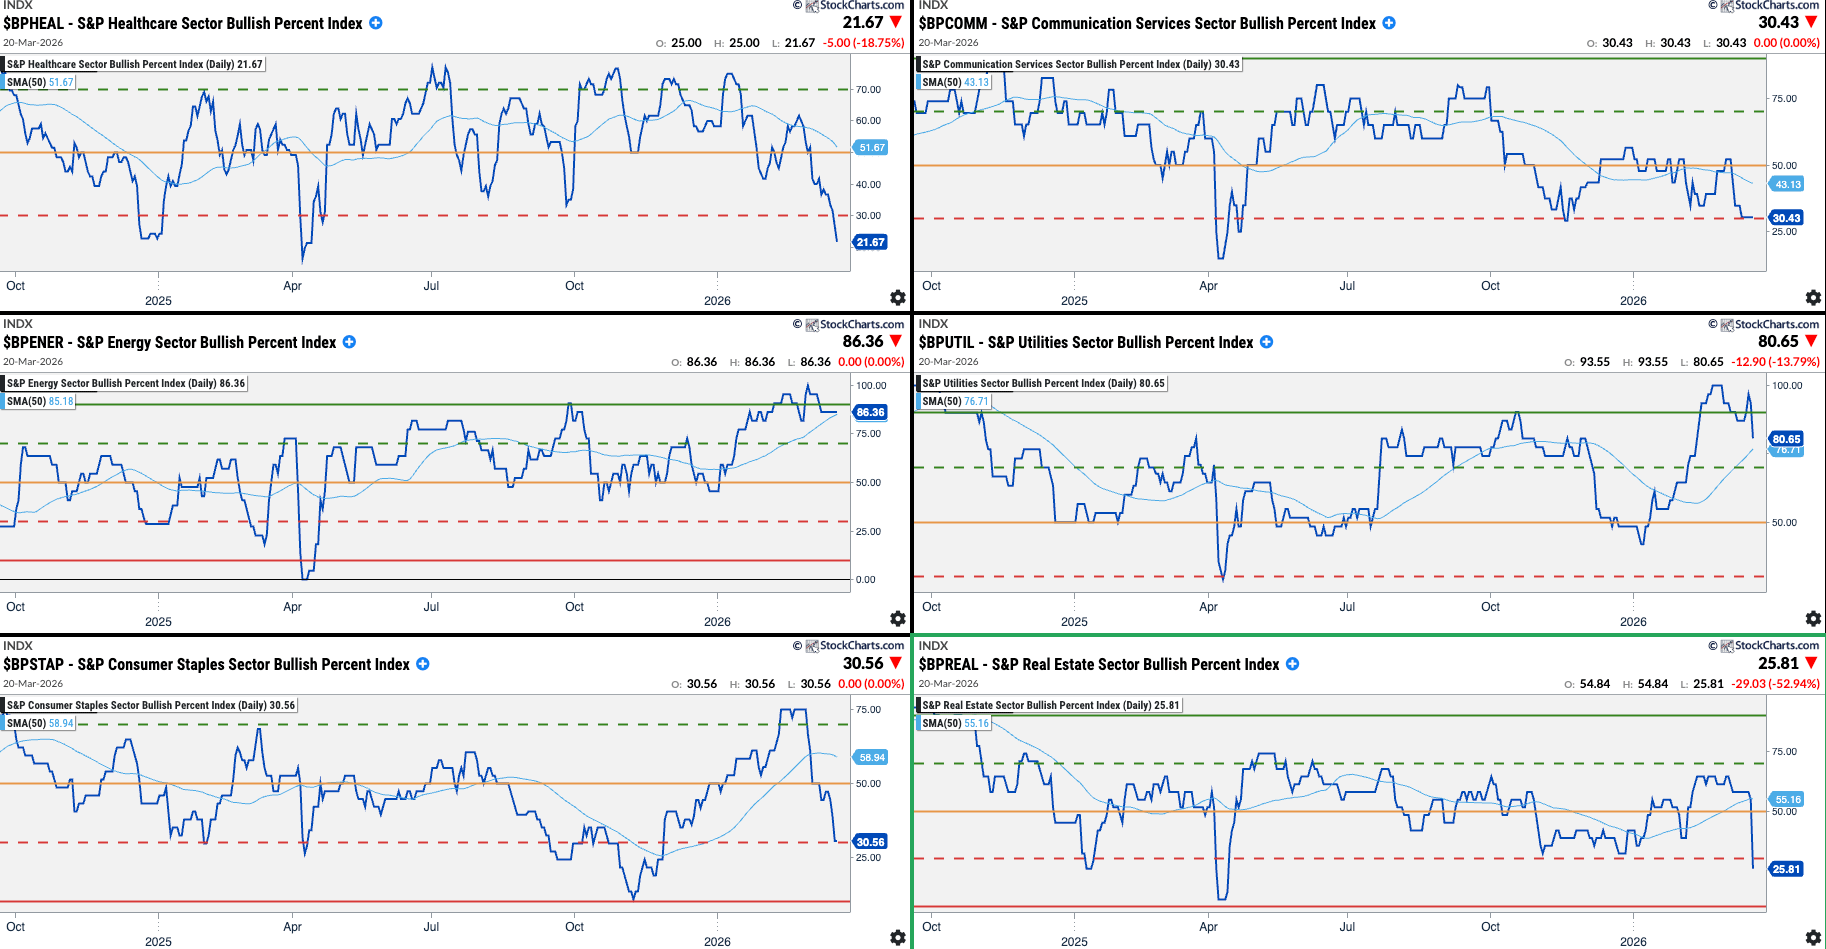
Sectors Rotation: Sectors Bullish Percent Index
Growth Sectors:
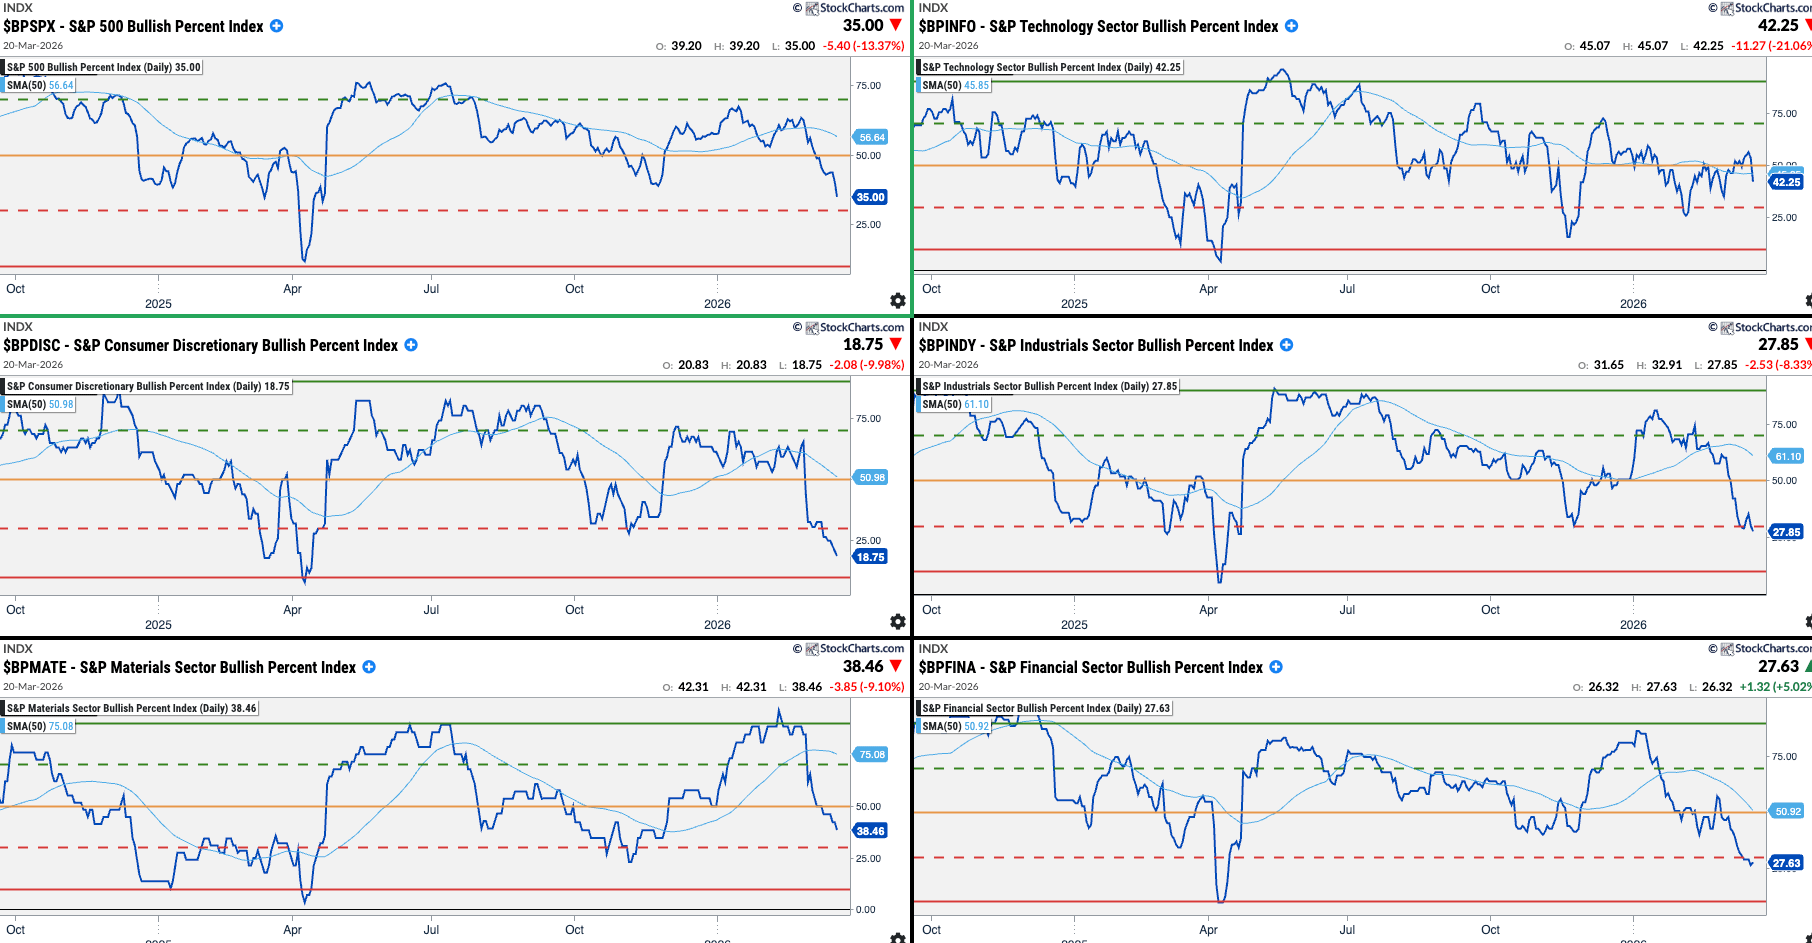
Value Sectors:
US Sectors order by ISM PMI Correlation (between parenthesis)
Growth Sectors - shall outperform when the market is bullish:
XLK: Technology (71%)
XLY: Cons. Discretionary (67%)
XLI: Industrials (66%)
XLB: Basic Materials (66%)
XLF: Financials (59%)
Value Sectors - shall outperform when the market is bearish:
XLV: Healthcare (55%)
XLC: Communications (49%)
XLE: Energy (44%)
XLU: Utilities (35%)
XLP: Cons. Staples (30%)
XLRE: Real Estate (16%)
Analysis:
Growth: All sectors are falling. Technology is holding quite well.
Value: All sectors are falling except Energy. Sharp falls in Healthcare, Staples, and Real State.
We are still far from any extreme positioning but those sharp falls in Value sectors may anticipate a sharp recovery into Value sectors. Is a V-shaped recovery brewing?
Outlook: Bearish for both Growth and Value
Level 3 Summary
Bulls vs. Bears: Bearish
Sectors Rotation: Bearish for both Growth and Value
All Levels Summary and Final Thoughts
Level 1 Summary
Economic Data (long-term): Bullish to Neutral
USD & Interest Rates: Bearish
Investors Sentiment: Bearish
Level 2 Summary
Price Action: Bearish
Breadth & Volatility: Bearish
Options: Neutral (expect high choppiness)
Level 3 Summary
Bulls vs. Bears: Bearish
Sectors Rotation: Bearish for both Growth and Value
Final Thoughts
Dominant Narrative: Iran’s war and the impact of supply destruction
The war has moved from supply disruption (closing the strait of Hormuz) to supply destruction by Iran successfully impacting Qatar, Kuwait, Saudi, and UAE’s gas and oil plants. The impact in Qatar’s Ras Laffan plant will reduce Qatar’s LNG output on a 17% and take at least 5 years to be rebuilt.
This supply destruction will imply higher for longer energy prices for all importing economies (mainly Europe and Asia). These economies could then export inflation to the rest of the world. Their companies will see margins squeezed and by exporting inflation the same will eventually happen to US companies.
In trading terms it means that EEM economies growth will be impacted as you can see already on the index price action. The longer this war goes the more deterioration we will see, which could be further magnified if more supply gets destroyed.
There is a secondary narrative, the private credit crisis. I don’t expect this crisis to have a major impact on the Financial sector, as markets have overreacted to the withdrawal cap, which was already written in the contracts. It seems that nobody read the small print… Once there is more clarity on which lenders survive (maybe we could see some M&A), it could be a good idea to buy the strongest (MAIN?) and benefit from their elevated dividends.
Finally, our analysis doesn’t show any exhaustion bearish momentum, so markets could still trend lower for few more days or weeks, except if we get a political positive resolution to the war and the market responds with few positive sessions.
Disclaimer: The content on AMAT Investing is strictly for educational and learning purposes. The author is not a licensed financial advisor and holds no formal financial education. This post does not constitute professional financial advice. All investing involves risk of loss. Always conduct your own research and consult a licensed professional before making any investment decisions.