


US Cap. Weighted Sectors ordered by weekly performance (desc):
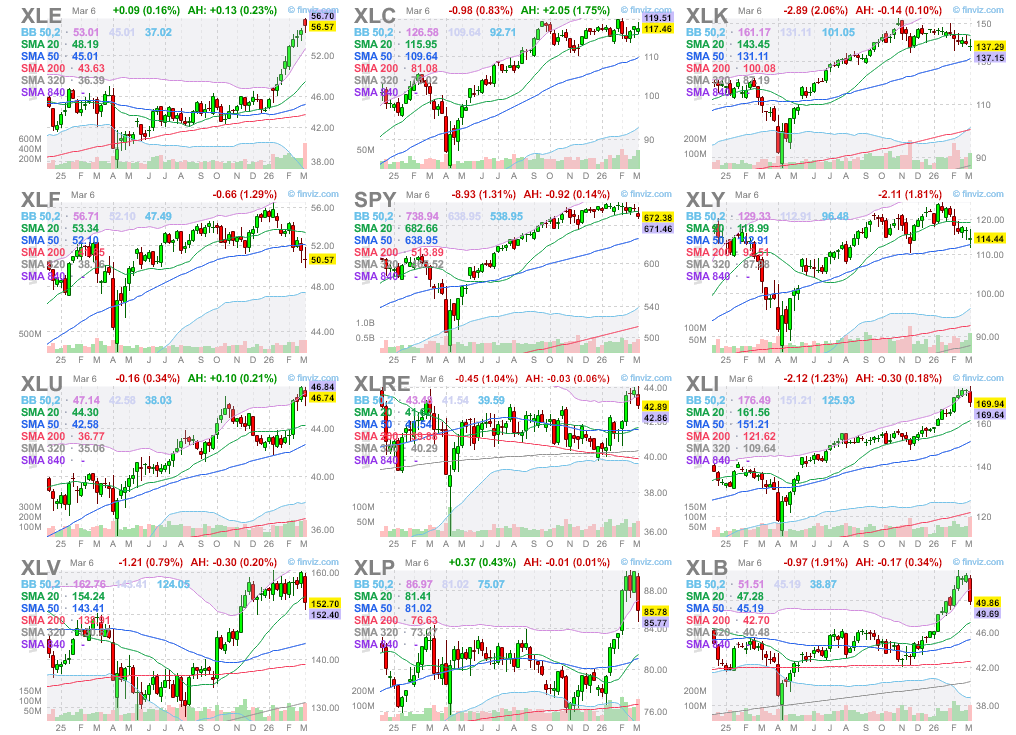
Comment: Historically, we’ve seen a reliable rotation where capital flows out of high-growth “risk-on” sectors like XLK, XLC, and XLY and into defensive “risk-off” plays like XLP, XLV, and XLU during times of friction.
However, current market behavior is breaking the mold. While we’re seeing the expected move into XLE (Energy) given the geopolitical impact on oil and gas from the conflict in Iran, the rest of the tape looks unusual. Money is largely staying put in tech and communications (XLK/XLC) while actually exiting traditional safe havens like healthcare and staples (XLV/XLP).
It raises a compelling question: is the market signaling a fundamental shift in what “safety” actually looks like, or is this just a temporary defiance of the historical playbook? Is this time really different?
Why is it happening? – Level 1
Economic Data: Production: ISM PMI vs. SPX
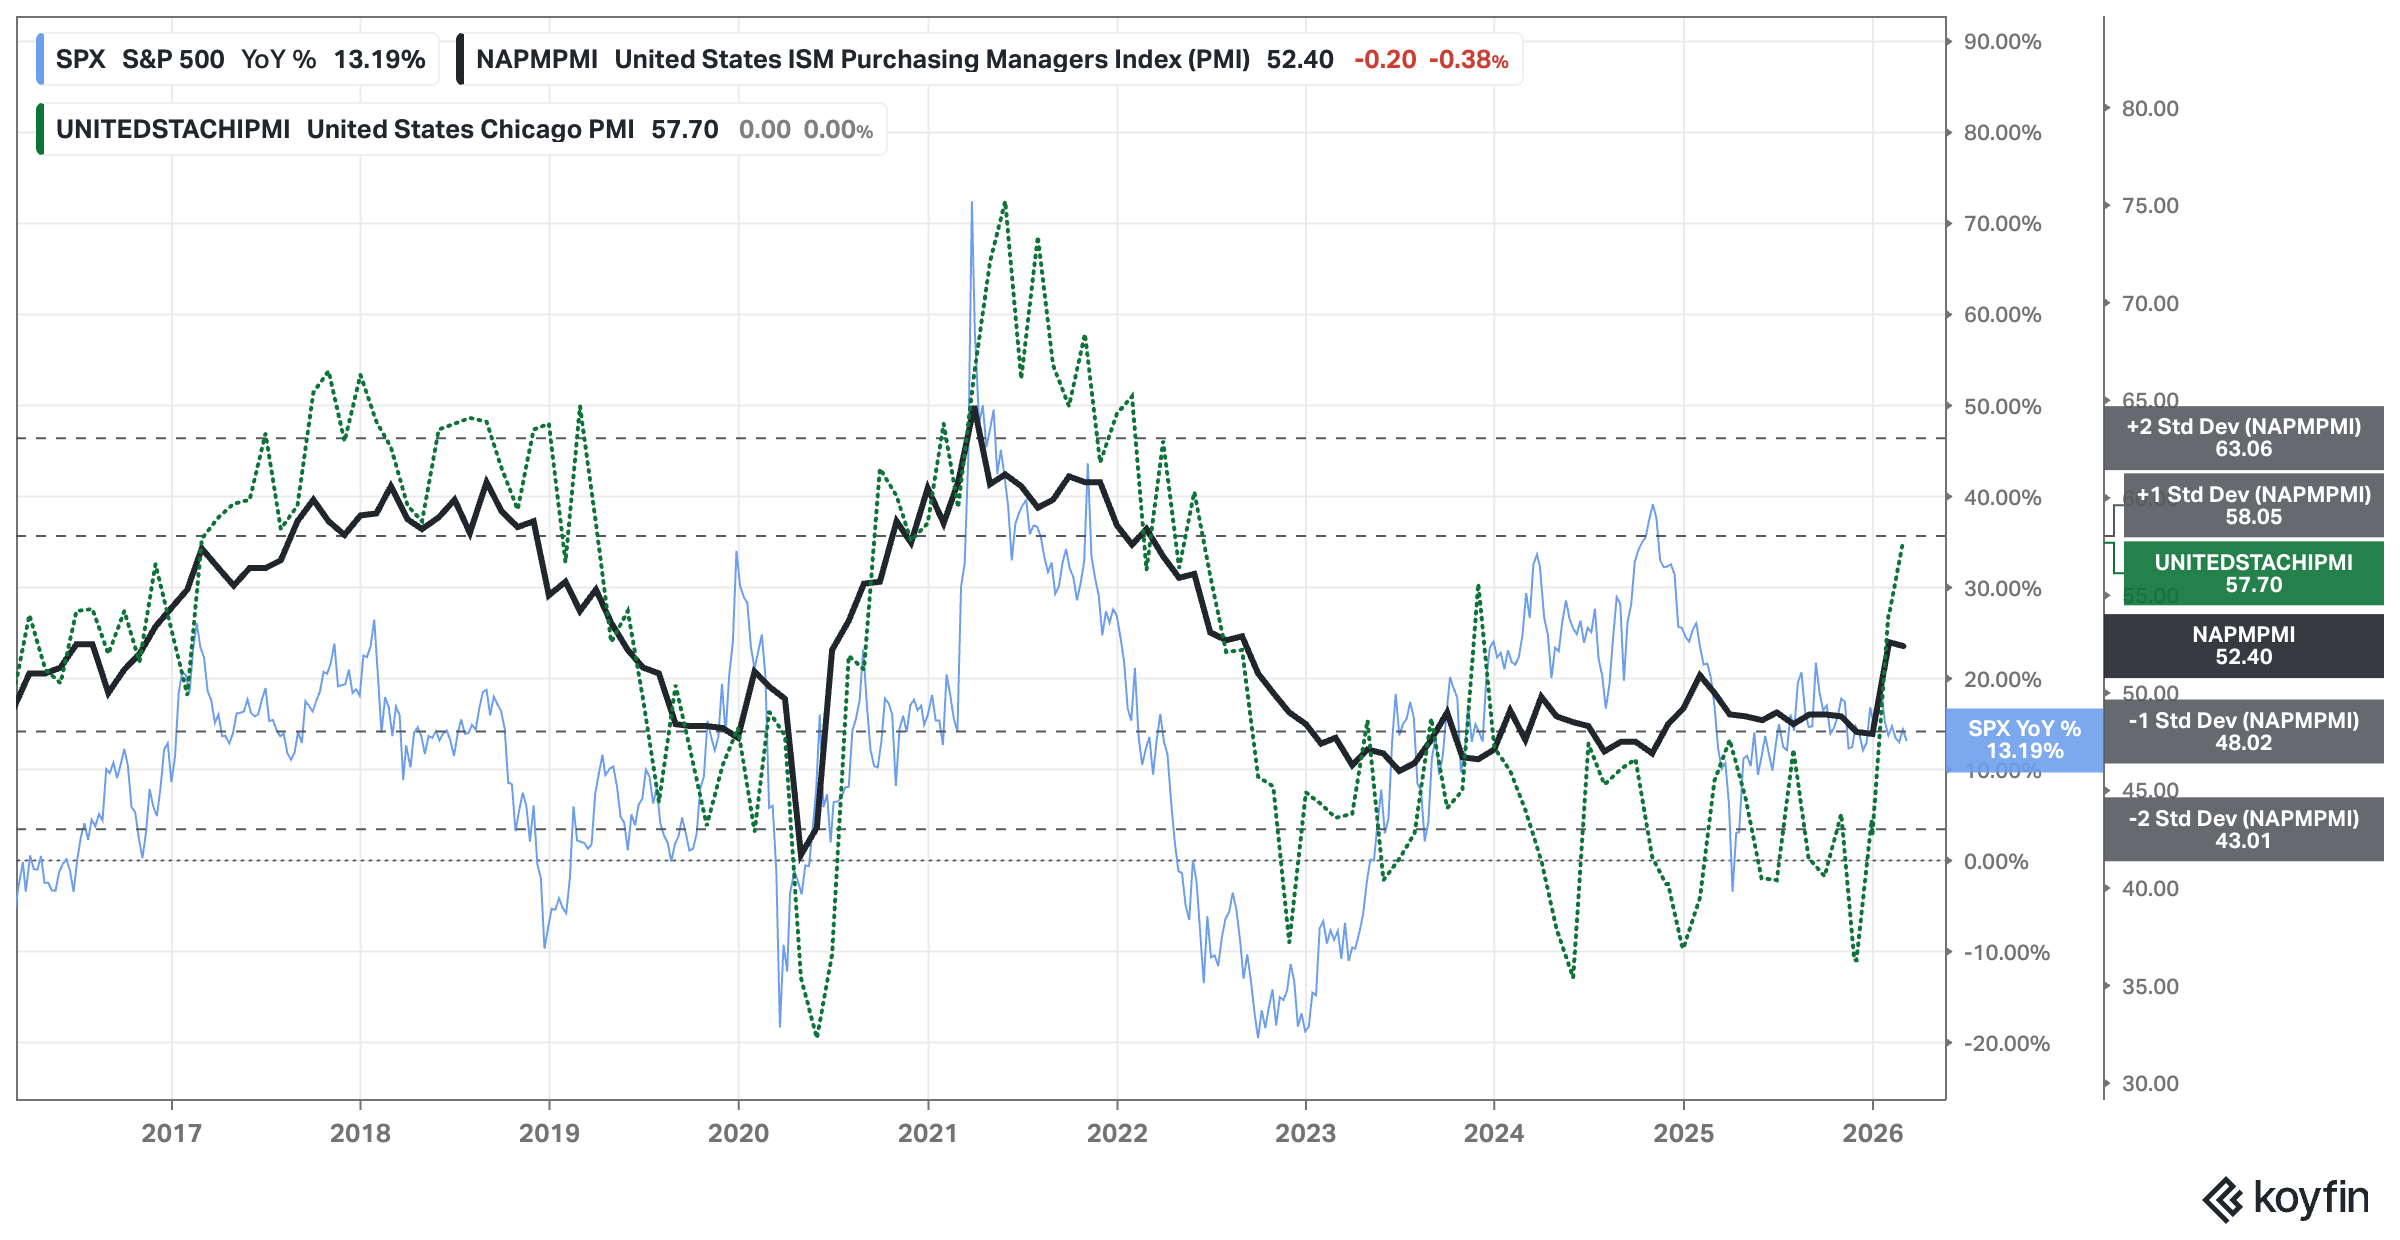
Analysis: No changes since last week. Chicago PMI surprised on the upside.
Outlook: Bullish
Why is it happening? – Level 1
Economic Data: Production: Dallas & Philadelphia Manufacturing vs. SPX
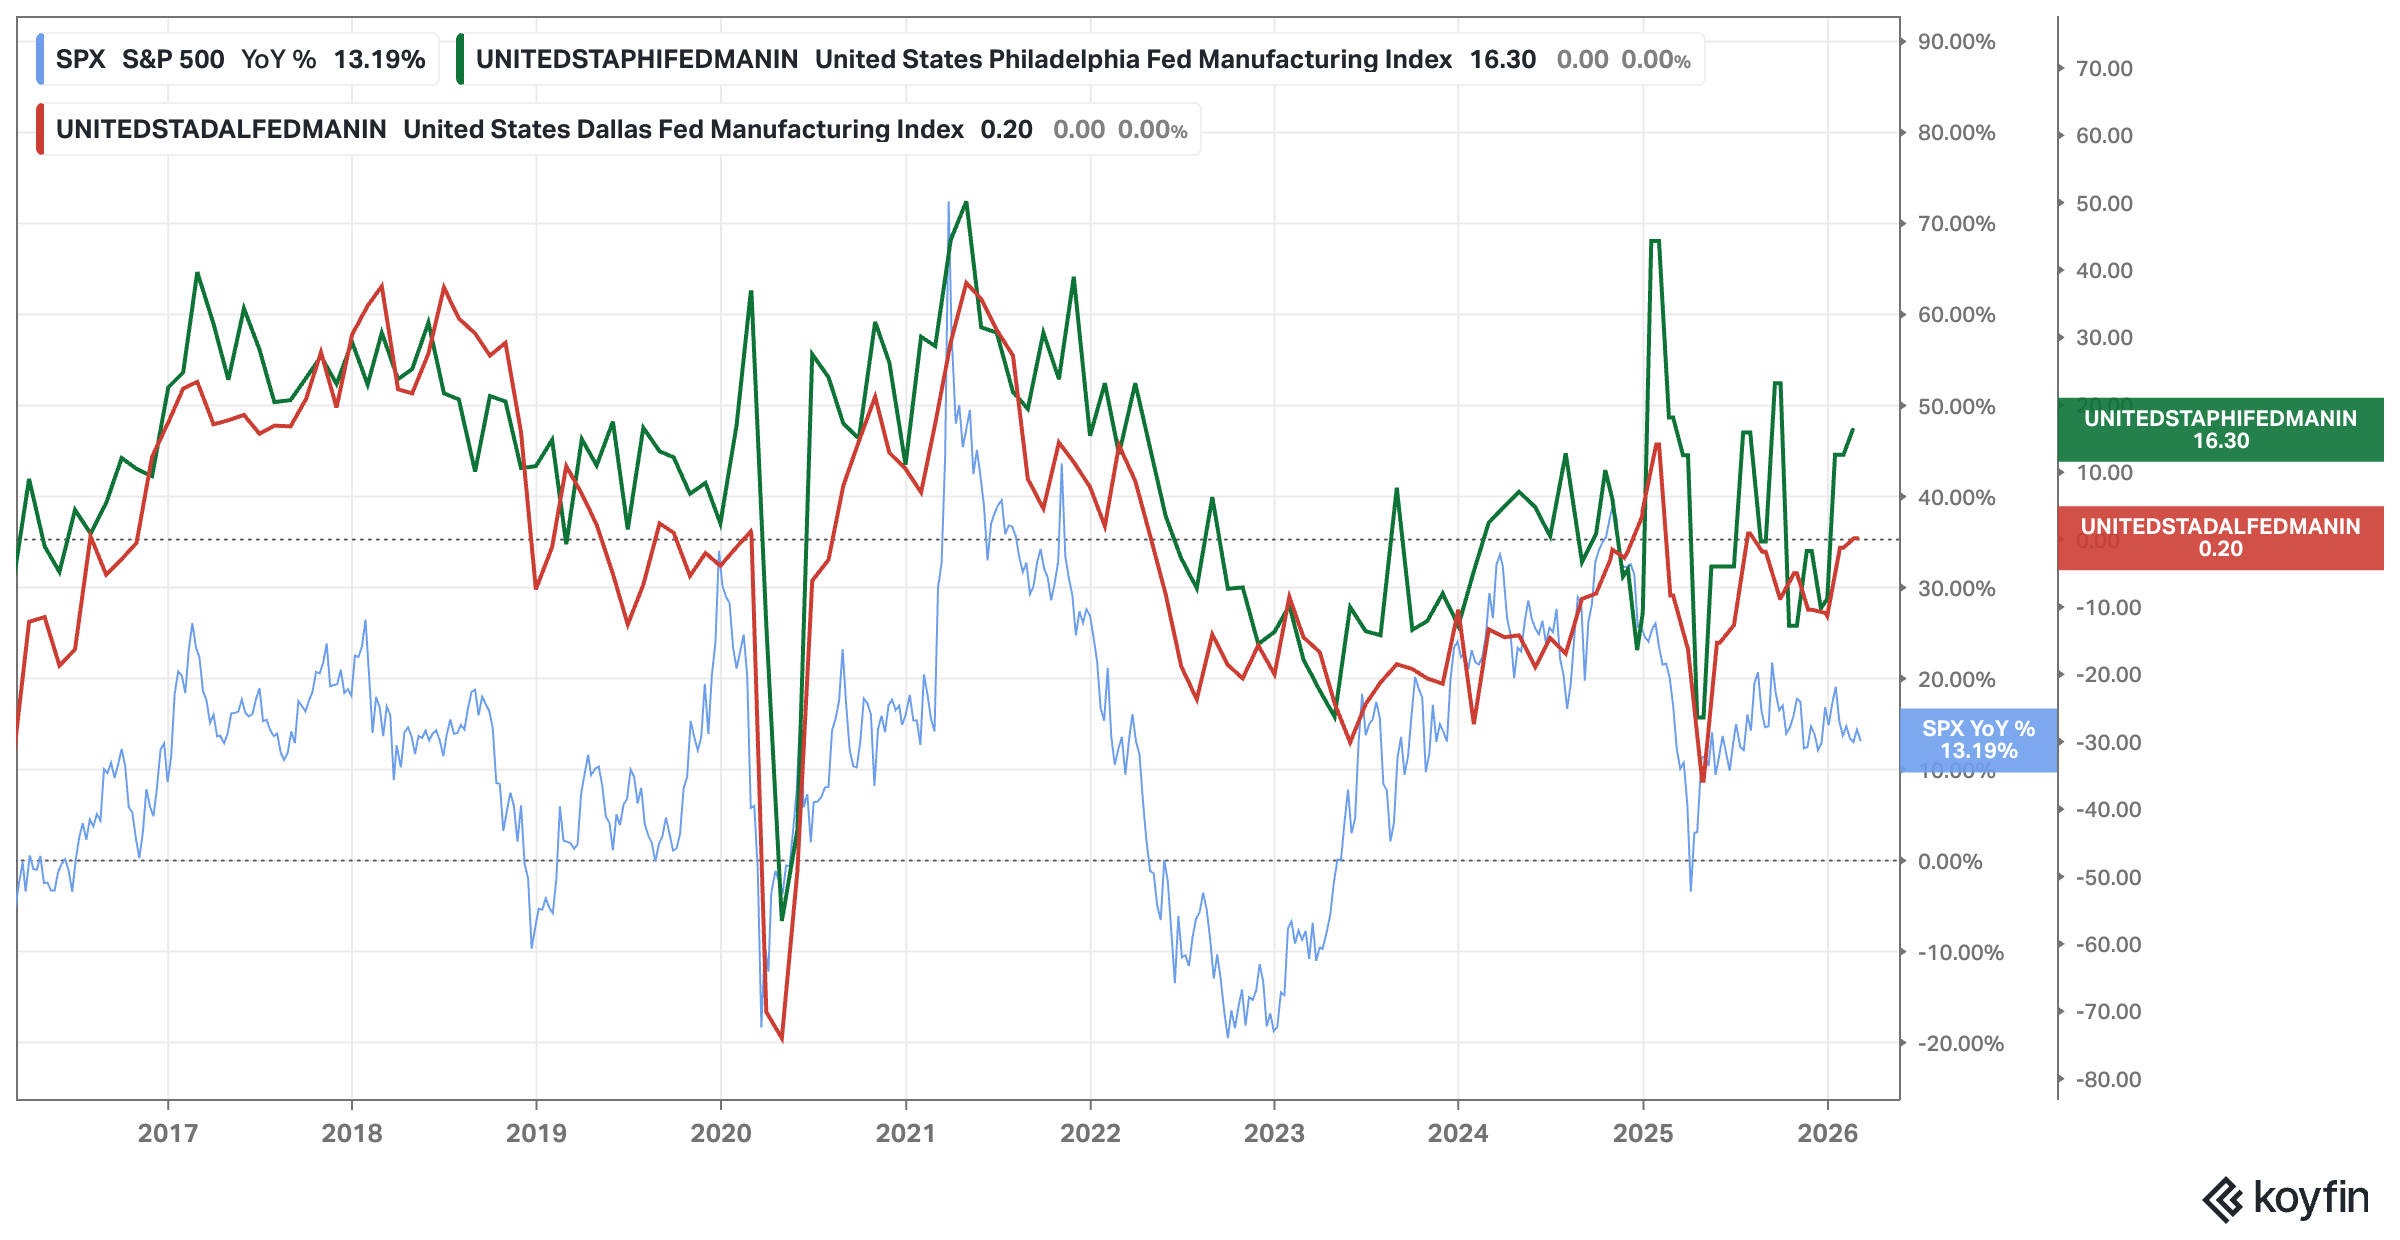
Analysis: No changes since last week. Philadelphia and Dallas improving.
Outlook: Bullish
Why is it happening? – Level 1
Economic Data: Consumption: Consumer Sentiment
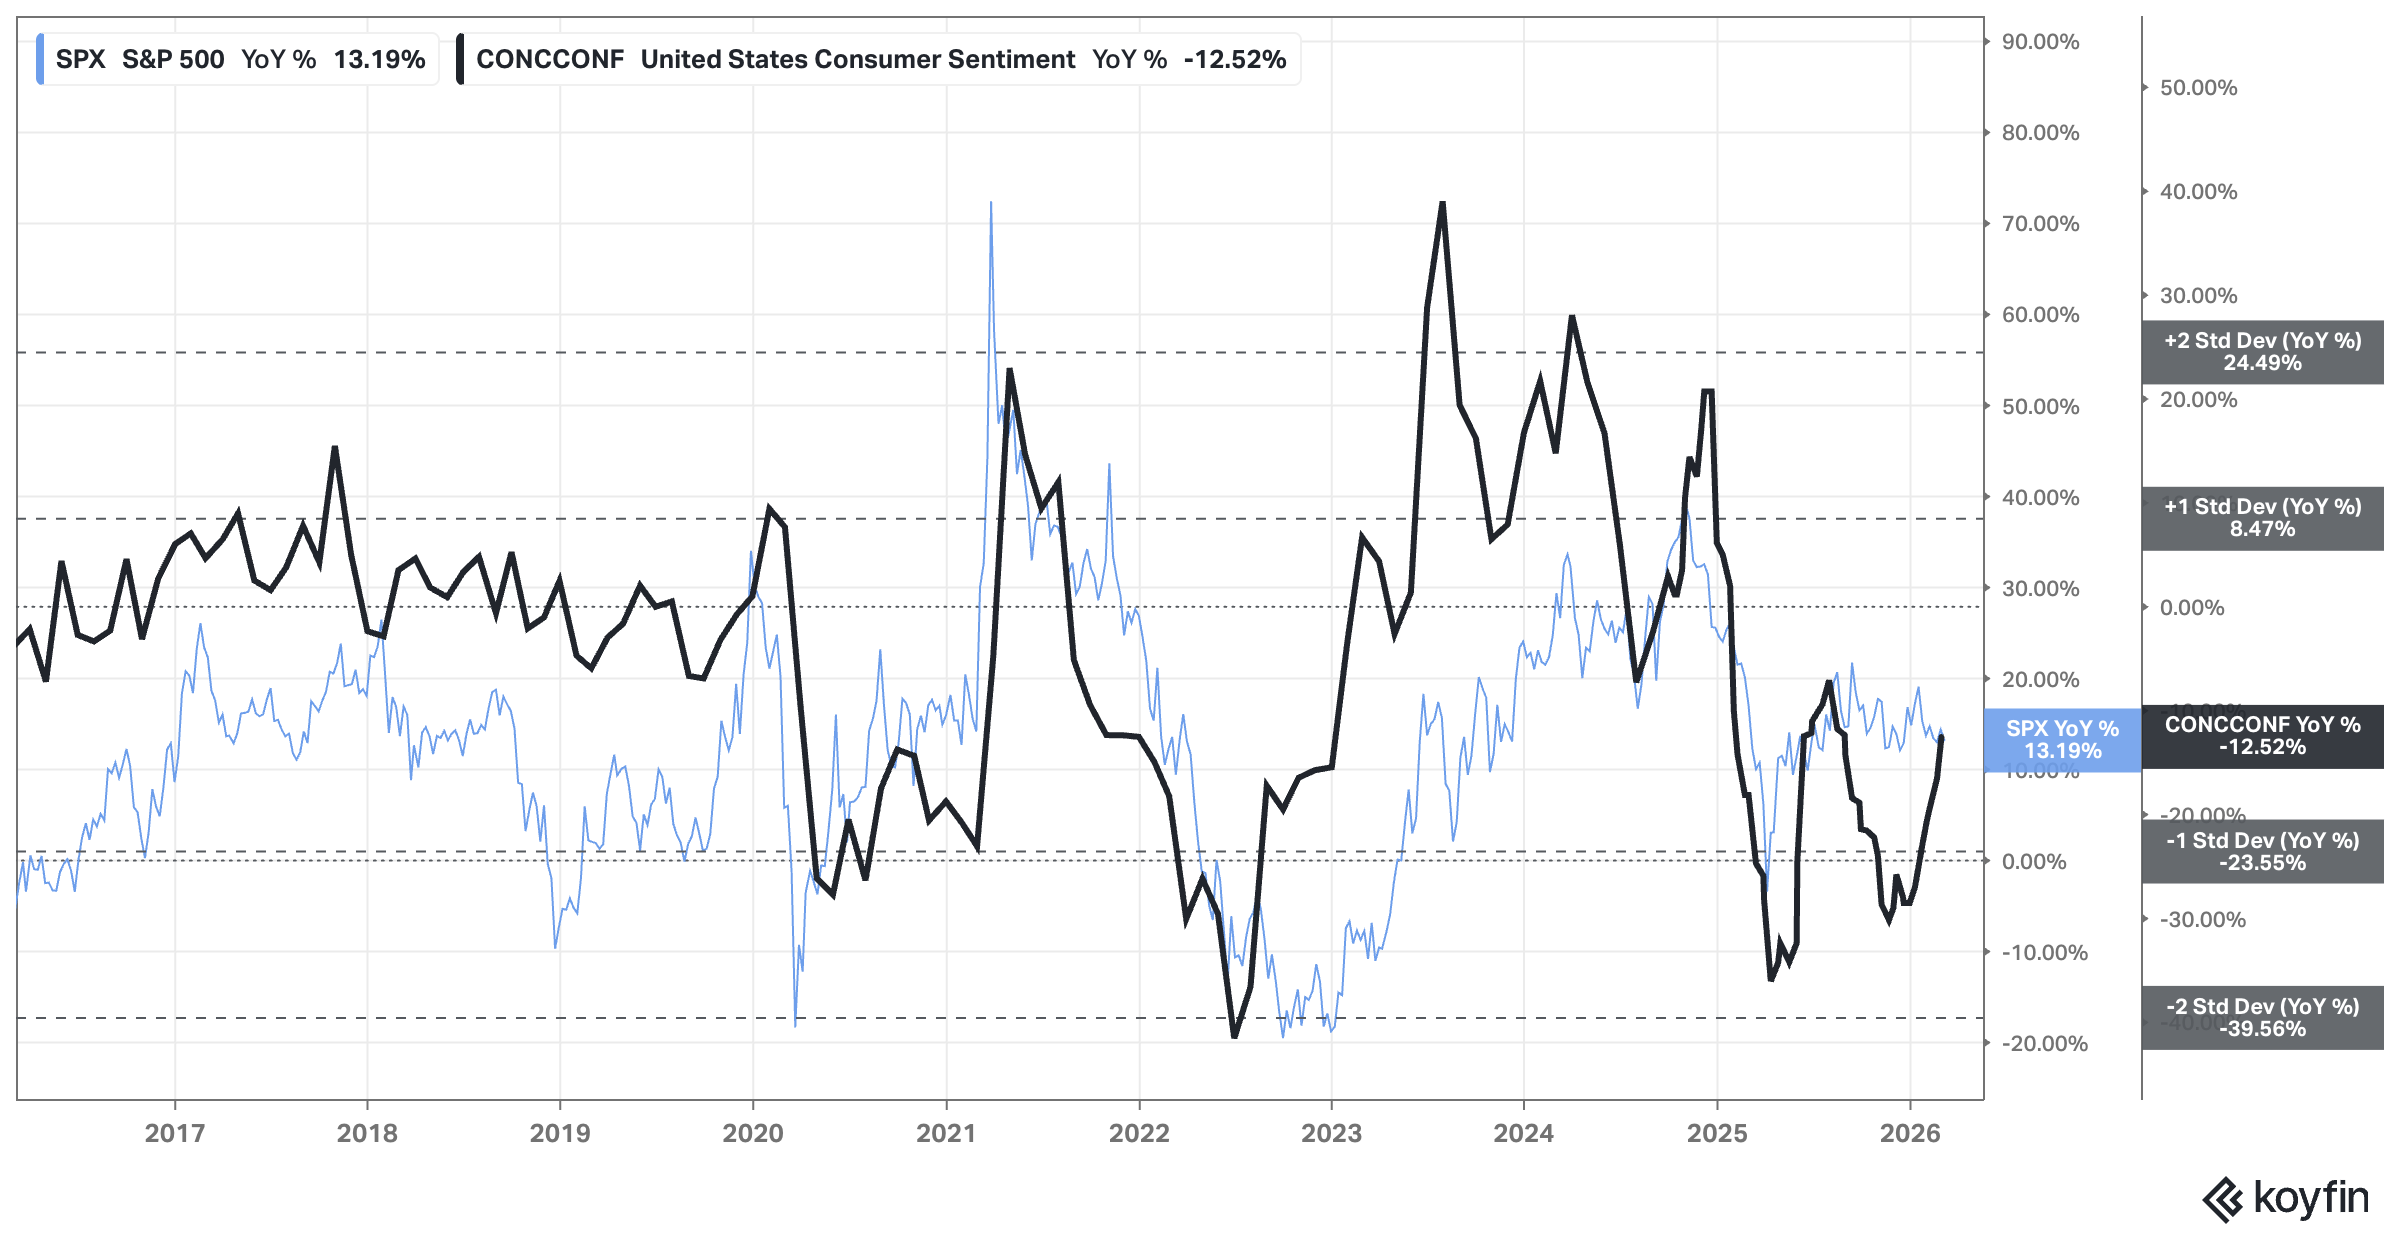
Analysis: No changes since last week. Consumer confidence keeps improving.
Outlook: Bullish
Why is it happening? – Level 1
USD & Interest Rates: FED, 2yr, and 10yr Rates
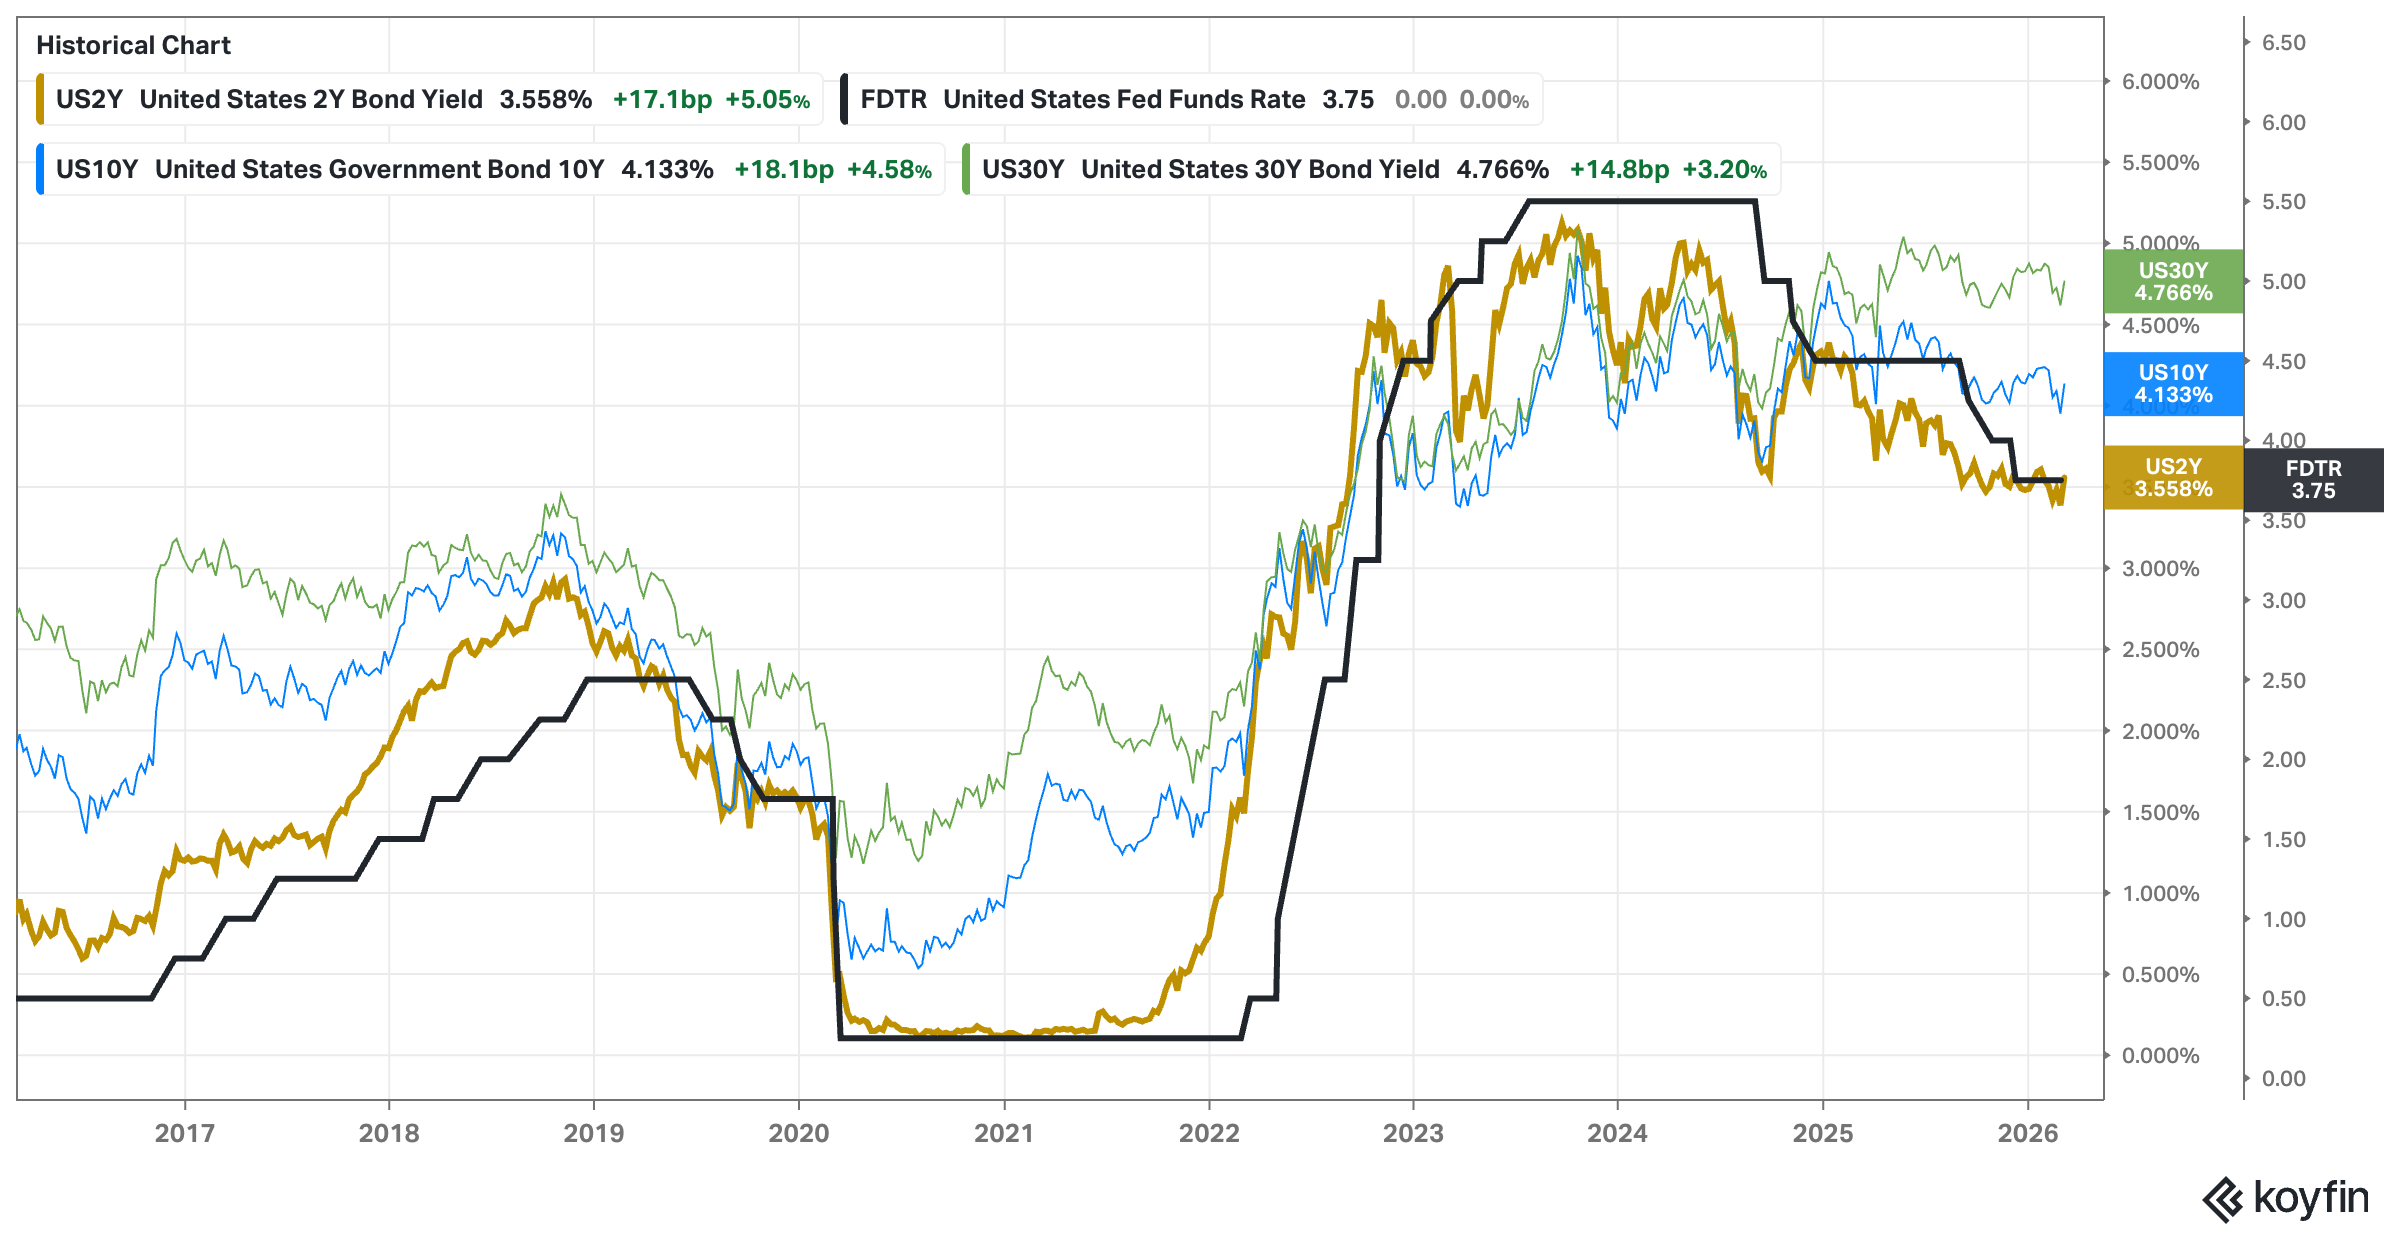
Analysis: Long-dated rates spiked higher due to the Iranian war.
Outlook: Depends on the war’s impact. Bullish for stocks (if rates continue going lower)
Why is it happening? – Level 1
USD & Interest Rates: USD vs EEM and S&P500
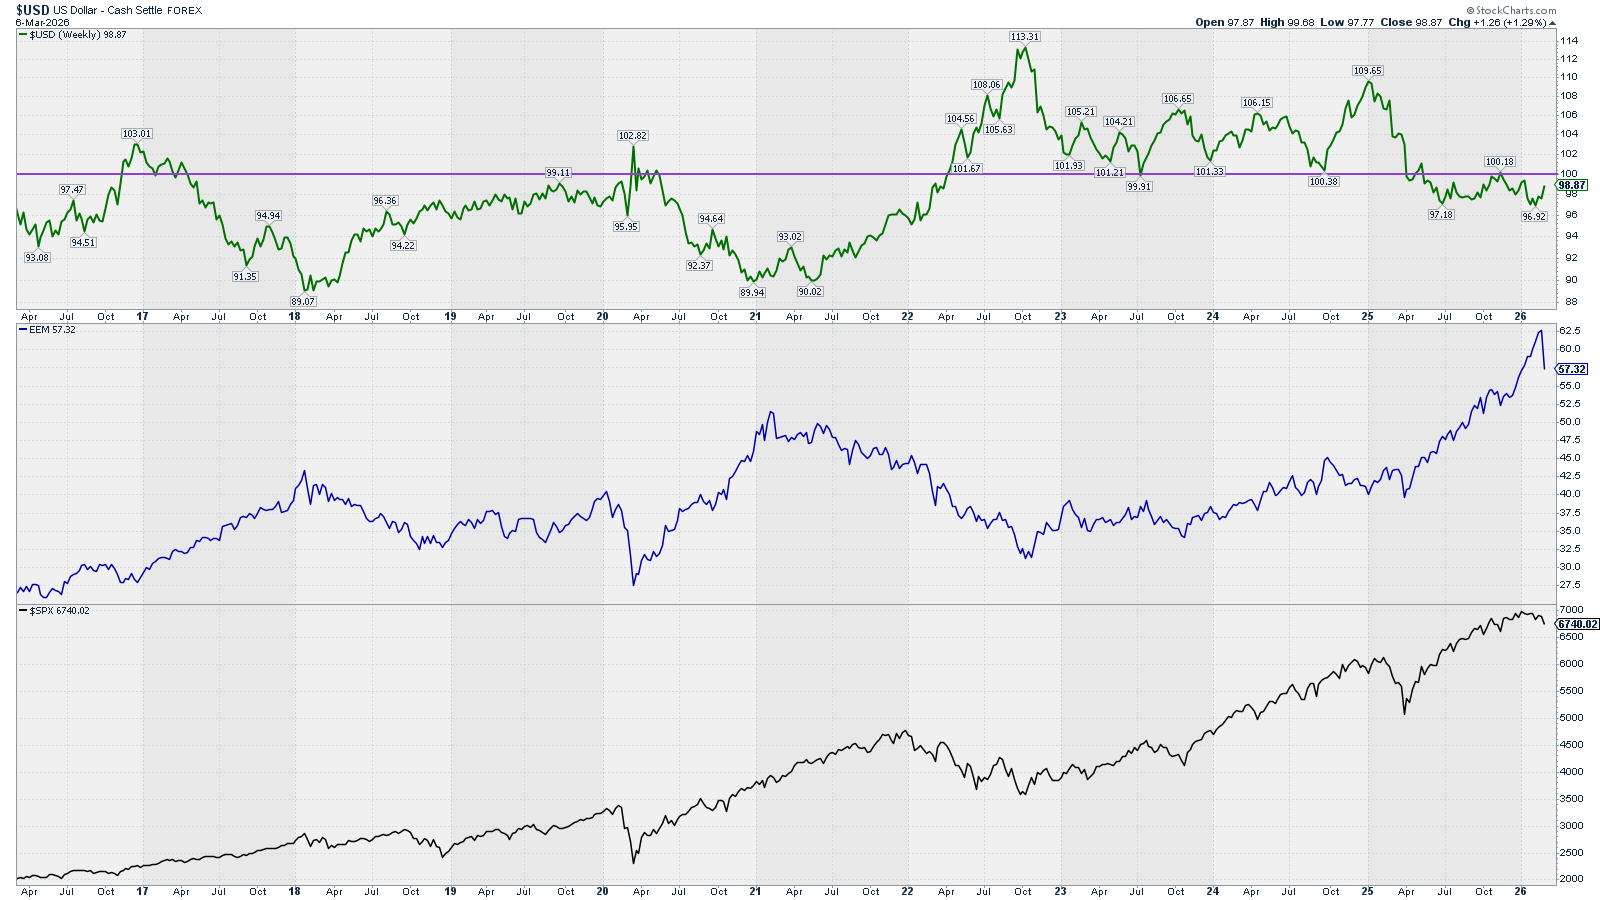
Analysis: The Iran war raised the USD and made EEM to fall sharply, as the impact on higher oil & gas prices will have a great impact on EEM.
Outlook: Bearish (as long as the war continues and oil & gas disruption is unknown)
Why is it happening? – Level 1
Context Investors Sentiment: Credit Spreads
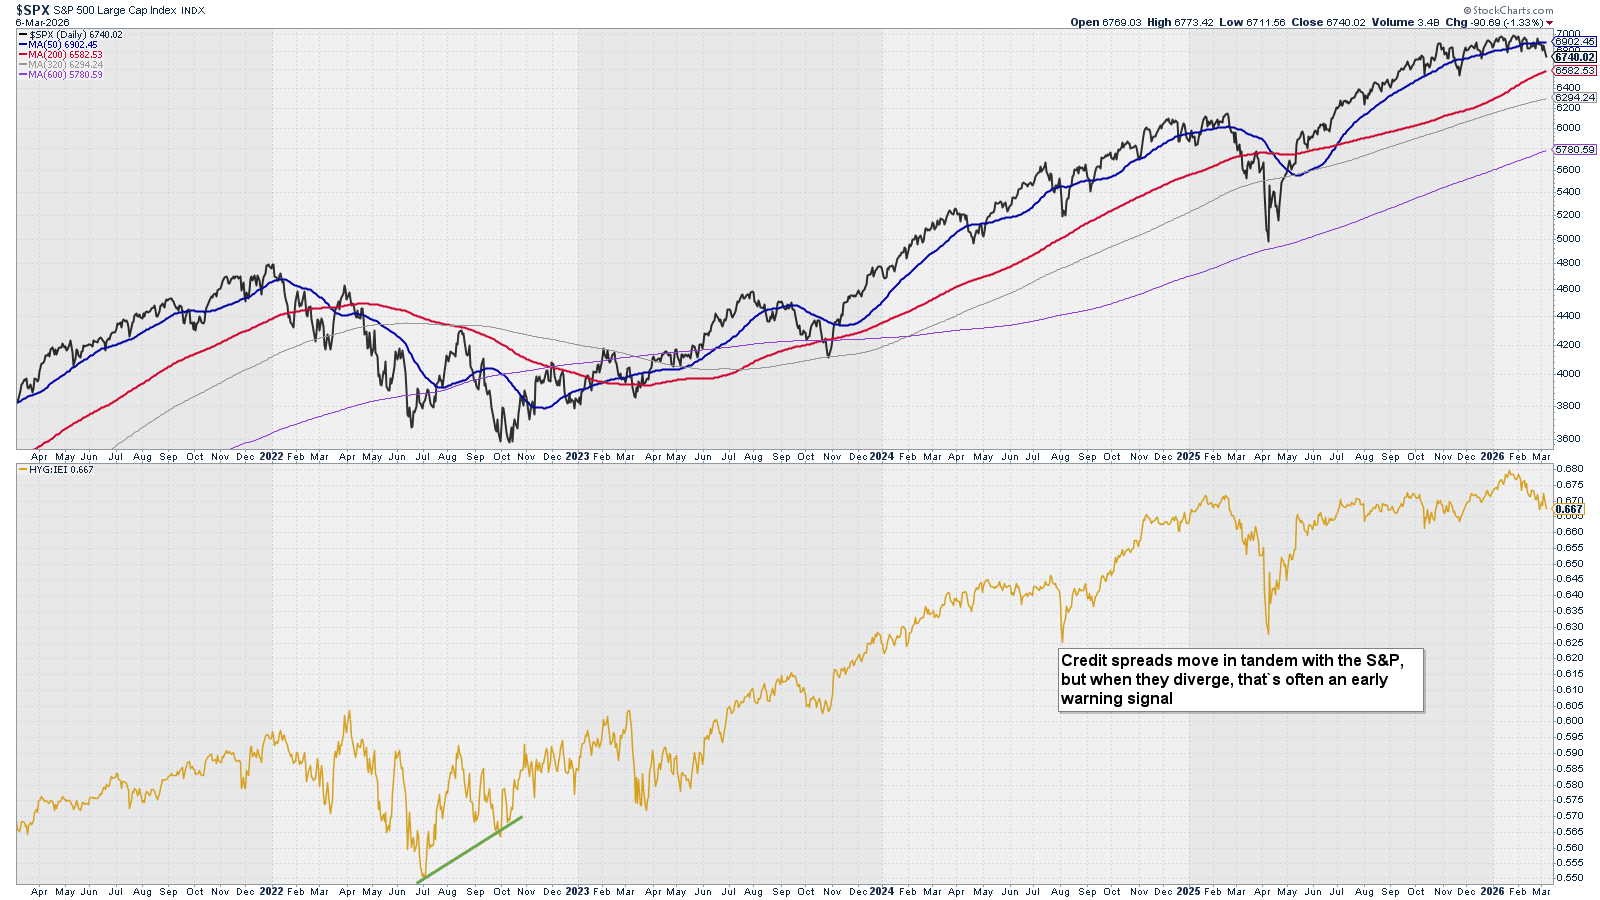
Credit spreads move in tandem with the S&P, but when they diverge, that’s often an early warning signal.
Analysis: Spreads (yellow line) trending lower.
Outlook: Bearish
Why is it happening? – Level 1
Investors Sentiment: AAII & NAAIM
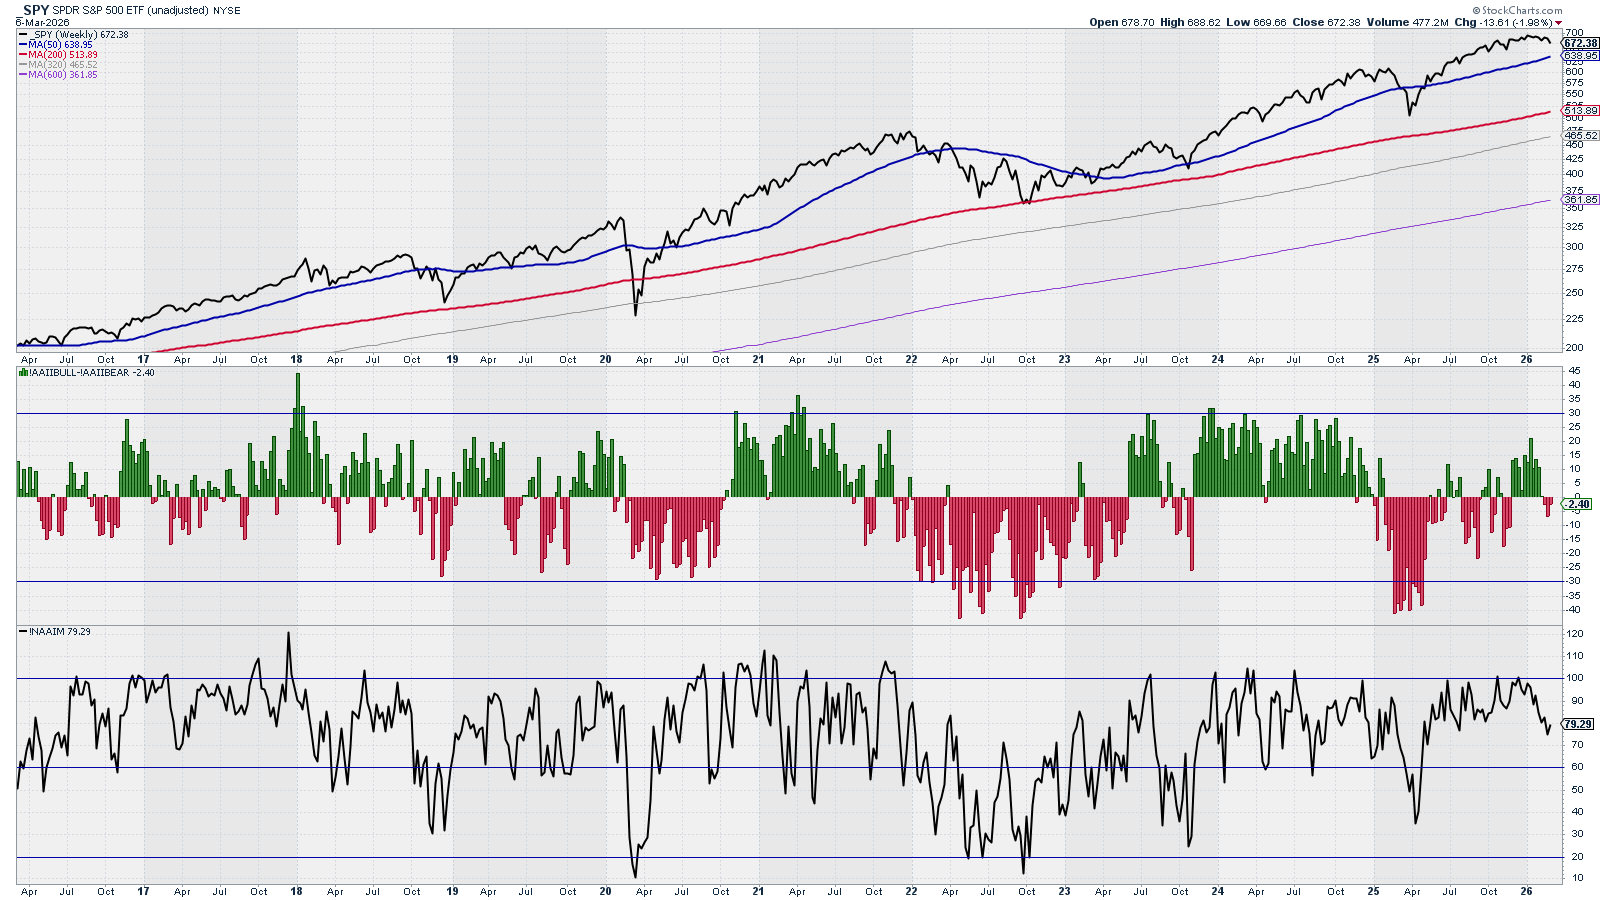
AAII (American Association of Individual Investors) represents the position of retail traders. NAAIM (National Association of Active Investment Managers) represents the position of professional traders. We will be looking to enter contrarian positions against AAII and NAAIM extremes. When these indicators are not in extremes, we shall position aligned with them.
Analysis: AAII just flipped to the bearish side. NAAIM trending lower from overbought level, still above mid-level. Note that even with the Iran war unfolding, there is no much bearish sentiment (yet?).
Outlook: Bearish
Level 1 Summary
Economic Data: Bullish
USD & Interest Rates: Bearish
Investors Sentiment: Bearish
What is happening? – Level 2
Price Action: SPX – Trend – 20 years
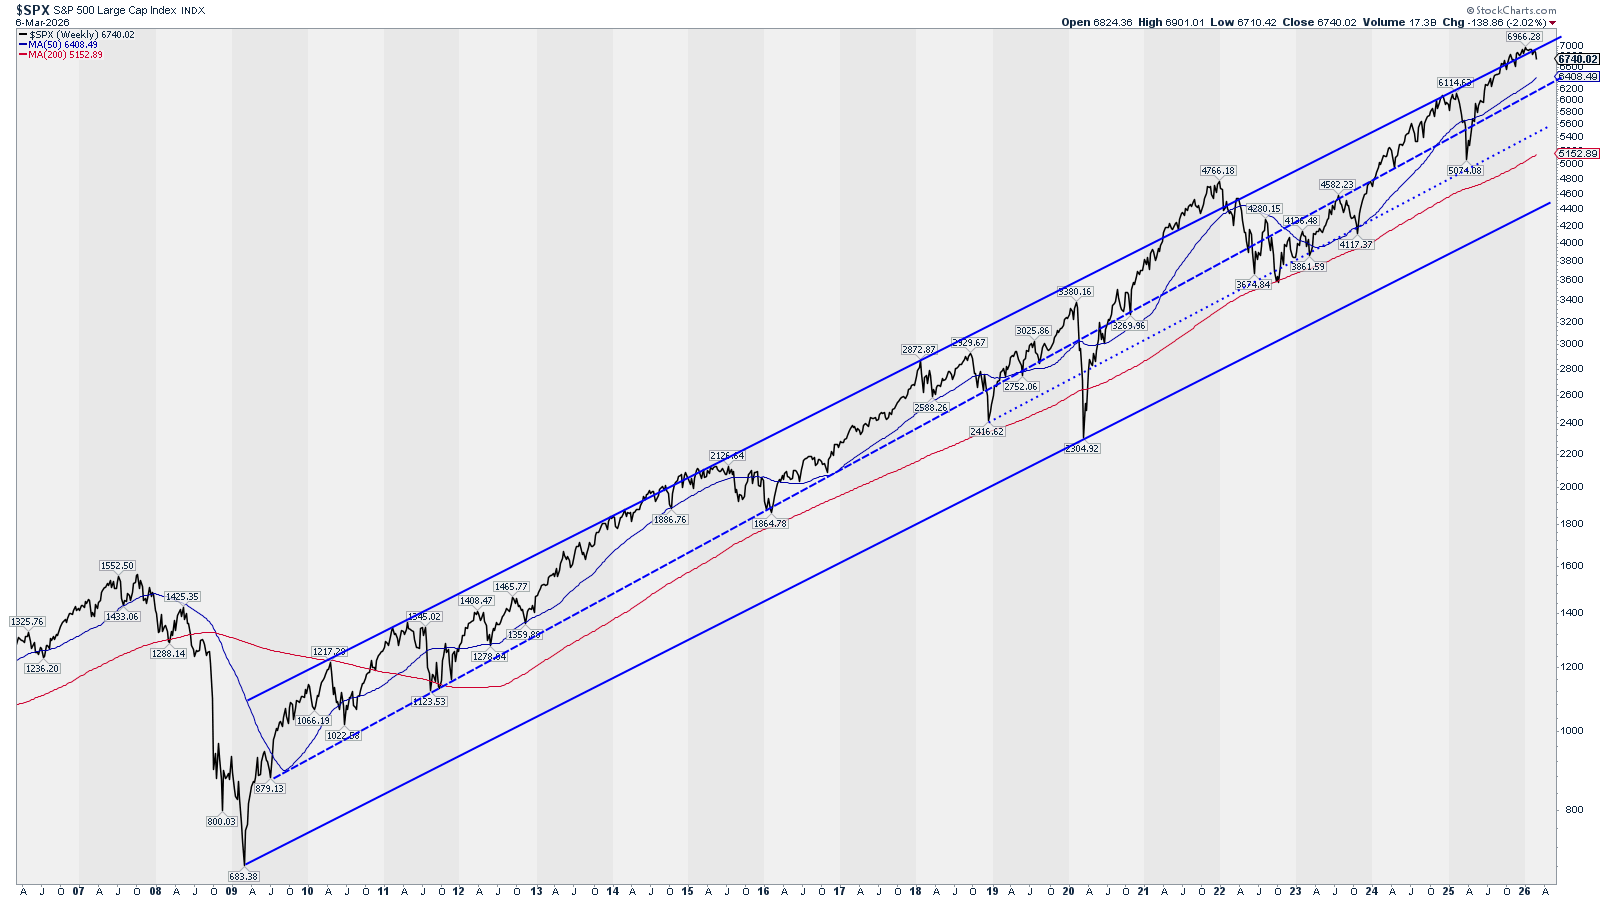
Analysis: Price on the upper channel of the last 20 years trend. This can slow down the uptrend or even cause a drop to bring price inside the long-term channel.
Outlook: Bearish
What is happening? – Level 2
Price Action: RSP – Trend – Weekly
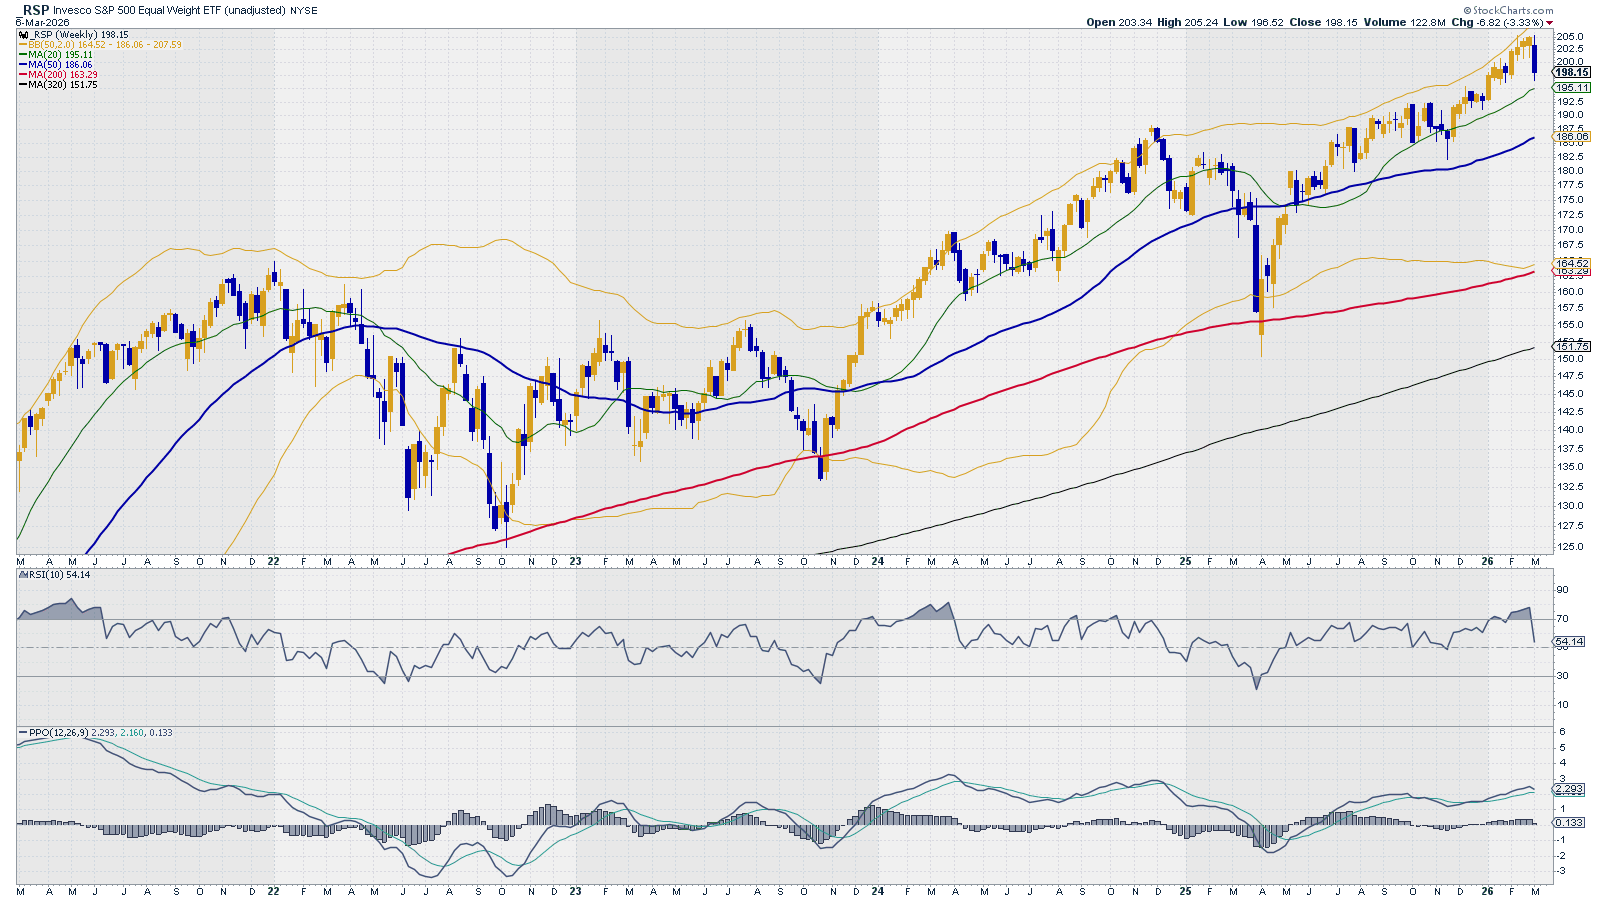
Analysis: Sharp decline in price and reversal on RSI and almost in PPO.
Outlook: Bearish
What is happening? – Level 2
Price Action: RSP – Trend – Daily
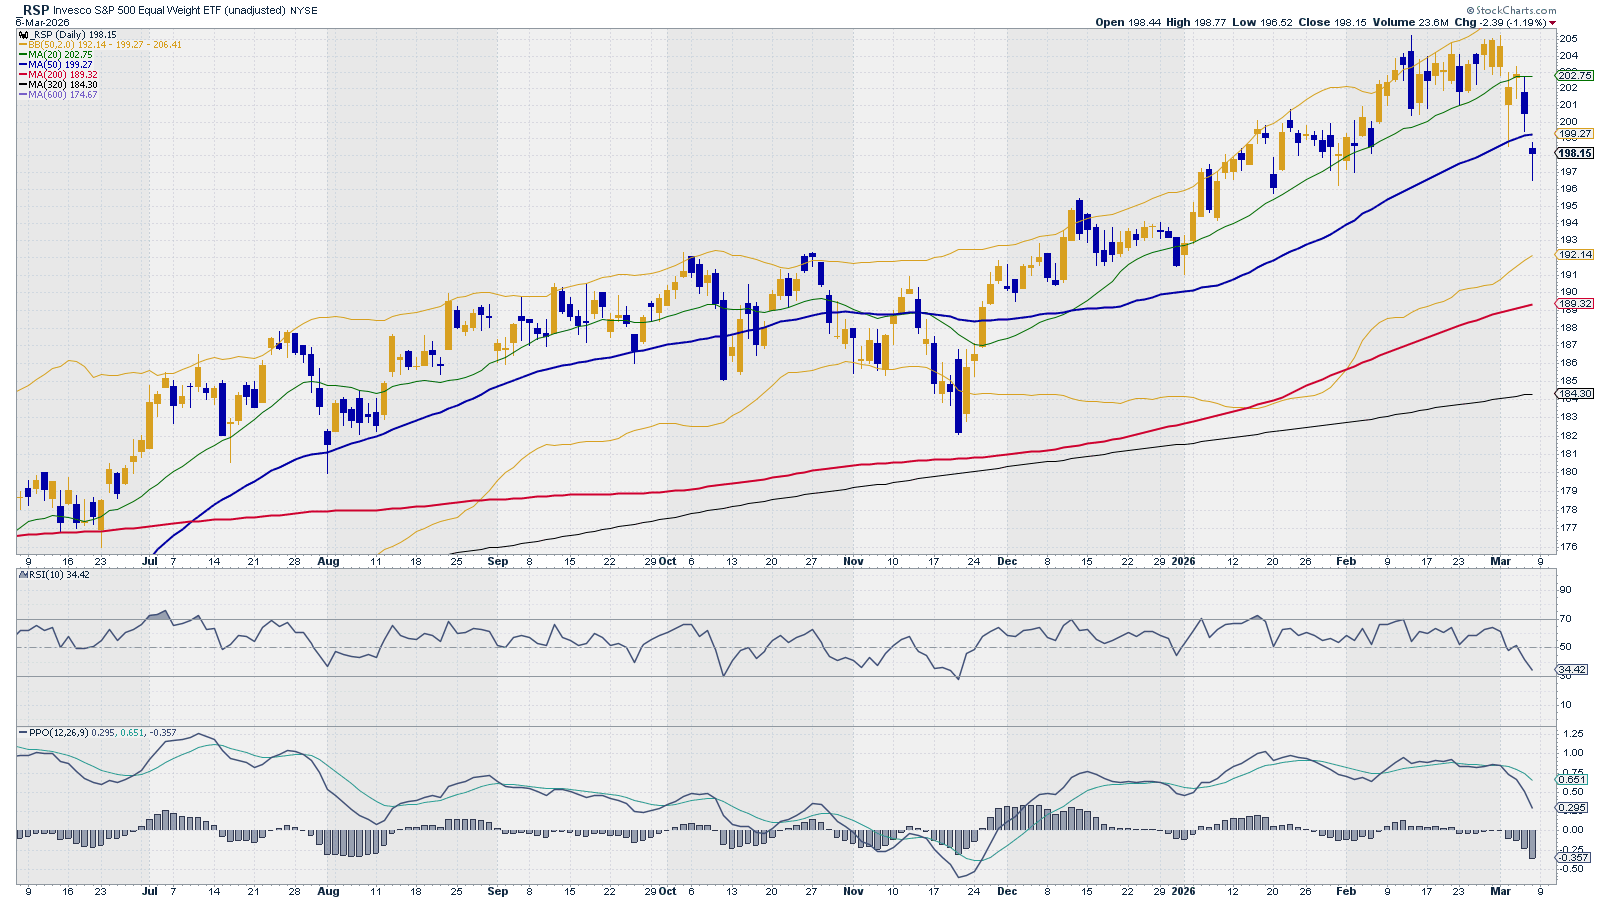
Analysis: Thursday and Friday took price below key support levels, falling below SMA 50. The next support would be the lower BB and SMA 200. Which will bring markets to levels similar to last year’s September.
Outlook: Bearish
What is happening? – Level 2
Breadth & Volatility: % Stocks above 200 SMA vs. RSP
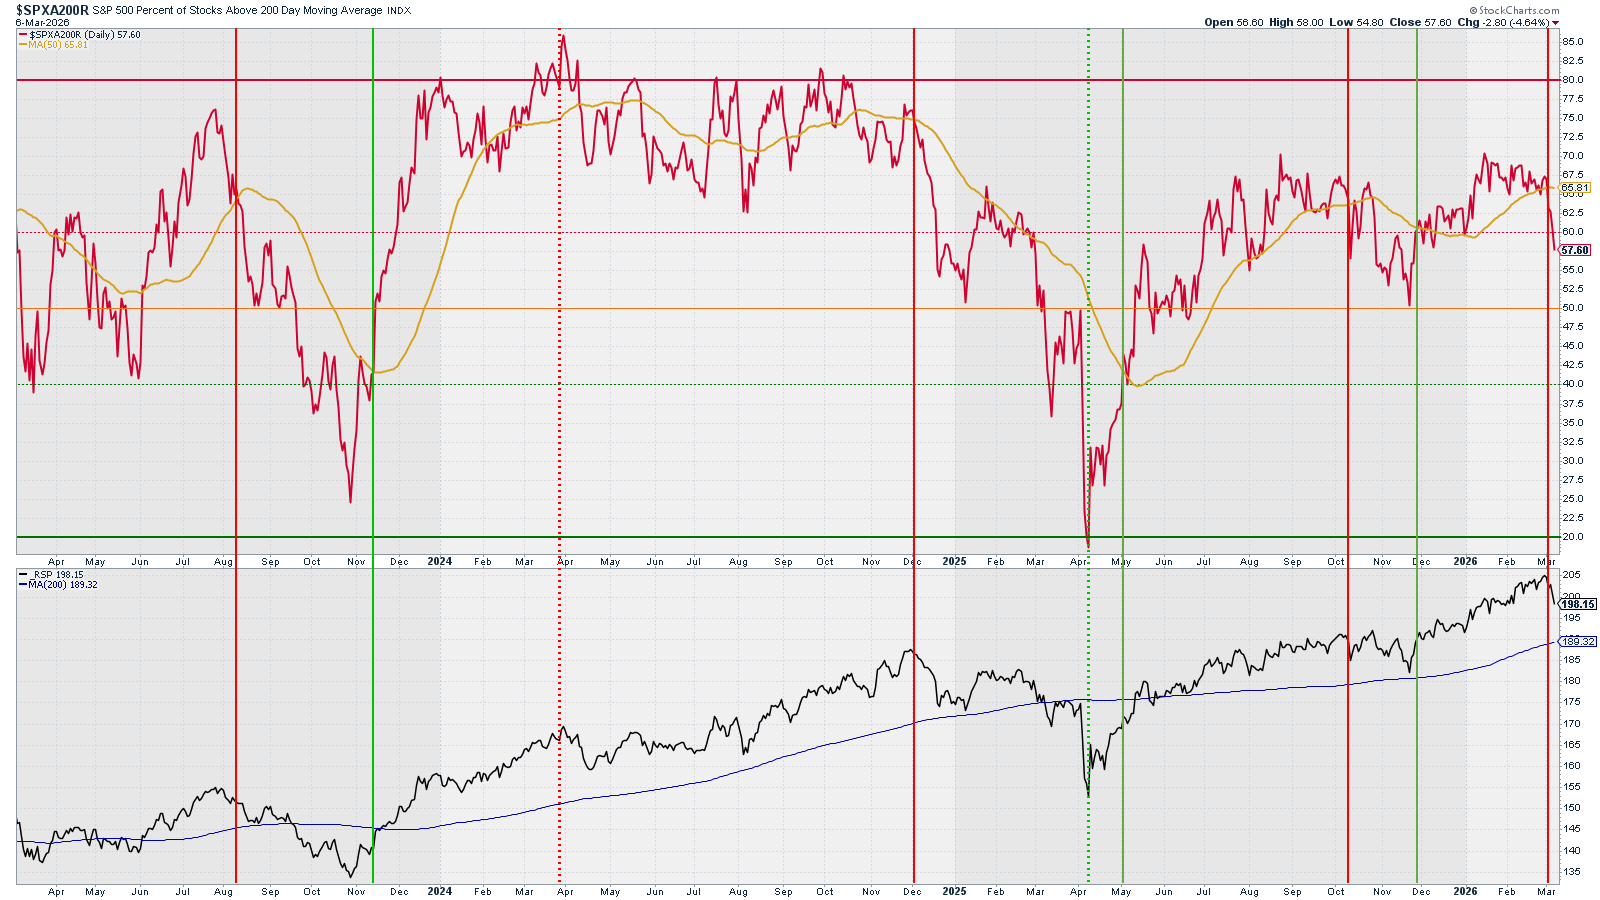
Analysis: Signal crossed, and sharply, below SMA 50.
Outlook: Bearish
What is happening? – Level 2
Breadth & Volatility: RSP and % Stocks above 200, 50, and 20 SMA
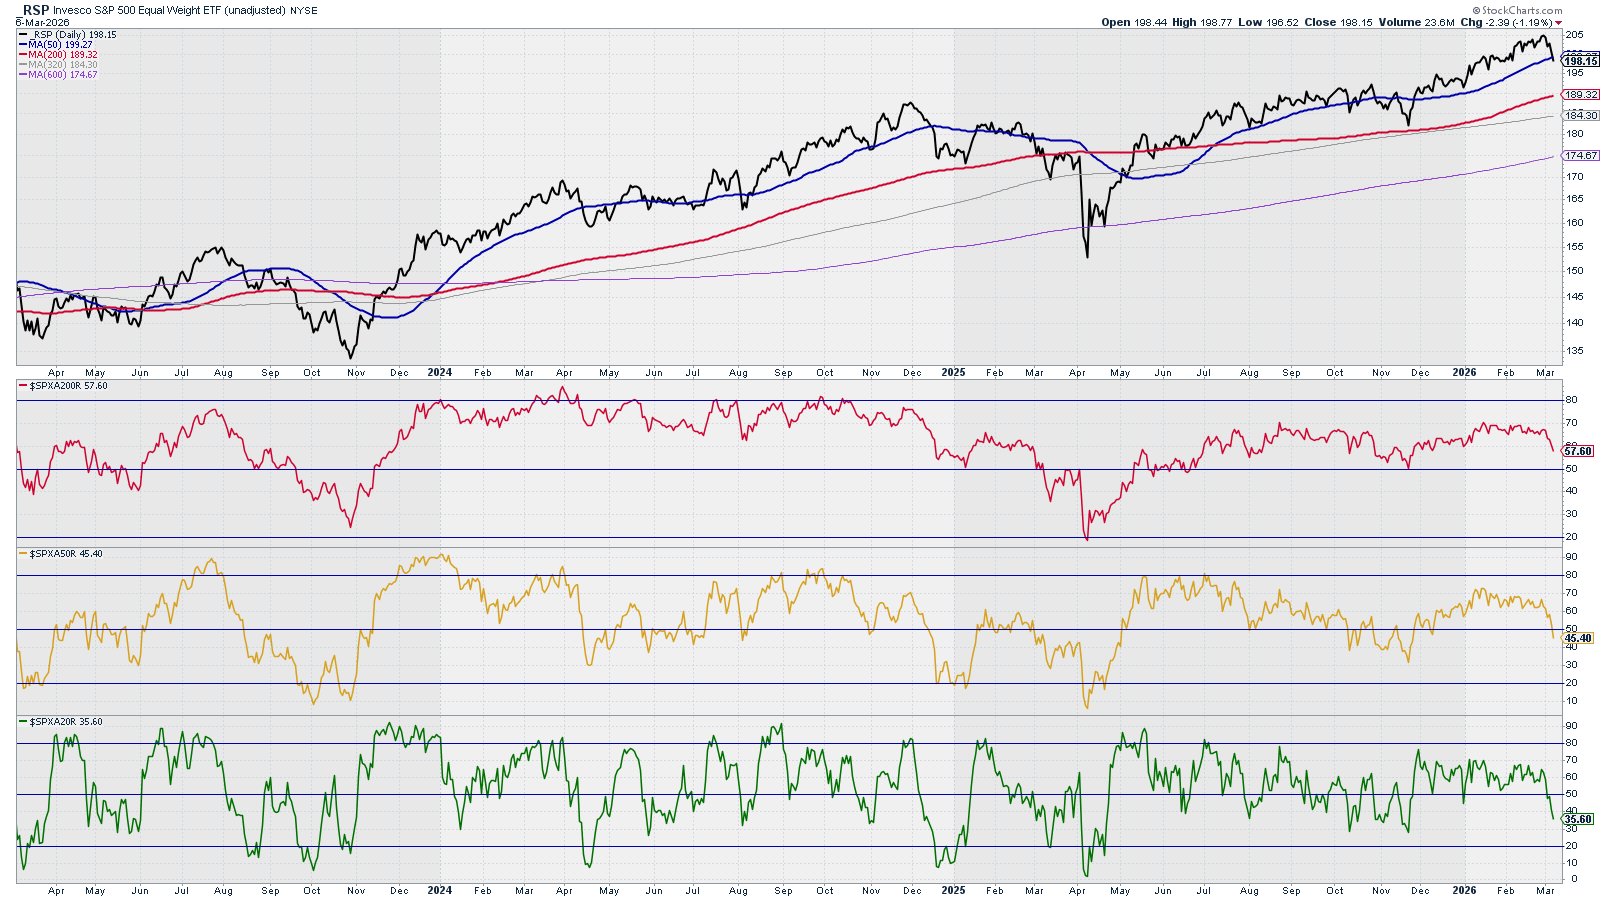
Analysis: SPXA50R (yellow) and SPXA20R (green) have entered bear territory.
Outlook: Bearish
What is happening? – Level 2
Breadth & Volatility: Bullish Pct. Index & McClellan Summation Index
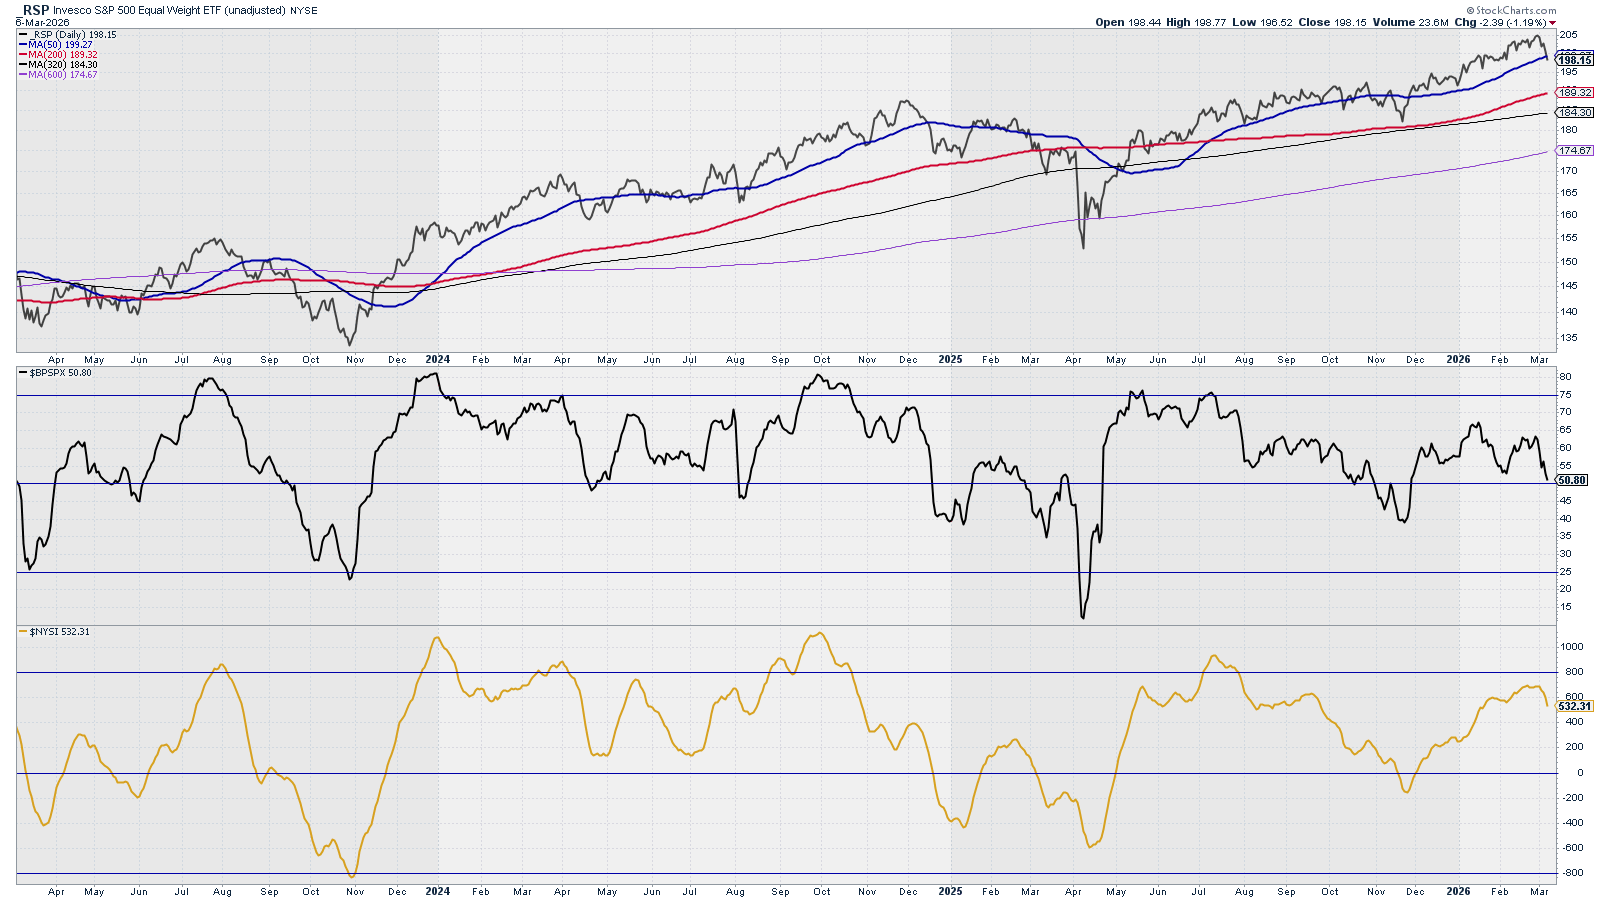
Analysis: Bullish Pct. Index formed a bearish divergence with price since the beginning of 2026 and is about to cross the 50 level on a downward trend.
McClellan just formed a peak and started the downward trend, which could be long as we are far away from any extreme low reading.
Outlook: Bearish
What is happening? – Level 2
Breadth & Volatility: Ratio Low Volatility Stocks / SPY vs. SPY & RSP
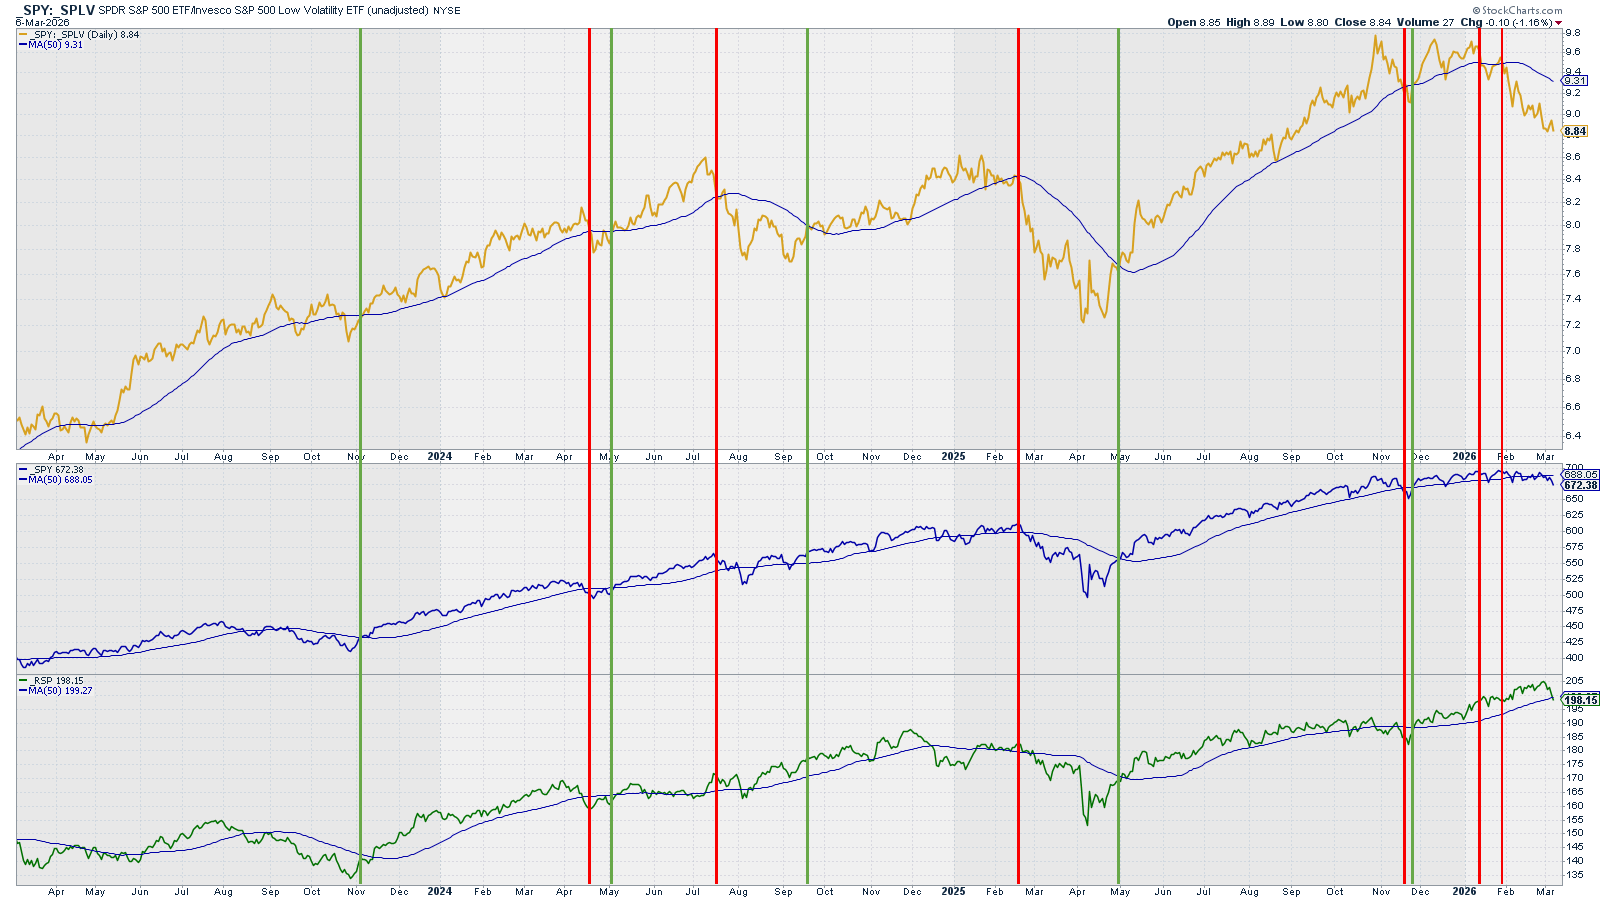
Analysis: Ratio crossed below its SMA50, triggering the bearish signal. Did the this indicator foretell the market downturn?
Outlook: Bearish
What is happening? – Level 2
Breadth & Volatility: New Highs vs. SPY & RSP
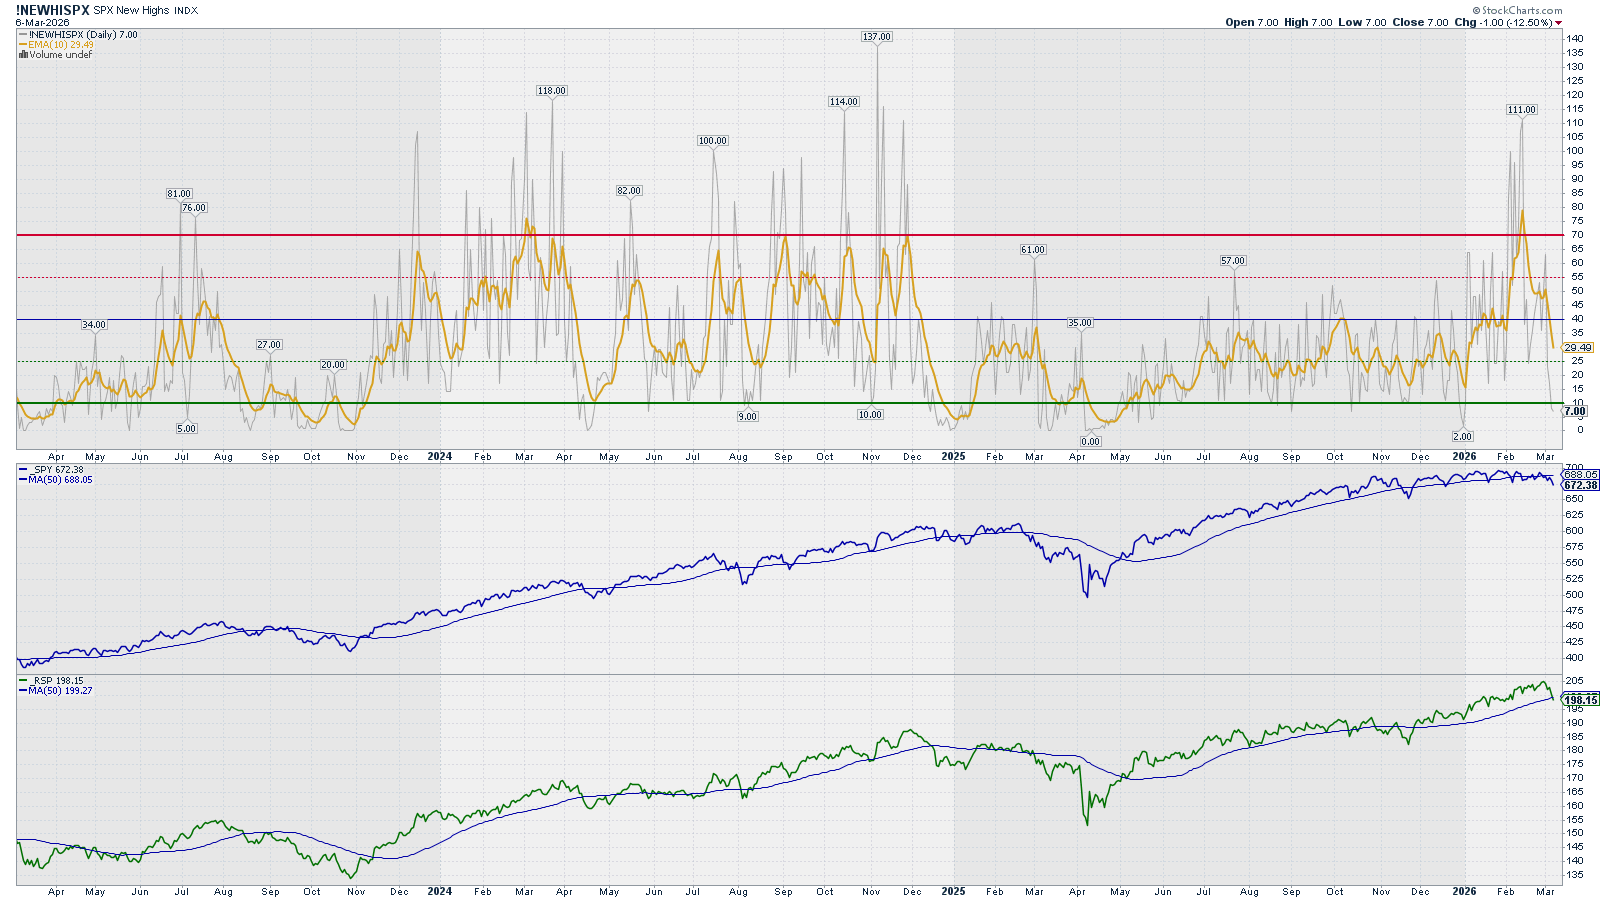
Analysis: New Highs reached a peak level last week, triggering a Bearish signal.
Outlook: Bearish
What is happening? – Level 2
Breadth & Volatility: VIX vs. SPY & RSP
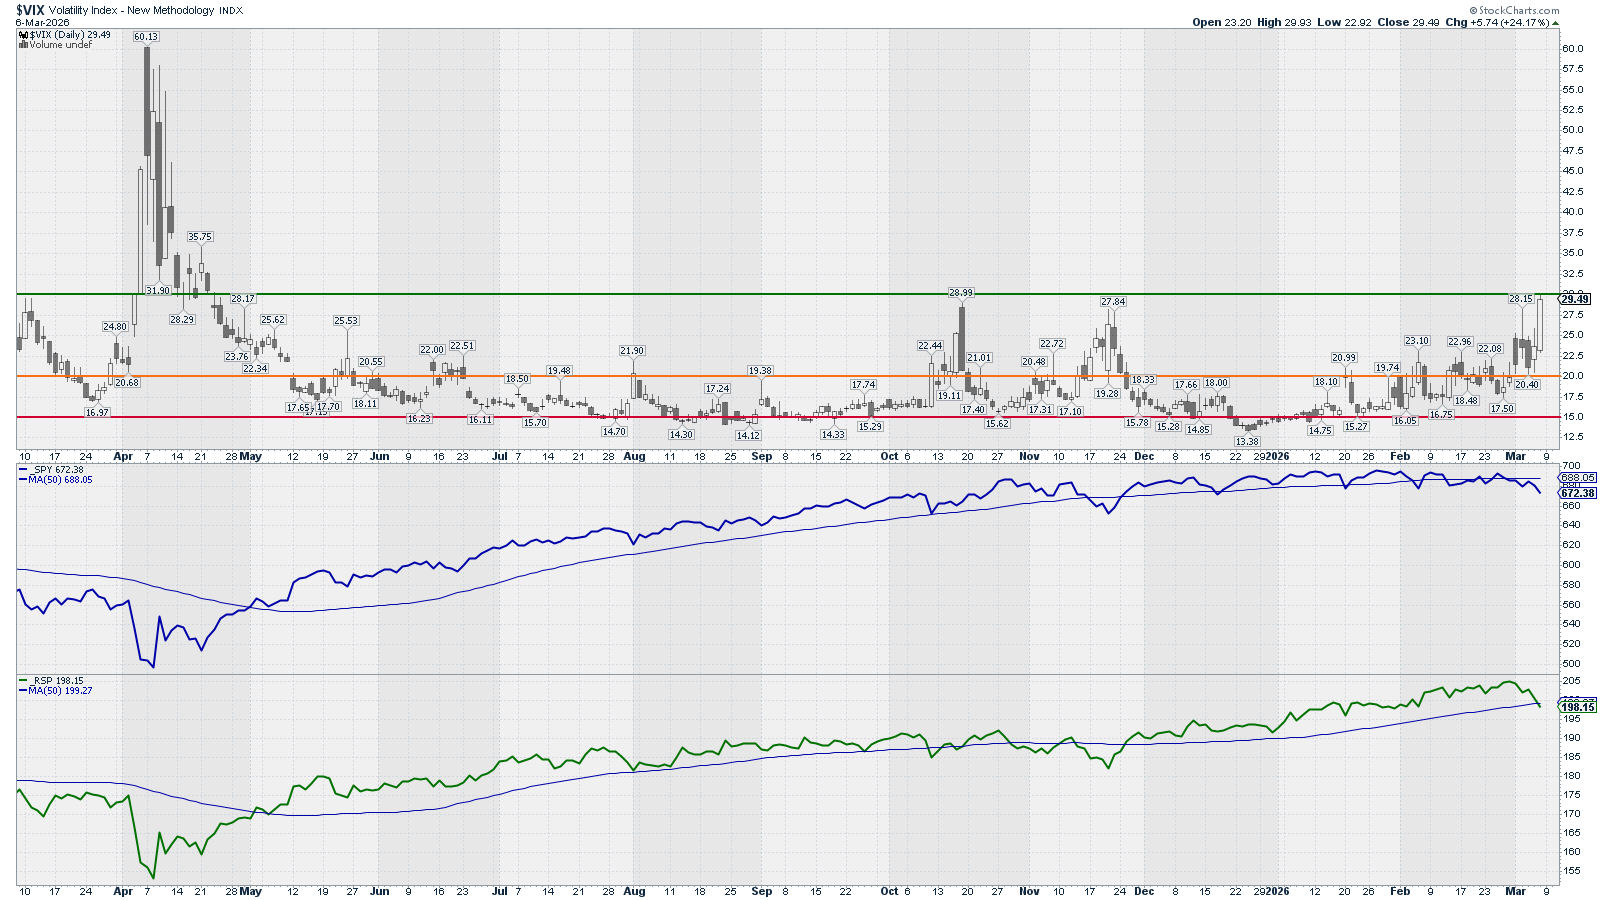
This chart is mainly to detect market bottoms.
Analysis: VIX about to reach level 30.
Outlook: Expect high volatility. Markets can fall sharp here for a quick rebound later.
What is happening? – Level 2
Options: (Inverted) Put/Call Ratio vs. SPY
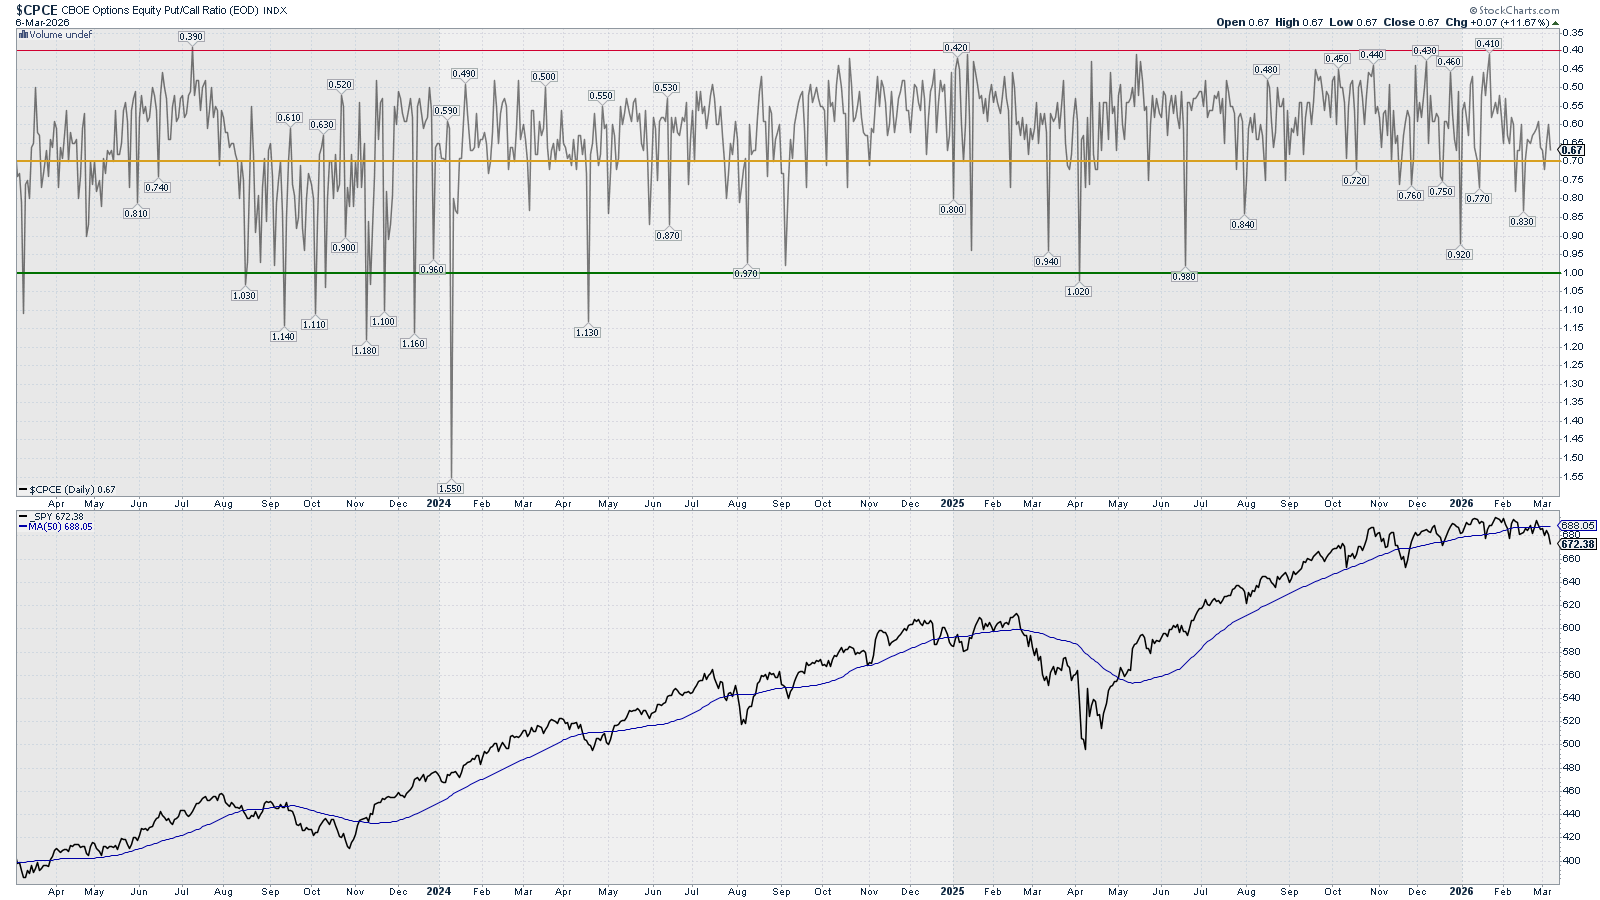
Analysis: P/C ratio in middle ground. Not too bearish not too bullish. Observe that from the peak on the 22nd of January, the market couldn’t advance.
Outlook: Neutral (expect choppiness)
What is happening? – Level 2
Options: Gamma Exposure – SPX
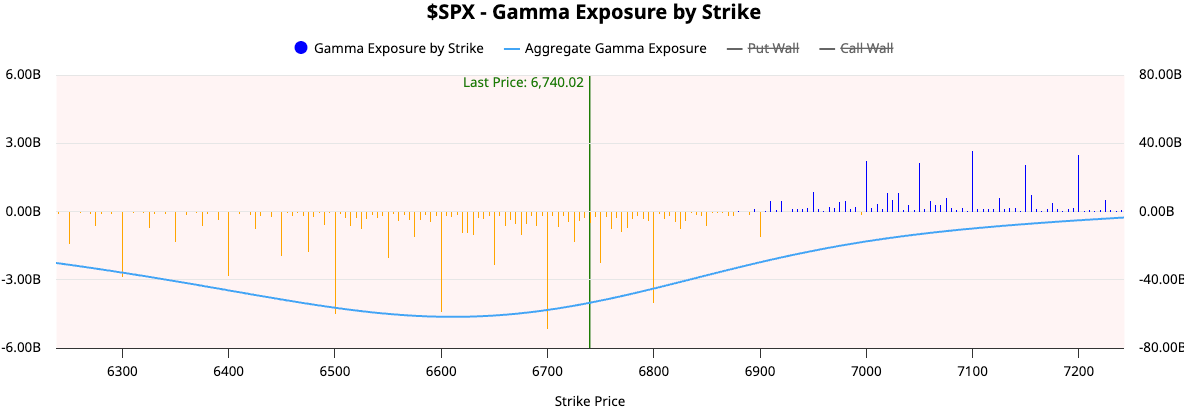
Analysis: In negative GEX. Expect higher volatility with rapid price movements.
Outlook: Neutral (expect choppiness)
Level 2 Summary
Price Action: Bearish
Breadth & Volatility: Bearish
Options: Neutral (expect choppiness)
What is happening? – Level 3
Bulls vs. Bears: RSP vs. RSPD (Cons. Disc. – Bulls) and RSPS (Cons. Sta. – Bears)
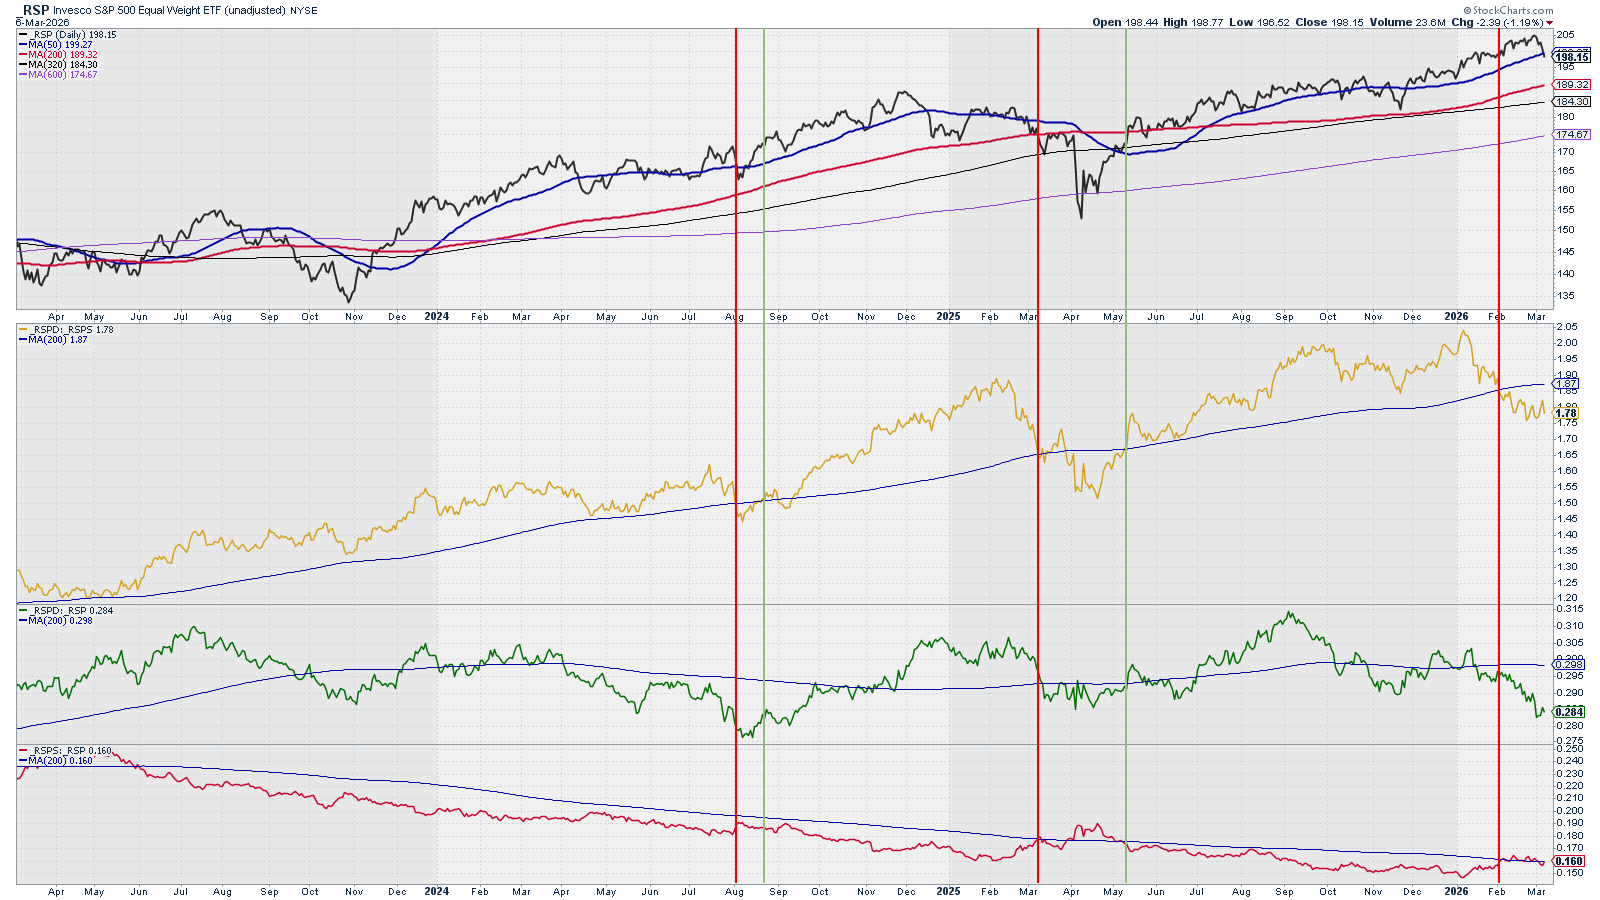
Analysis: Ratio below SMA200, triggering Bearish signal.
Outlook: Bearish
What is happening? – Level 3
Flows into High Beta ETF vs. RSP
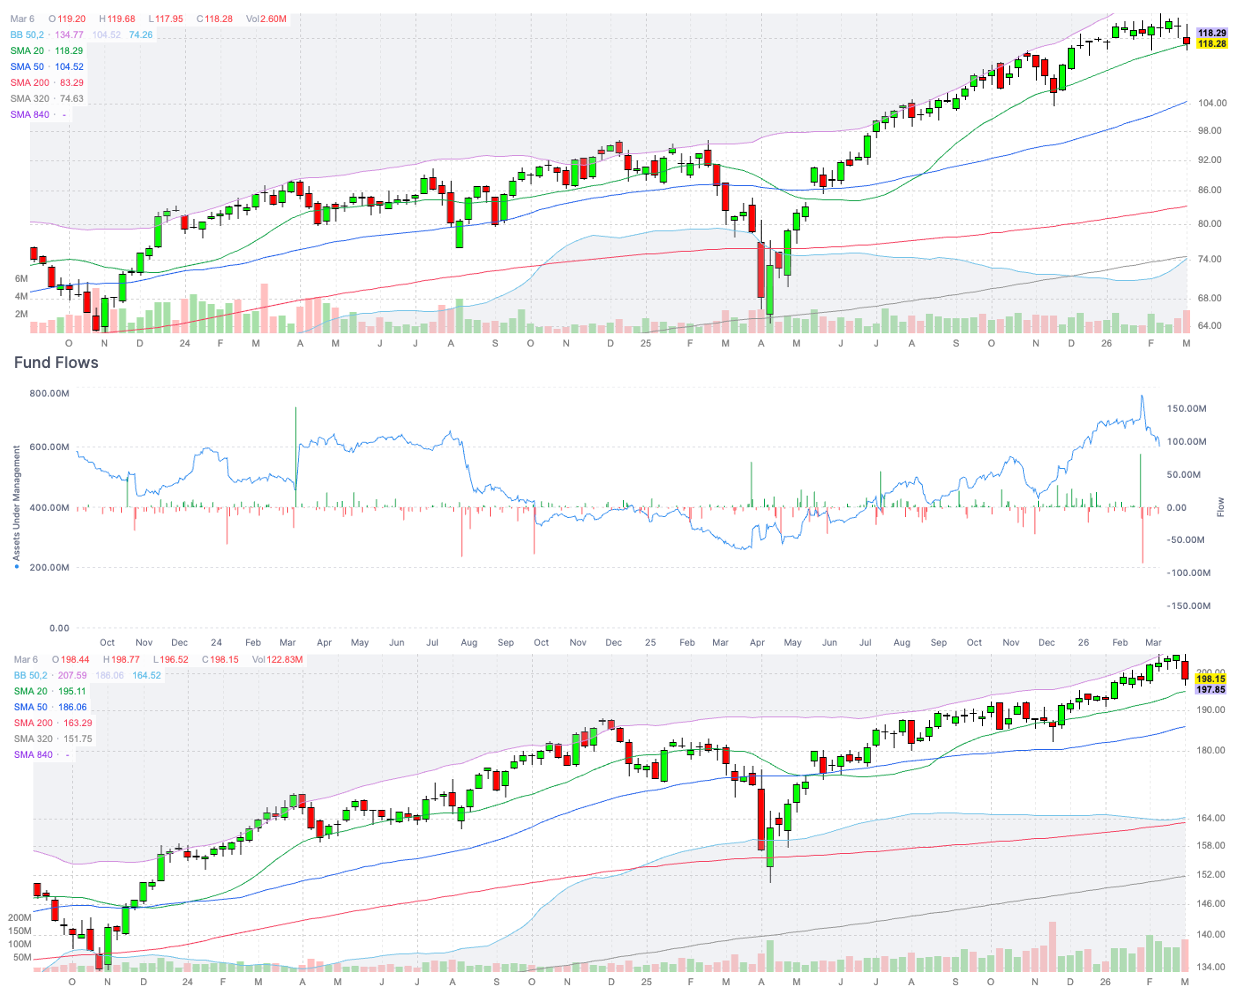
SPHB Fund Flows show the appetite for High Beta (risk on) positions. A decrease on flows is a bearish signal, while an increase in flows is a bullish signal.
Analysis: SPHB fund flows keep falling.
Outlook: Bearish
What is happening? – Level 3
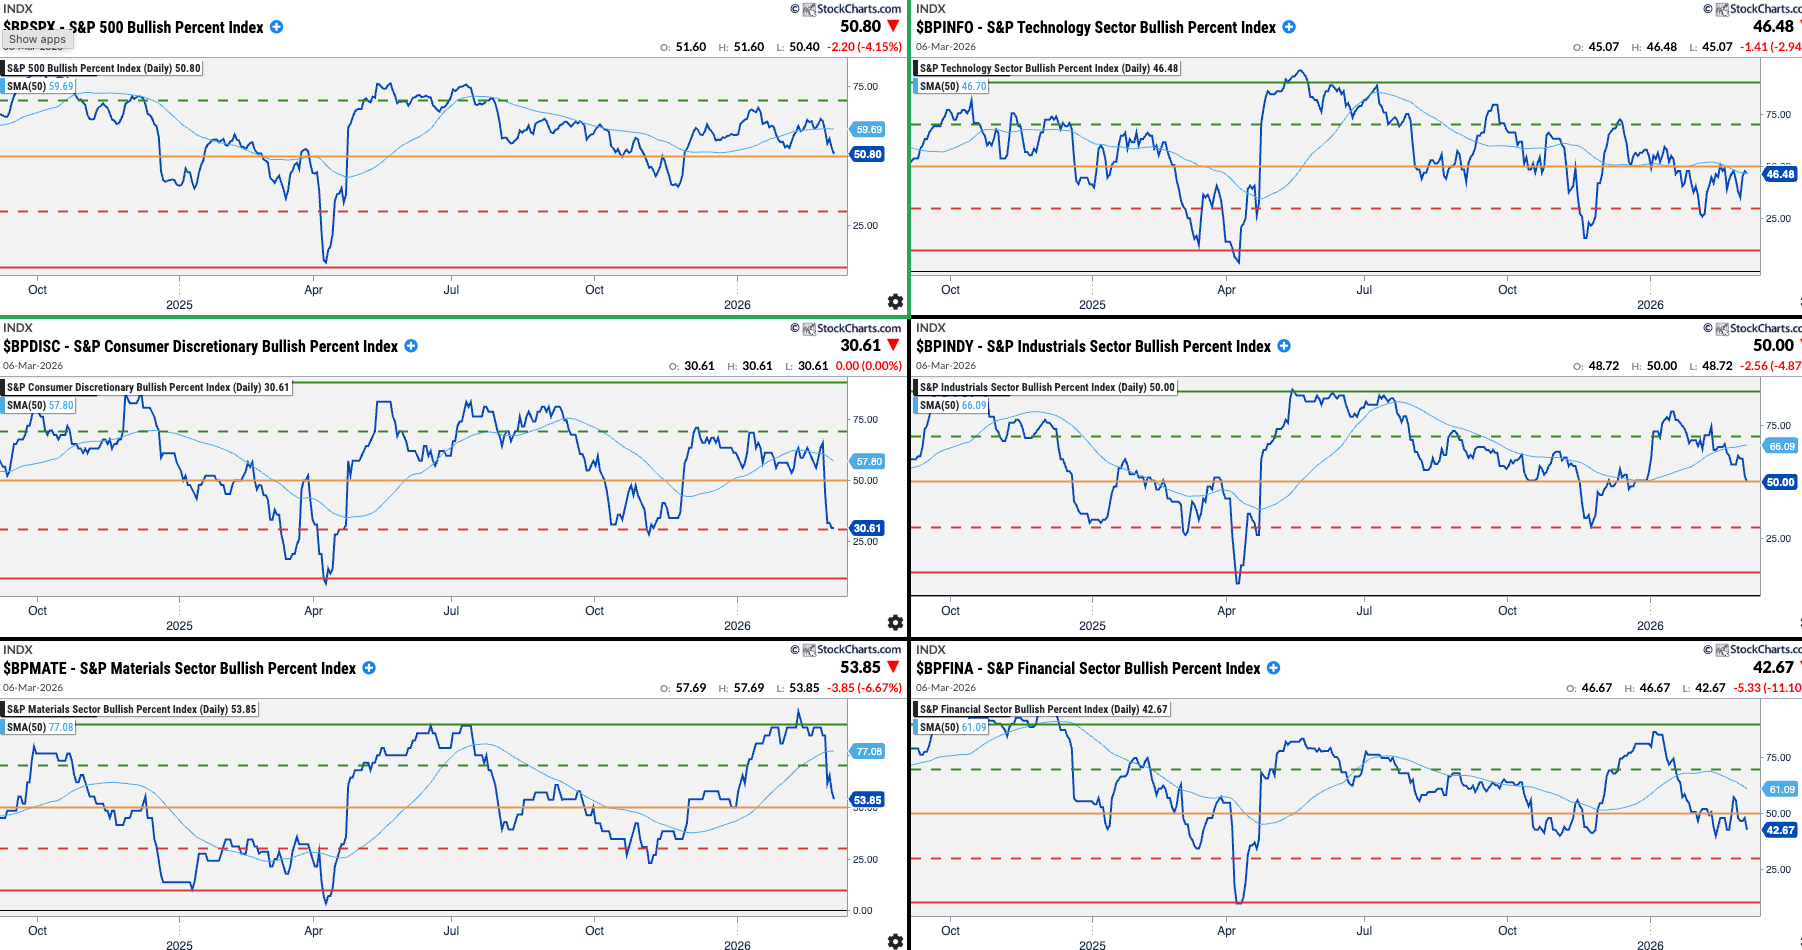
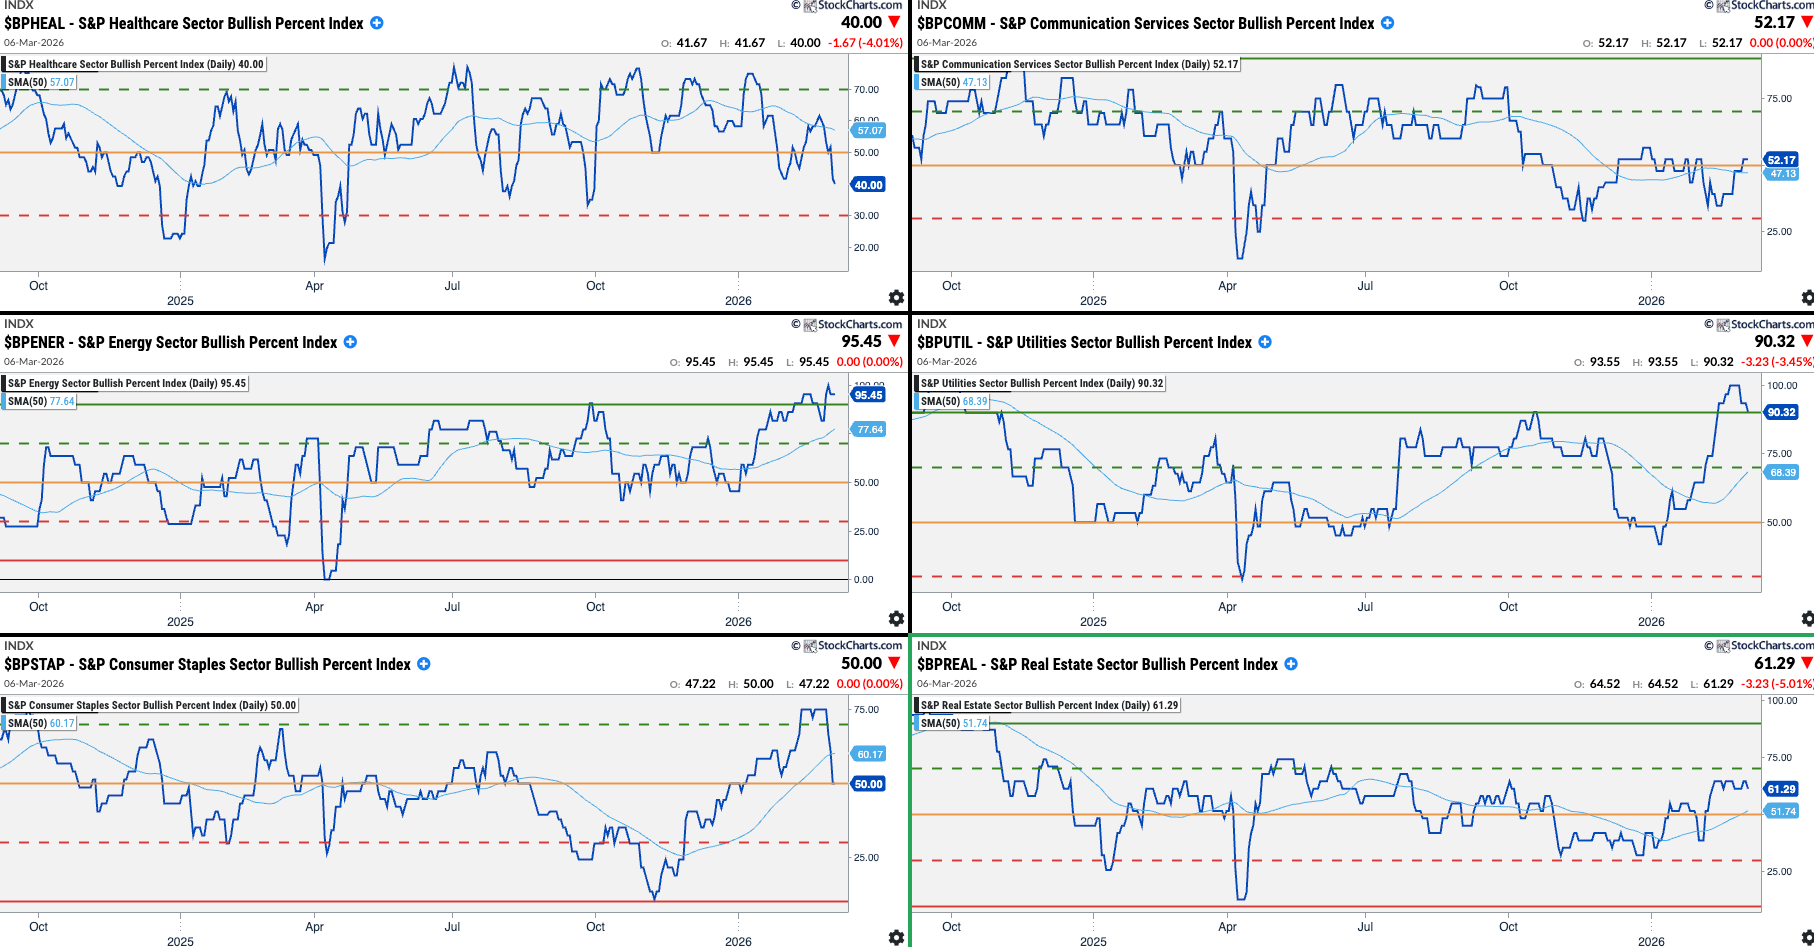
Sectors Bullish Percent Index
US Sectors order by ISM PMI Correlation
Growth - shall outperform when the market is bullish:
XLK: Technology (71%)
XLY: Cons. Discretionary (67%)
XLI: Industrials (66%)
XLB: Basic Materials (66%)
XLF: Financials (59%)
Value (shall outperform when the market is bearish):
XLV: Healthcare (55%)
XLC: Communications (49%)
XLE: Energy (44%)
XLU: Utilities (35%)
XLP: Cons. Staples (30%)
XLRE: Real Estate (16%)
Analysis:
Reduce exposure to: Materials, Energy, Staple, Utilities
Increase exposure to: Financials, Technology
Level 3 Summary
Bulls vs. Bears: Bearish
High Beta Flows: Bearish
All Levels Summary
Level 1 Summary
Economic Data: Bullish
USD & Interest Rates: Bearish
Investors Sentiment: Bearish
Level 2 Summary
Price Action: Bearish
Breadth & Volatility: Bearish
Options: Neutral (expect high choppiness)
Level 3 Summary
Bulls vs. Bears: Bearish
High Beta Flows: Bearish