

Weekly Review - 2026-June-26
Tech on a summer break.

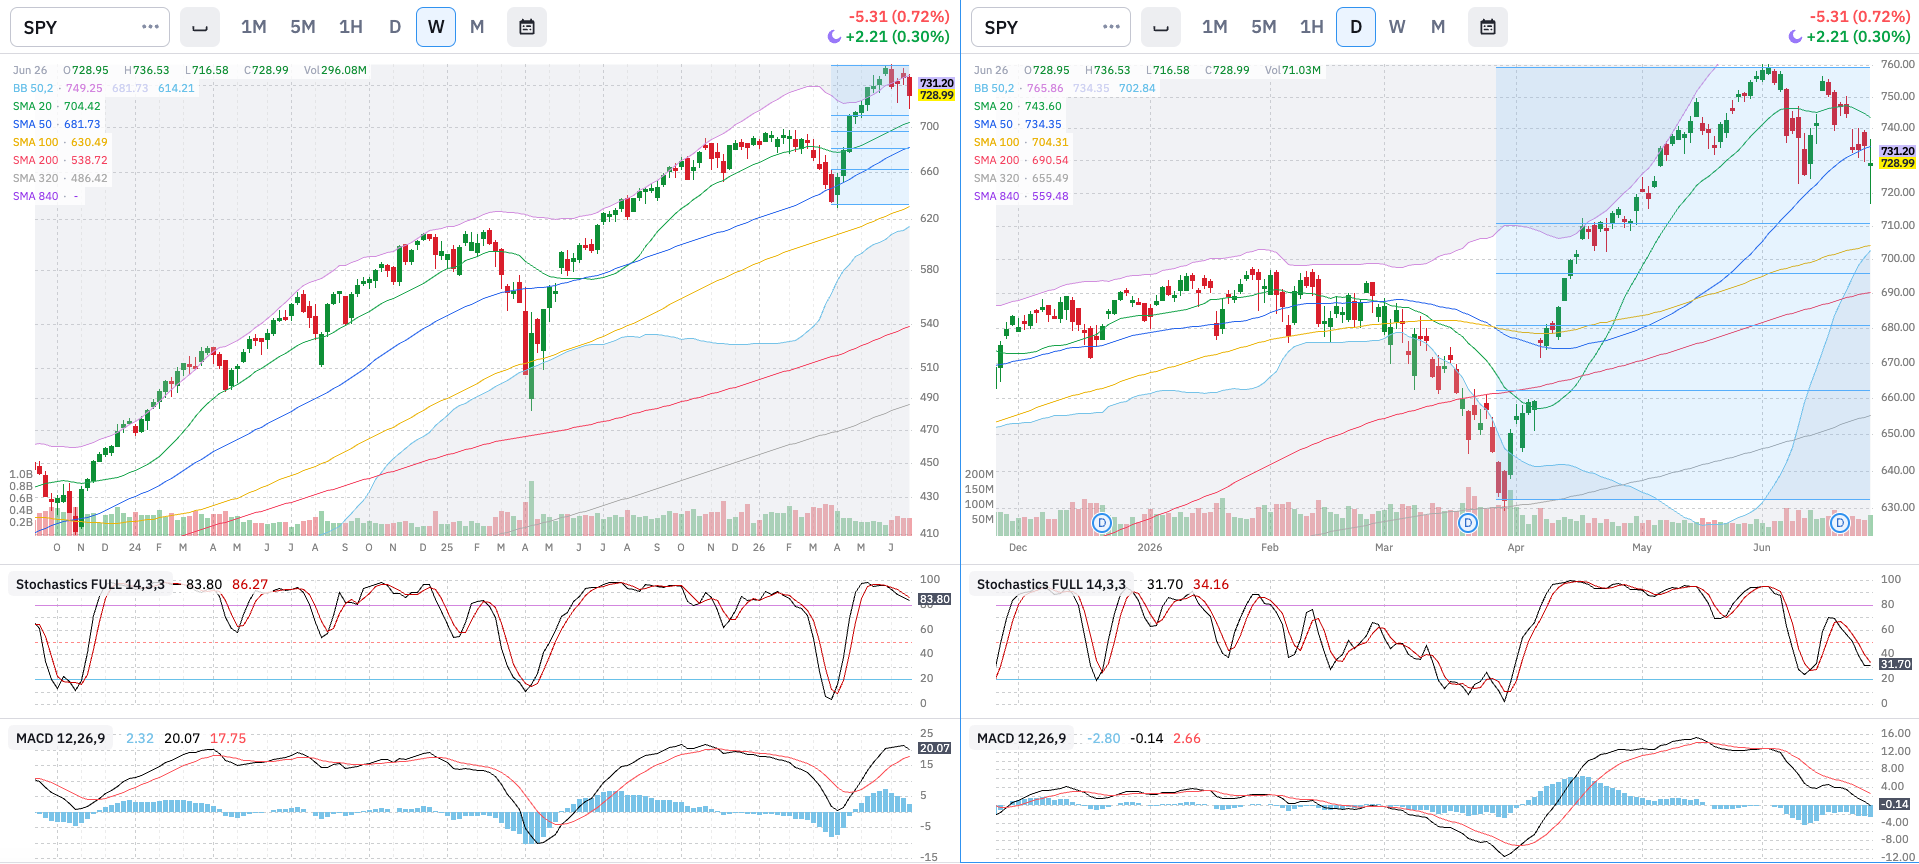
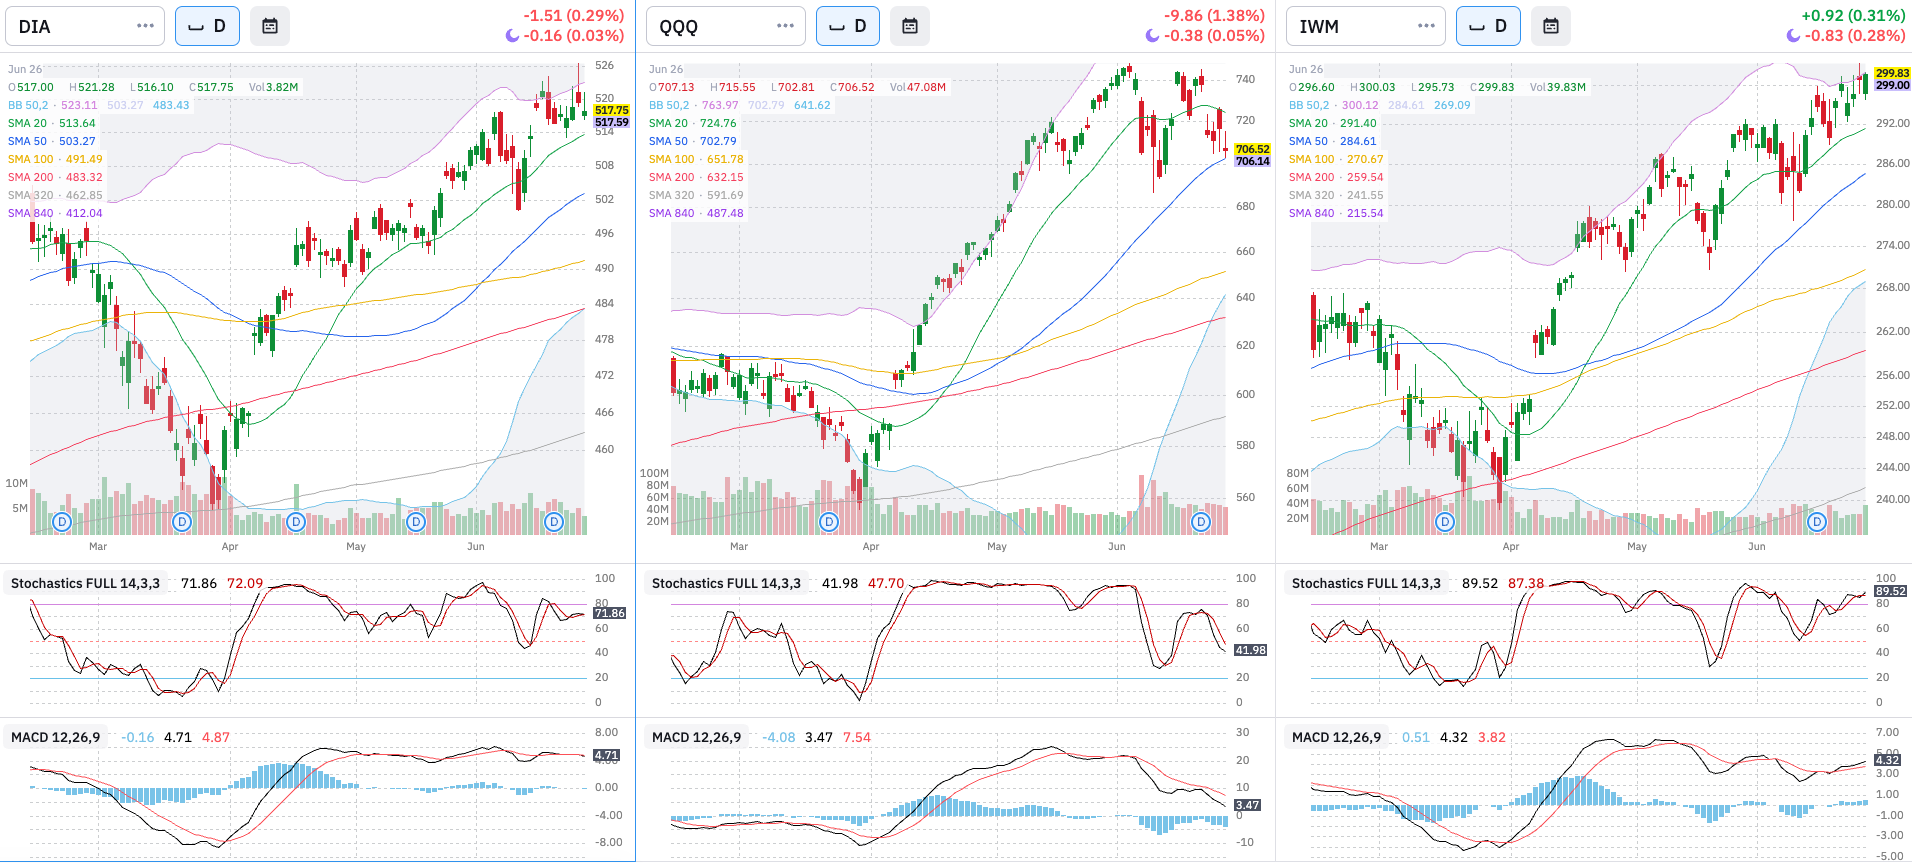
Comment: SPY felt not only below its 20D but as well under the 50D SMA. QQQ held above its 50D but also broke below the 20D. Meanwhile DIA and IWM are helding their bullish trends. Interesting to see that high inflation expectations are not impeding IWM advancement. Economic growth is winning over inflation.
As we pointed out last week, the market was sending signals for correction (mainly looking at the options market and volatility signals) and we are finally seeing that. Breadth is expanding, seen by the different performance in SPY and QQQ vs. DIA and IWM. So, tech is taking a break for the summer and letting the other parts of the market take the lead.
Level 1: Why is it happening?
Economic Data: Production: ISM PMI vs. SPX
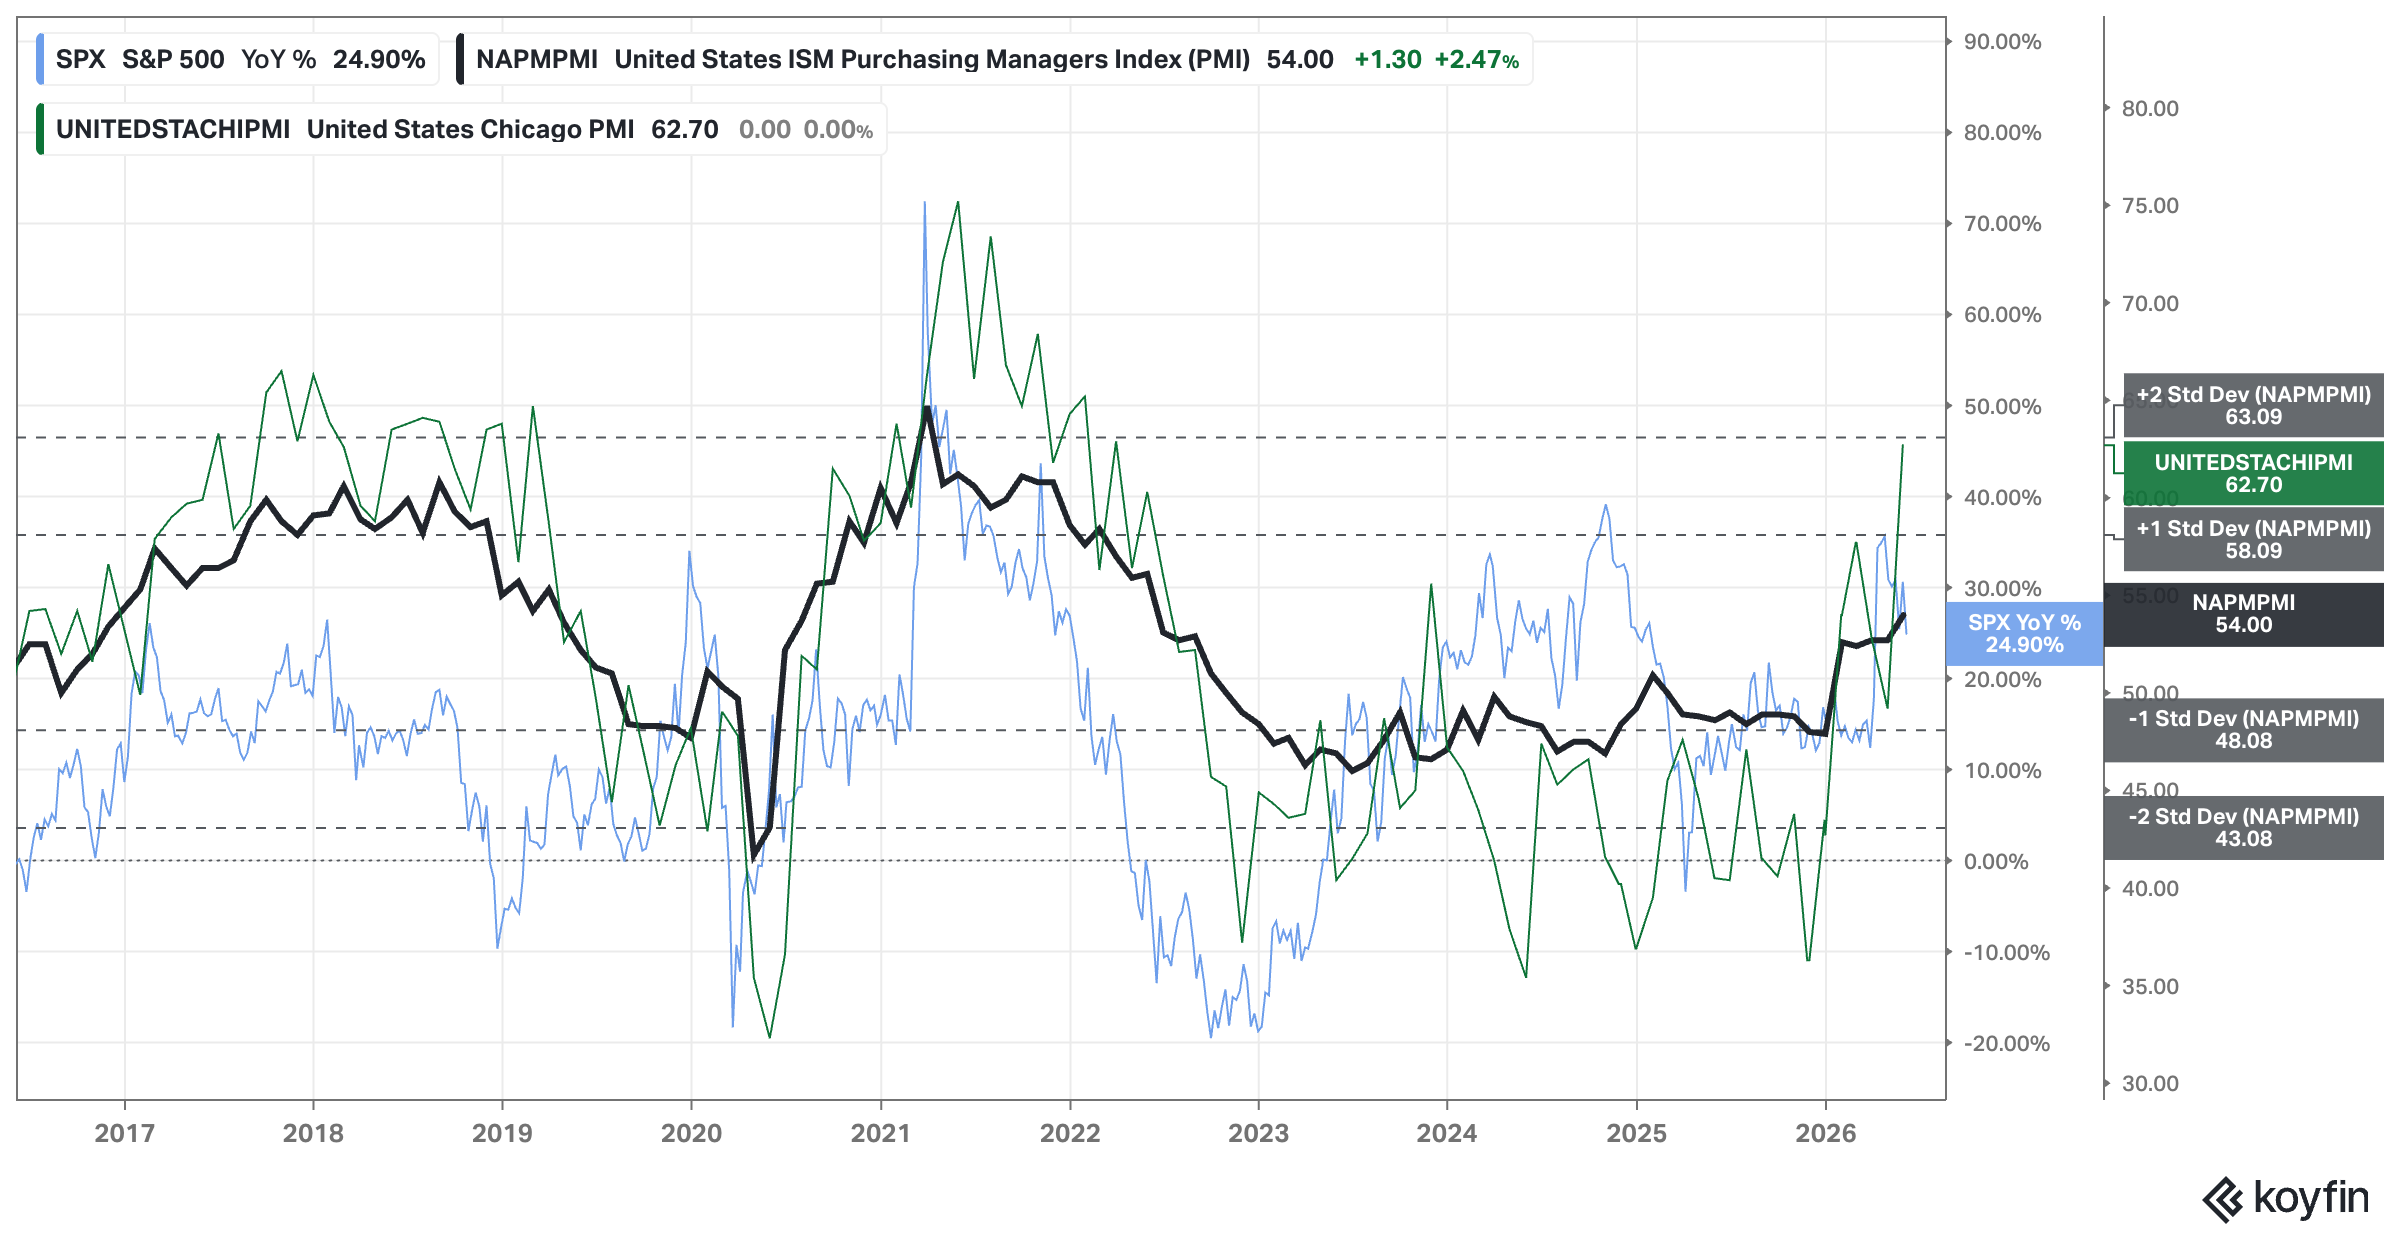
Analysis: No changes since last week.
Current Situation: Bullish
Future Outlook: Bullish
Economic Data: Production: Dallas & Philadelphia Manufacturing vs. SPX

Analysis: Philadelphia’s reading improved and puts back our bullish future outlook.
Current Situation: Neutral
Future Outlook: Bullish
Economic Data: Consumption: Consumer Sentiment
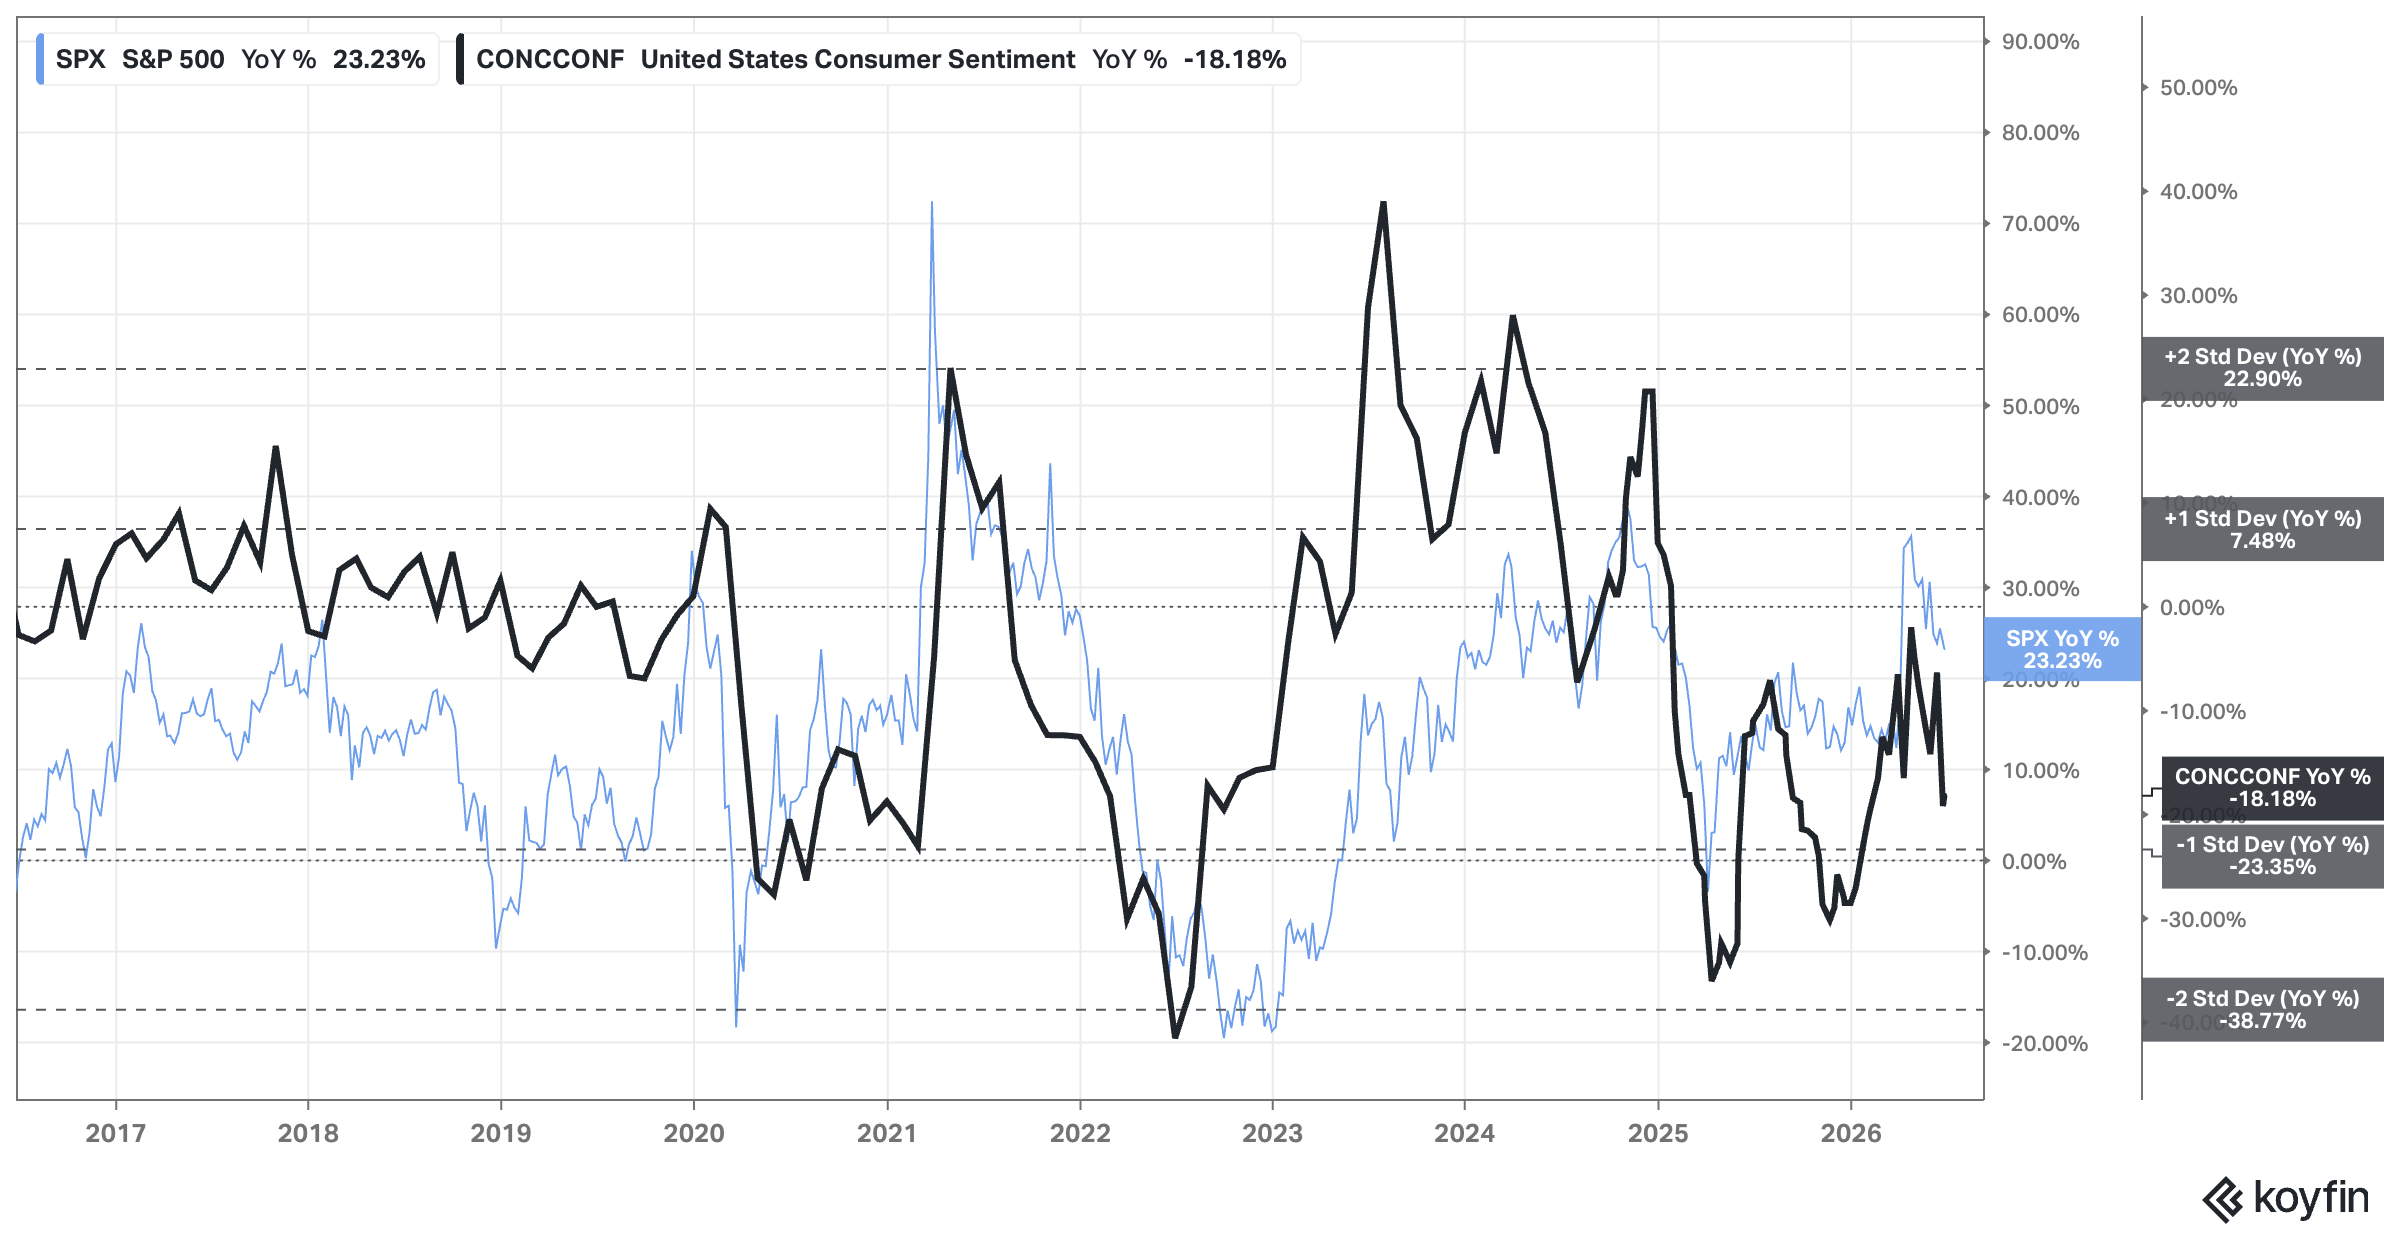
Analysis: Another drop in this highly politically bias indicator. Yet, high energy prices and overall high prices are making nobody happy.
Current Situation: Bearish
Future Outlook: Bullish
Interest Rates: FED, 2yr, 10yr, and 30yr Rates
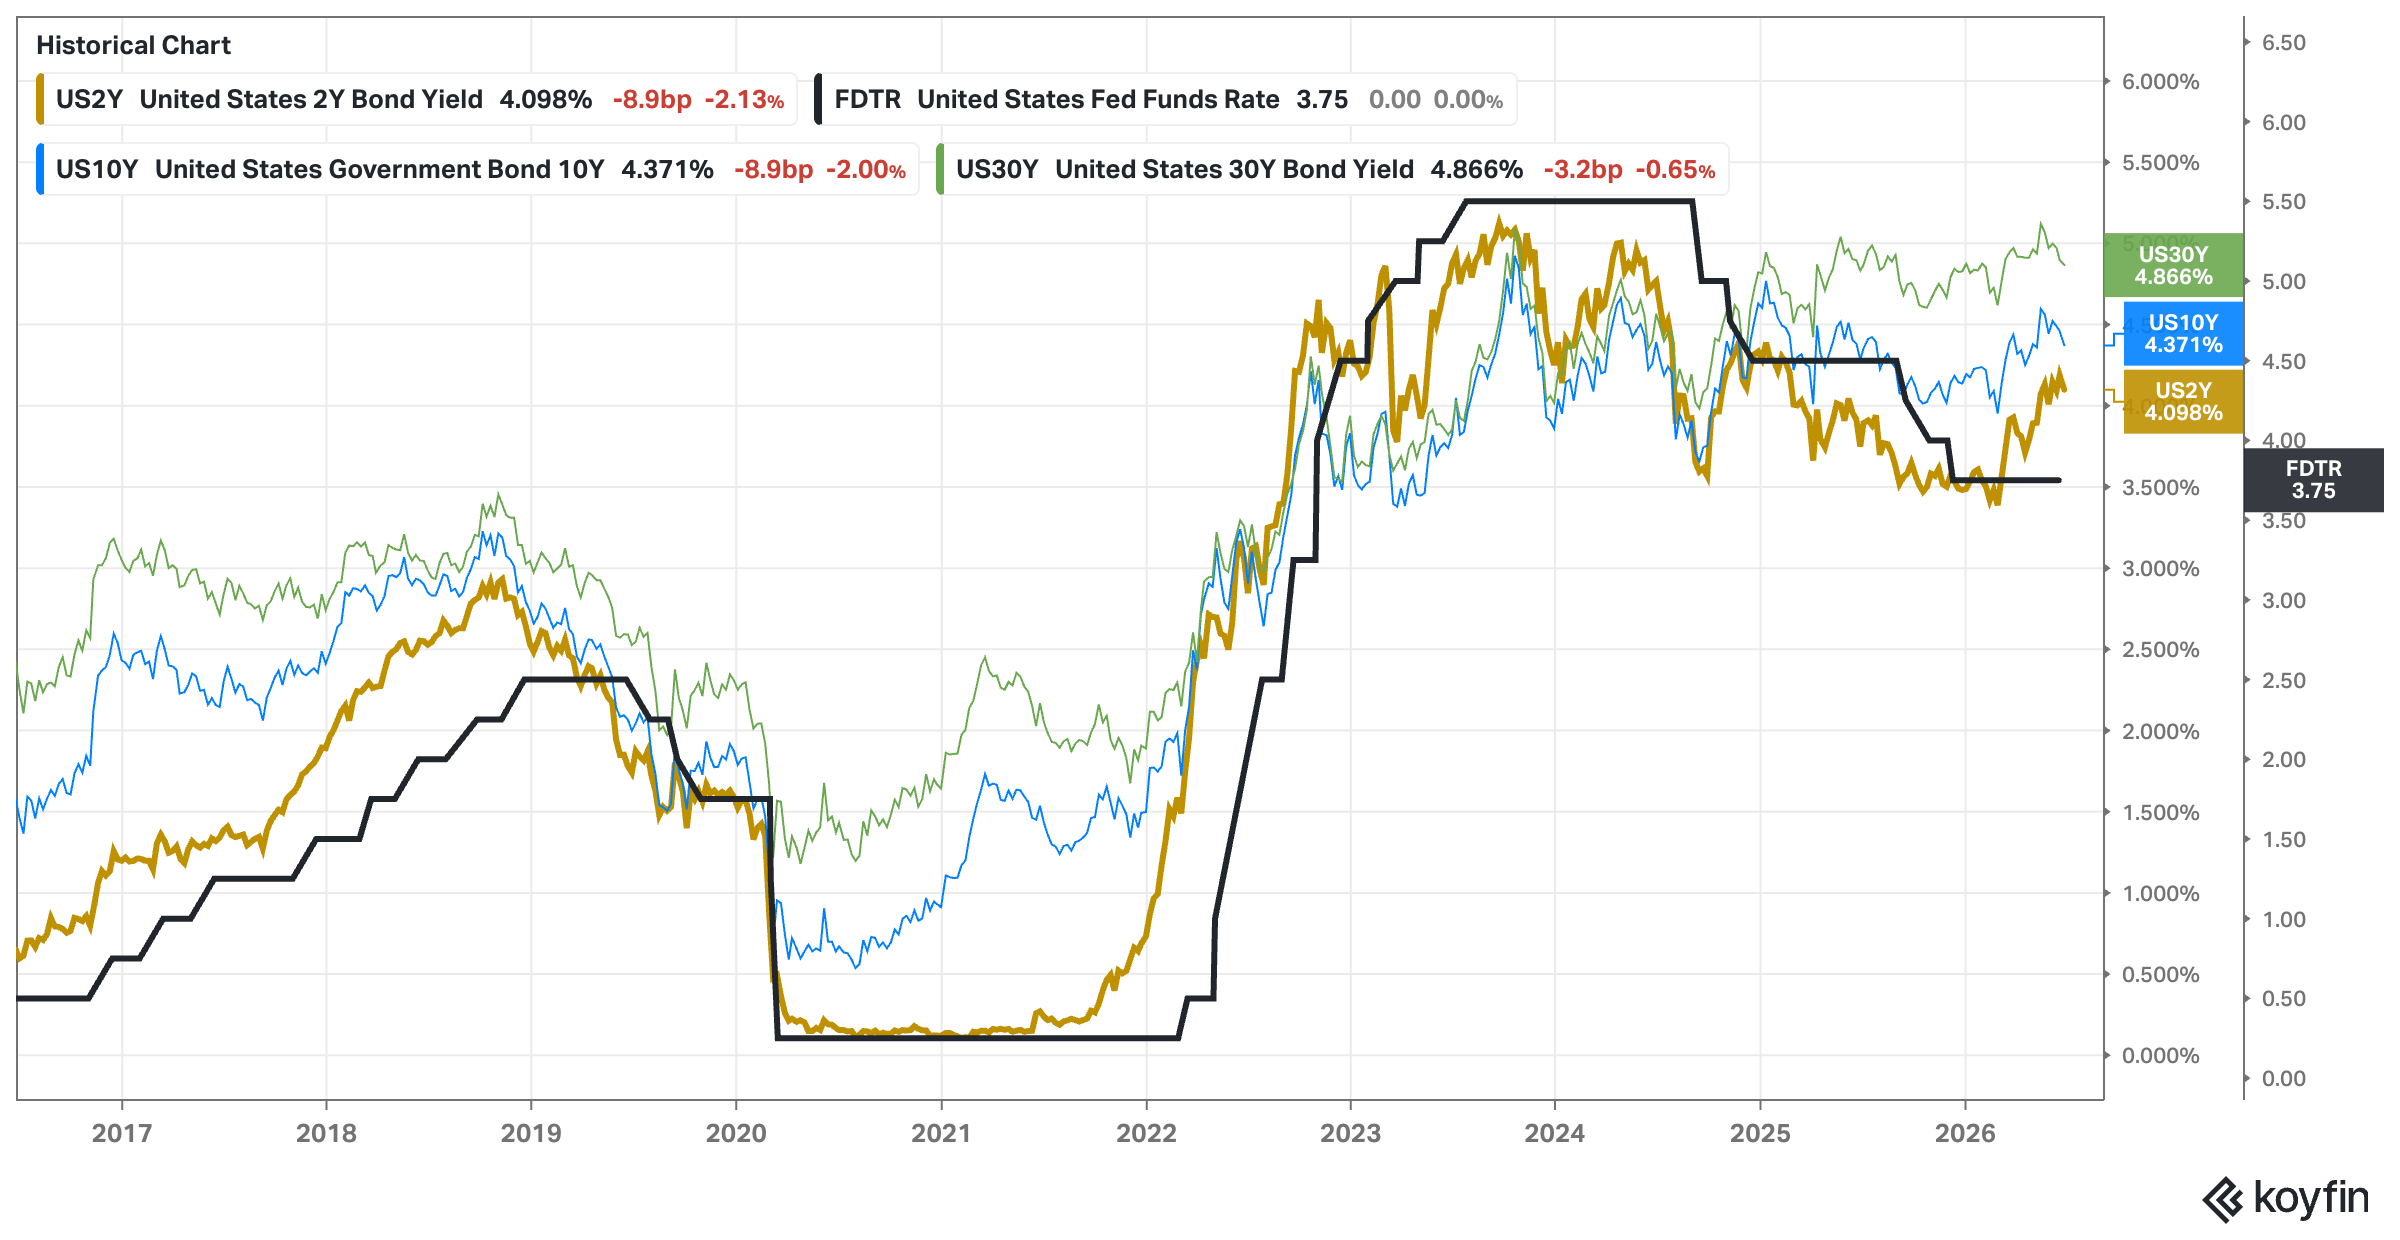
Analysis: Long term rates had a bearish reversal due to the end of Iran’s war. If “the deal” holds, energy prices shall drop, which will impact inflation, and possibly distance the Fed from raising rates.
Current Situation: Bearish
Future Outlook: Neutral
Context Investors Sentiment: Credit Spreads
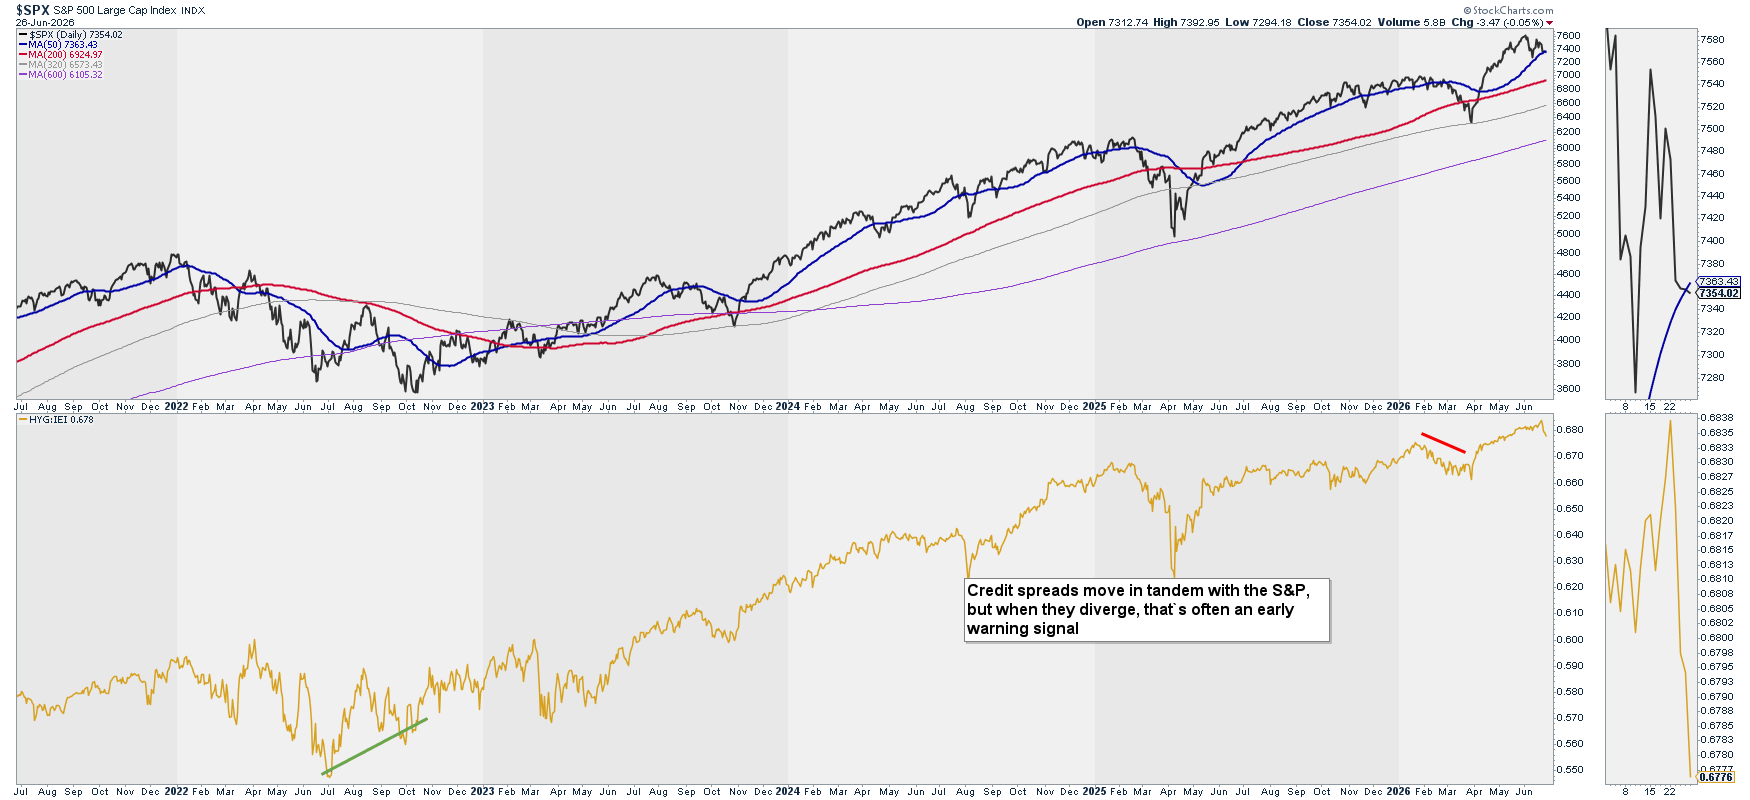
Note: Credit spreads move in tandem with the S&P, but when they diverge, that’s often an early warning signal.
Analysis: Spreads have turned lower, aligned with market’s price action.
Current Situation: Bearish
Outlook: Bearish
Level 1: Why is it happening? Summary
Economic Data (long-term): Bullish/Bullish
Interest Rates: Bearish/Neutral
Investors Sentiment: Bearish/Bearish
Level 2: What is happening?
Price Action: SPX – Long Trend – 20 & 10 years
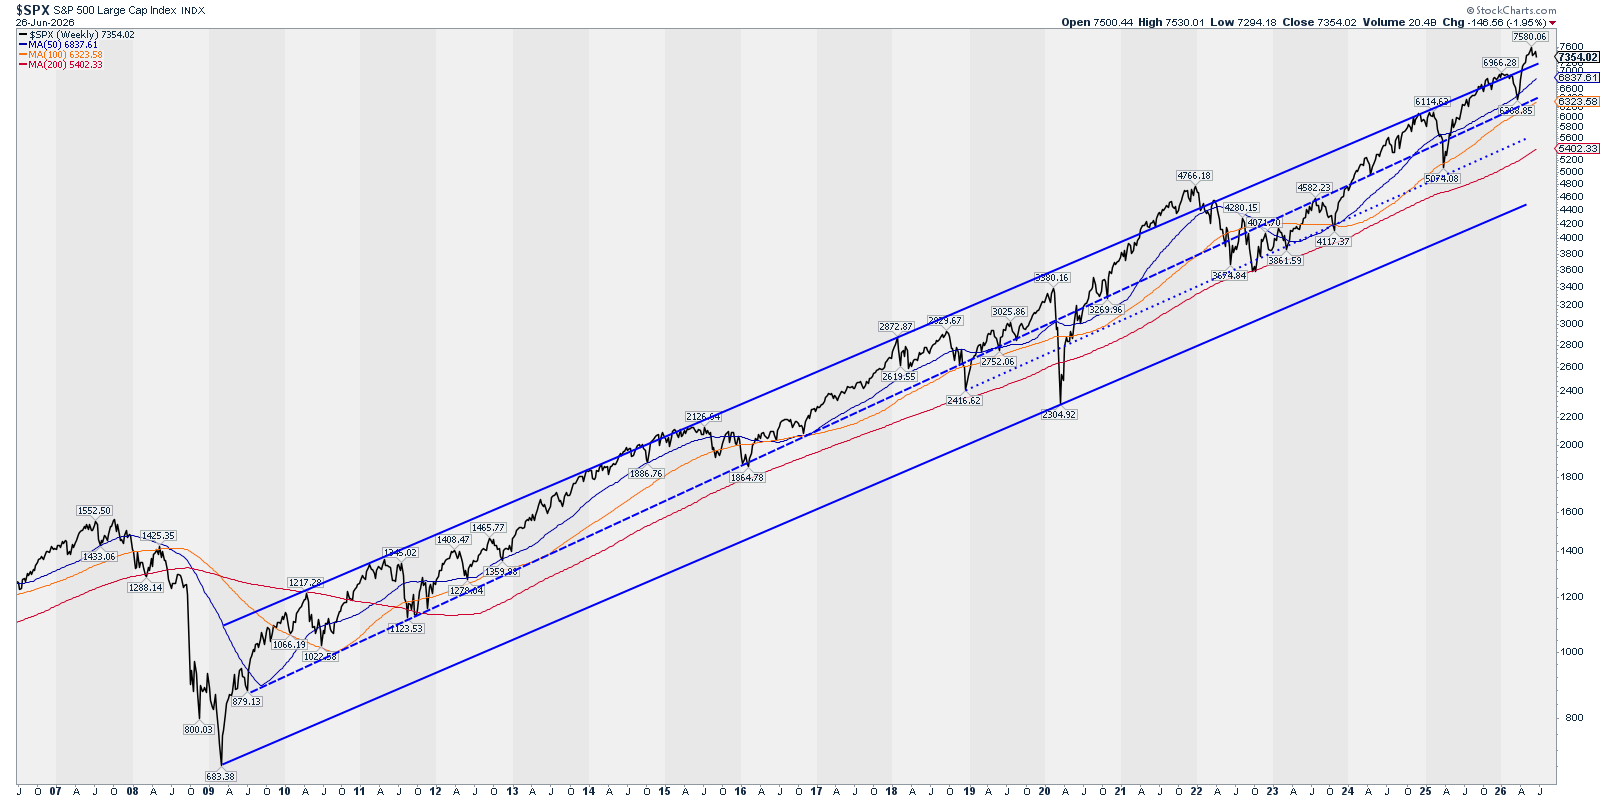
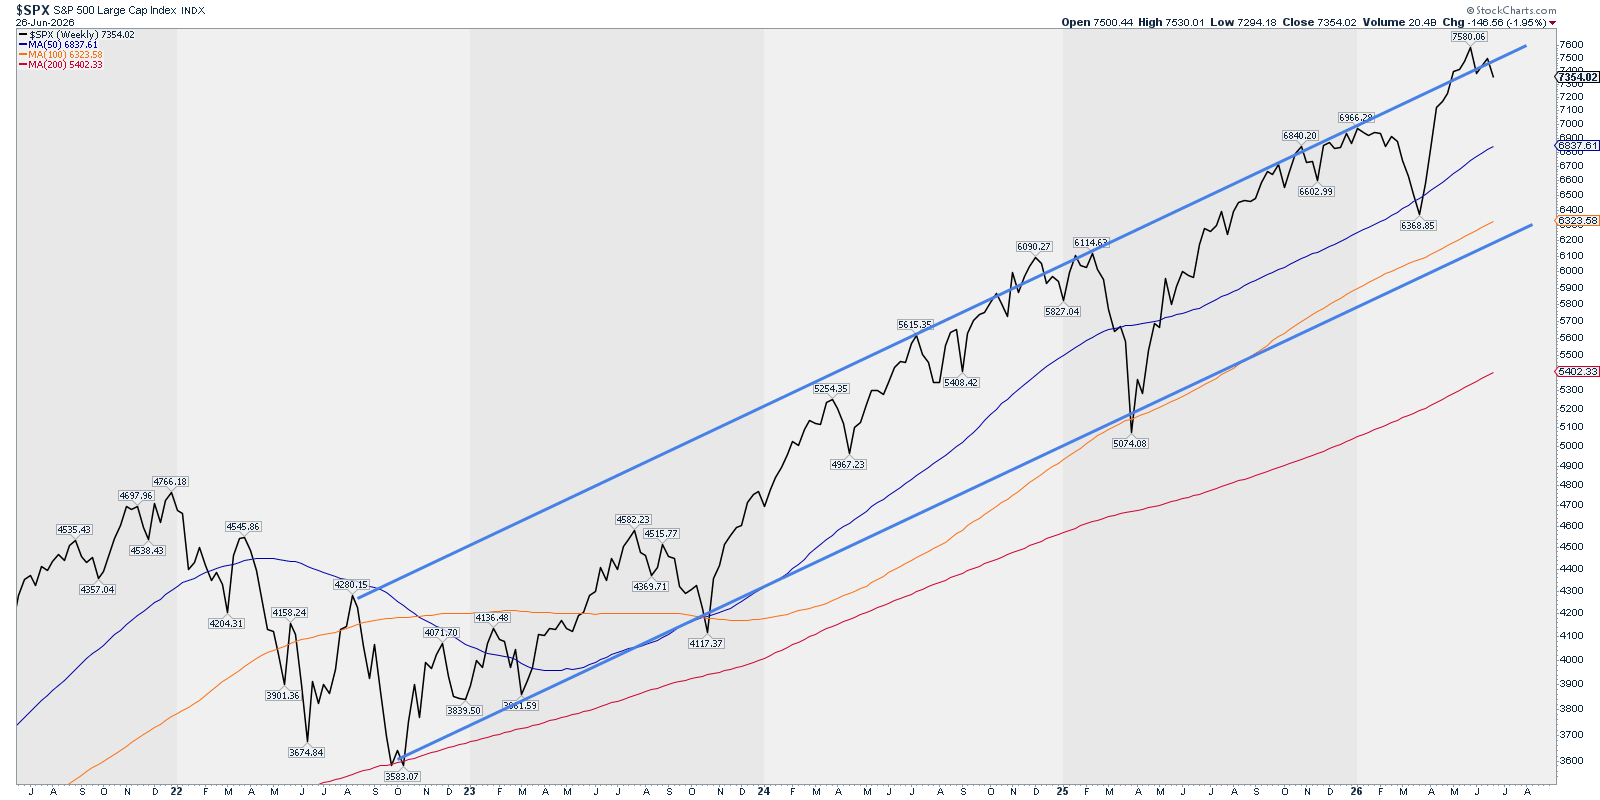
Analysis: Price re-entered the 10Y channel again this week, but more conviction. The 20Y channel is still quite far down (circa 7,200 area). We can expect prices to aim to the middle of the channel for a good correction in the overall bullish trend.
Current Situation: Bearish
Future Outlook: Bearish
Price Action: RSP – Trend – Weekly & Daily
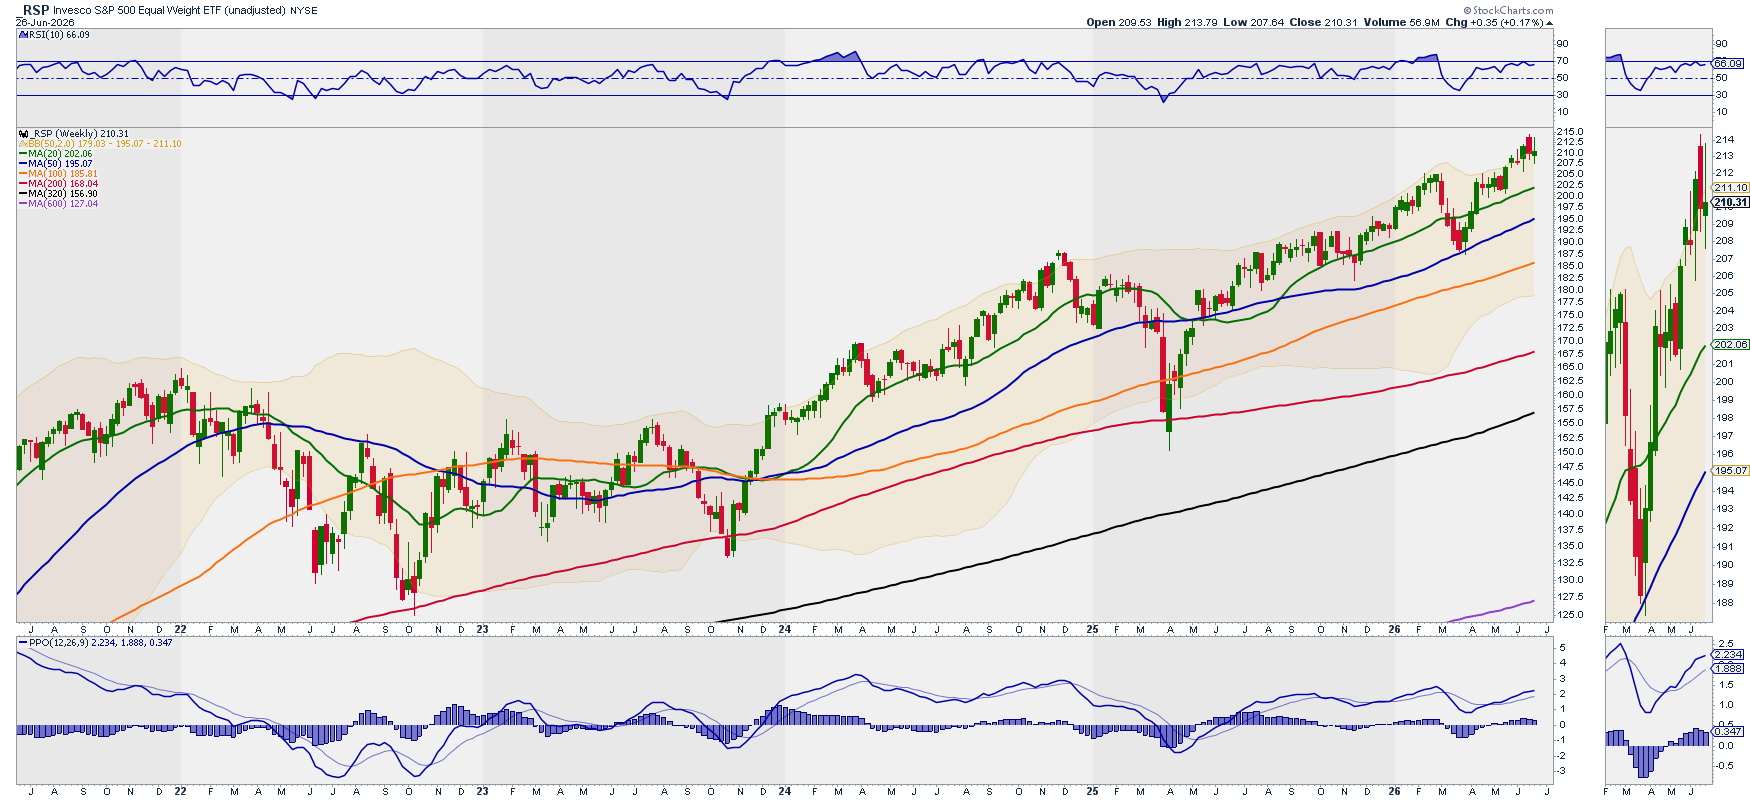
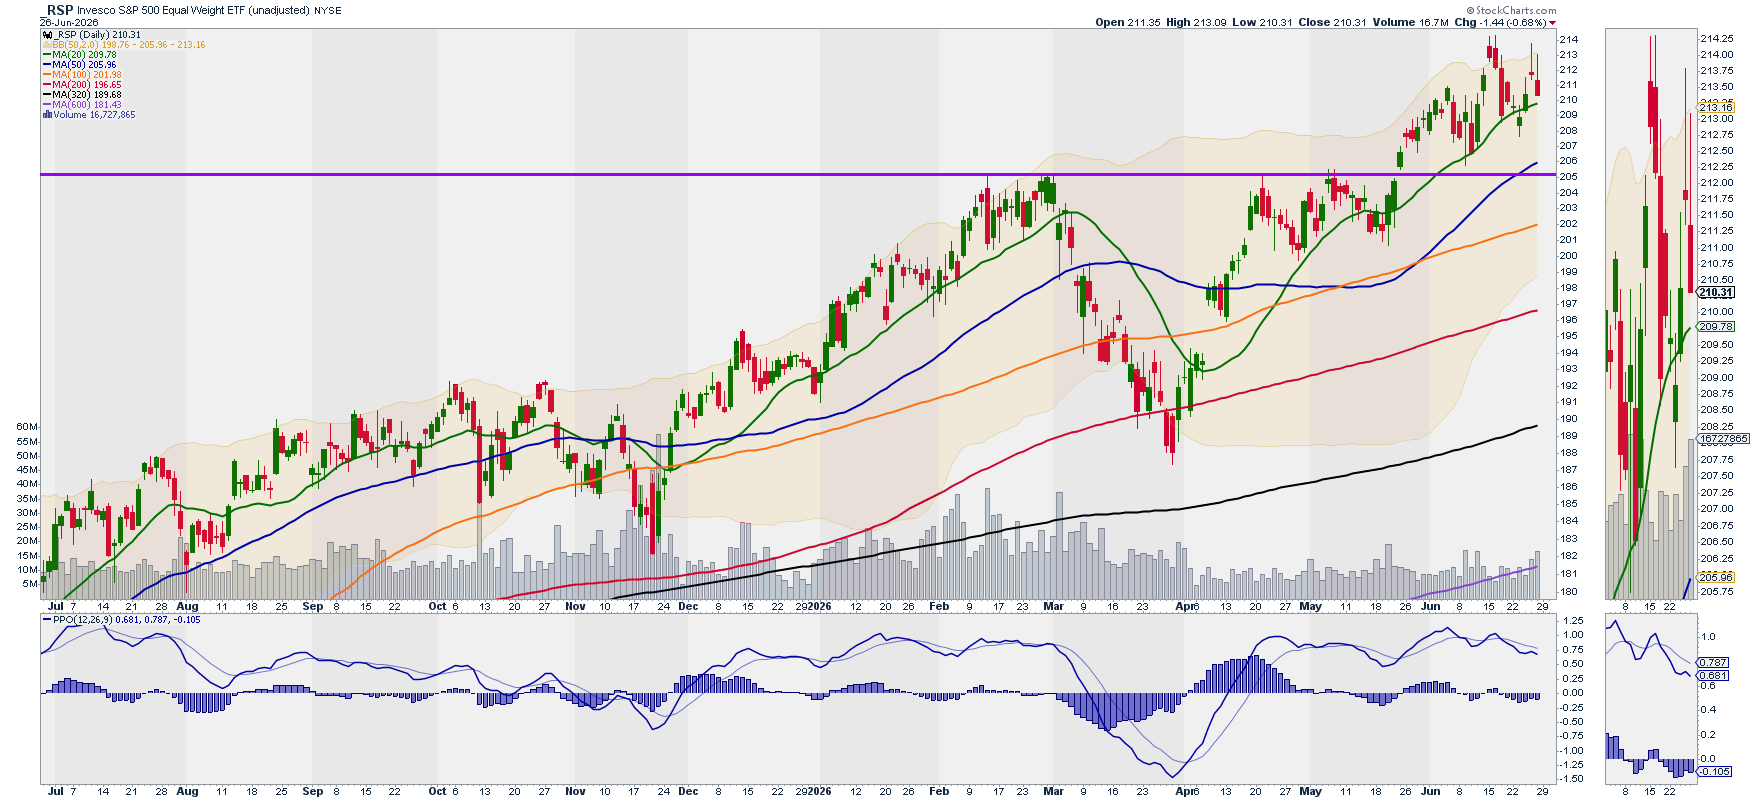
Analysis: Having failed to break above previous ATH, the equal weight index is still holding above its 20D SMA but with a PPO trending lower.
Current Situation: Neutral
Future Outlook: Bearish
Breadth: RSP vs. SPY relative performance
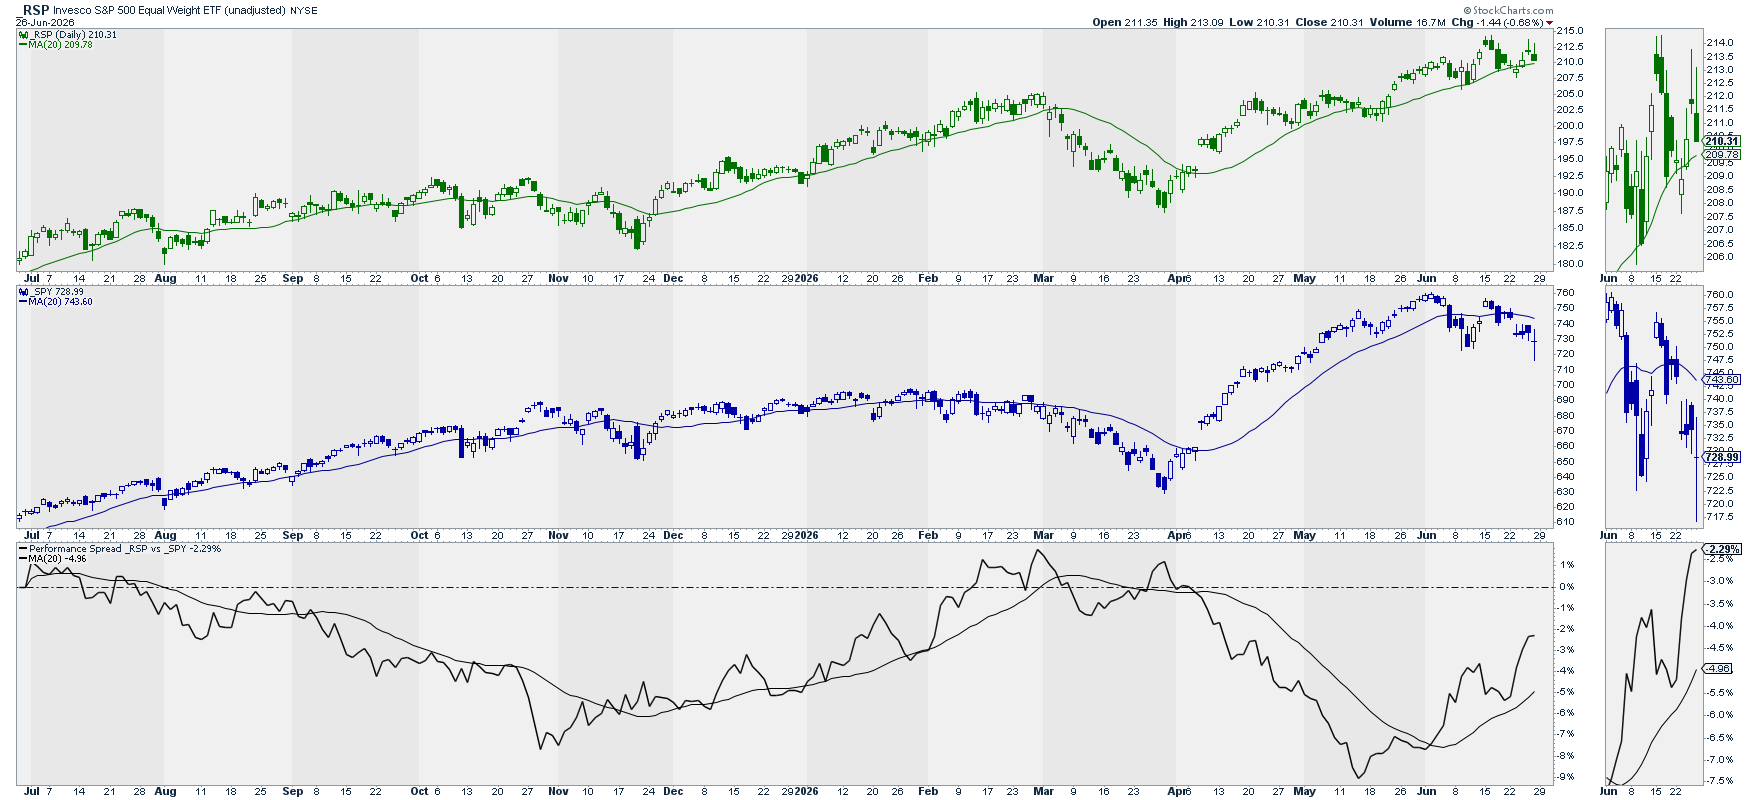
Analysis: RSP (green) vs. SPY (blue) ratio (black) increased, meaning we are in a “Breadth Expansion” situation with an outlook of “Expansion” as per the 20D SMA slope.
Current Situation: Expansion
Future Outlook: Expansion
Breadth: % Stocks above SMAs vs. RSP
Above 200 Daily SMA
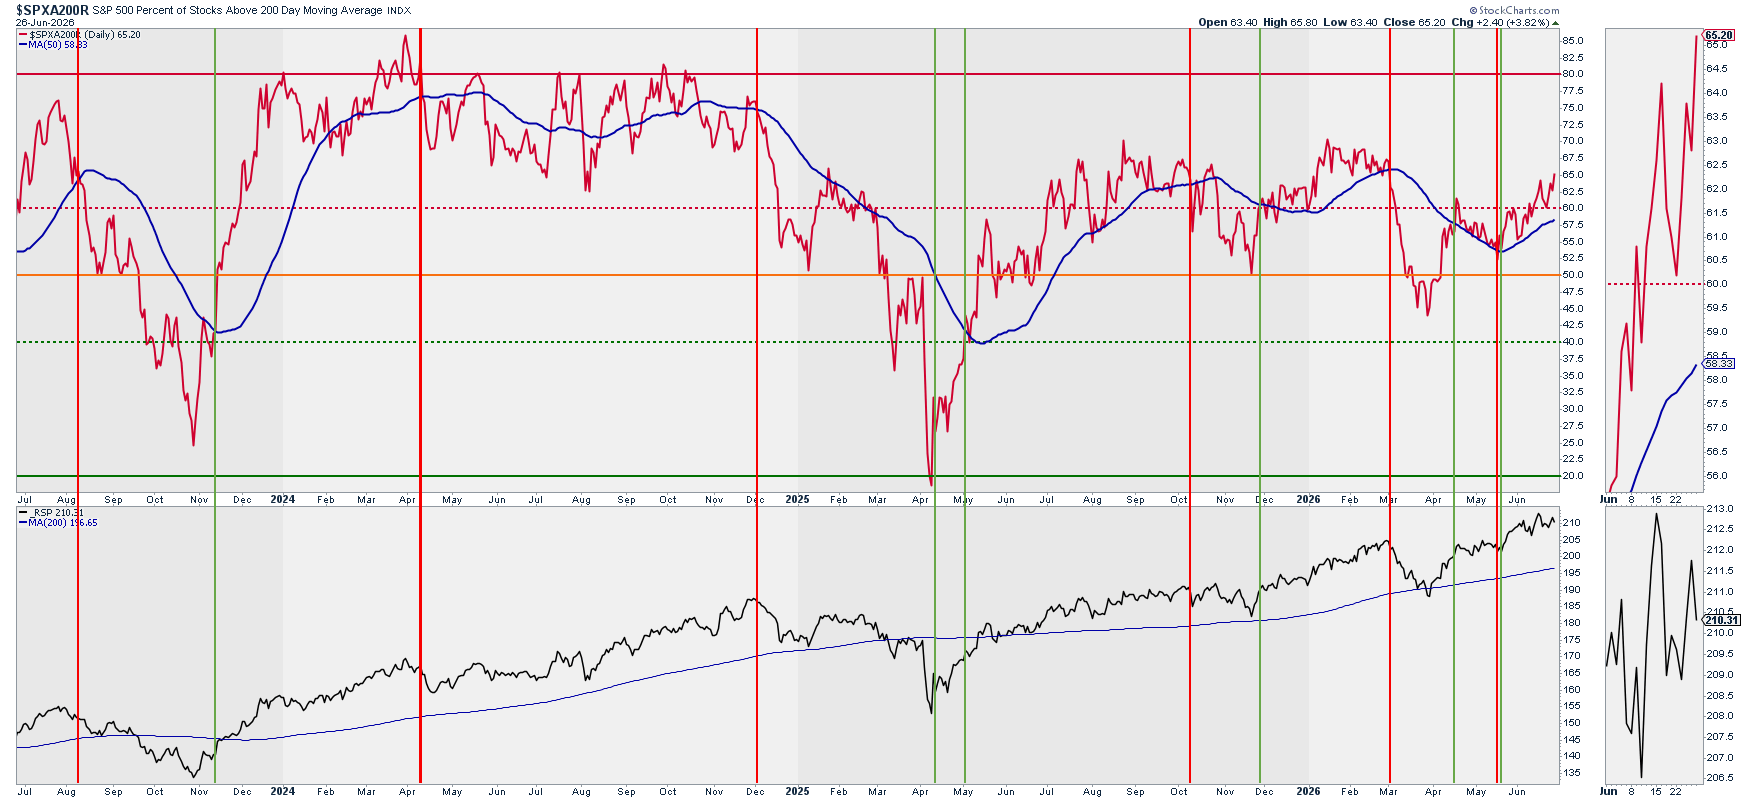
Above 20, 50, and 200 Daily SMAs
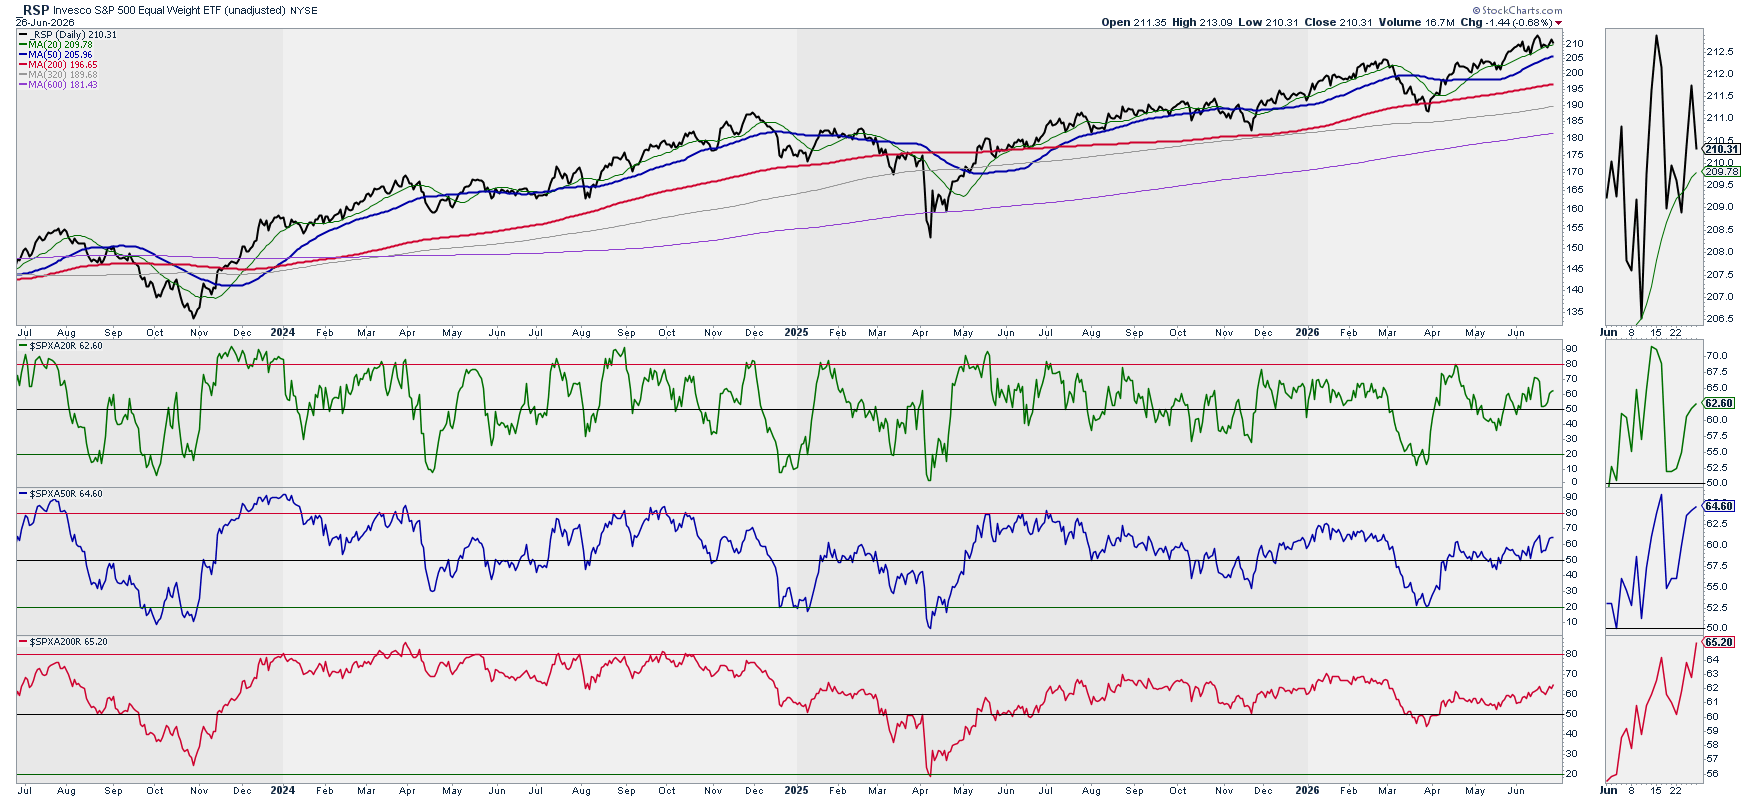
Analysis: Breadth is expanding and we have room to run. We remain on bullish territory.
Current Situation: Bullish
Future Outlook: Bullish
Breadth: New Highs vs. RSP & SPY
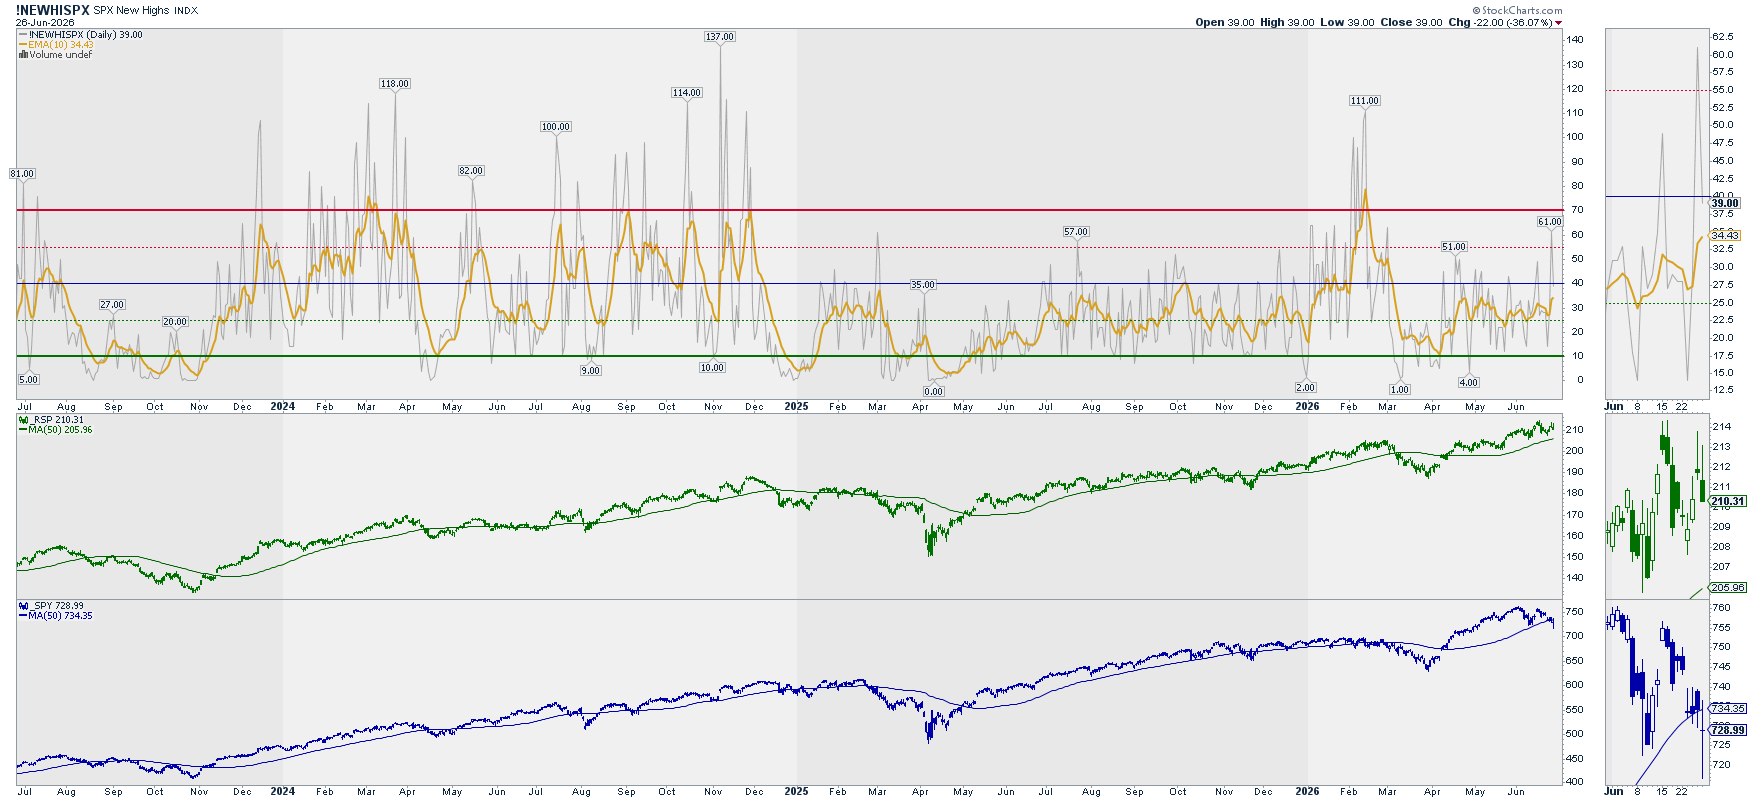
Analysis: We see a new highs extreme high, which may signal a local top. The EMA signal line (yellow) slope is bullish. We remain on a bullish outlook.
Current Situation: Bearish
Future Outlook: Bullish
Breadth & Volatility: Bullish Pct. Index & McClellan Summation Index
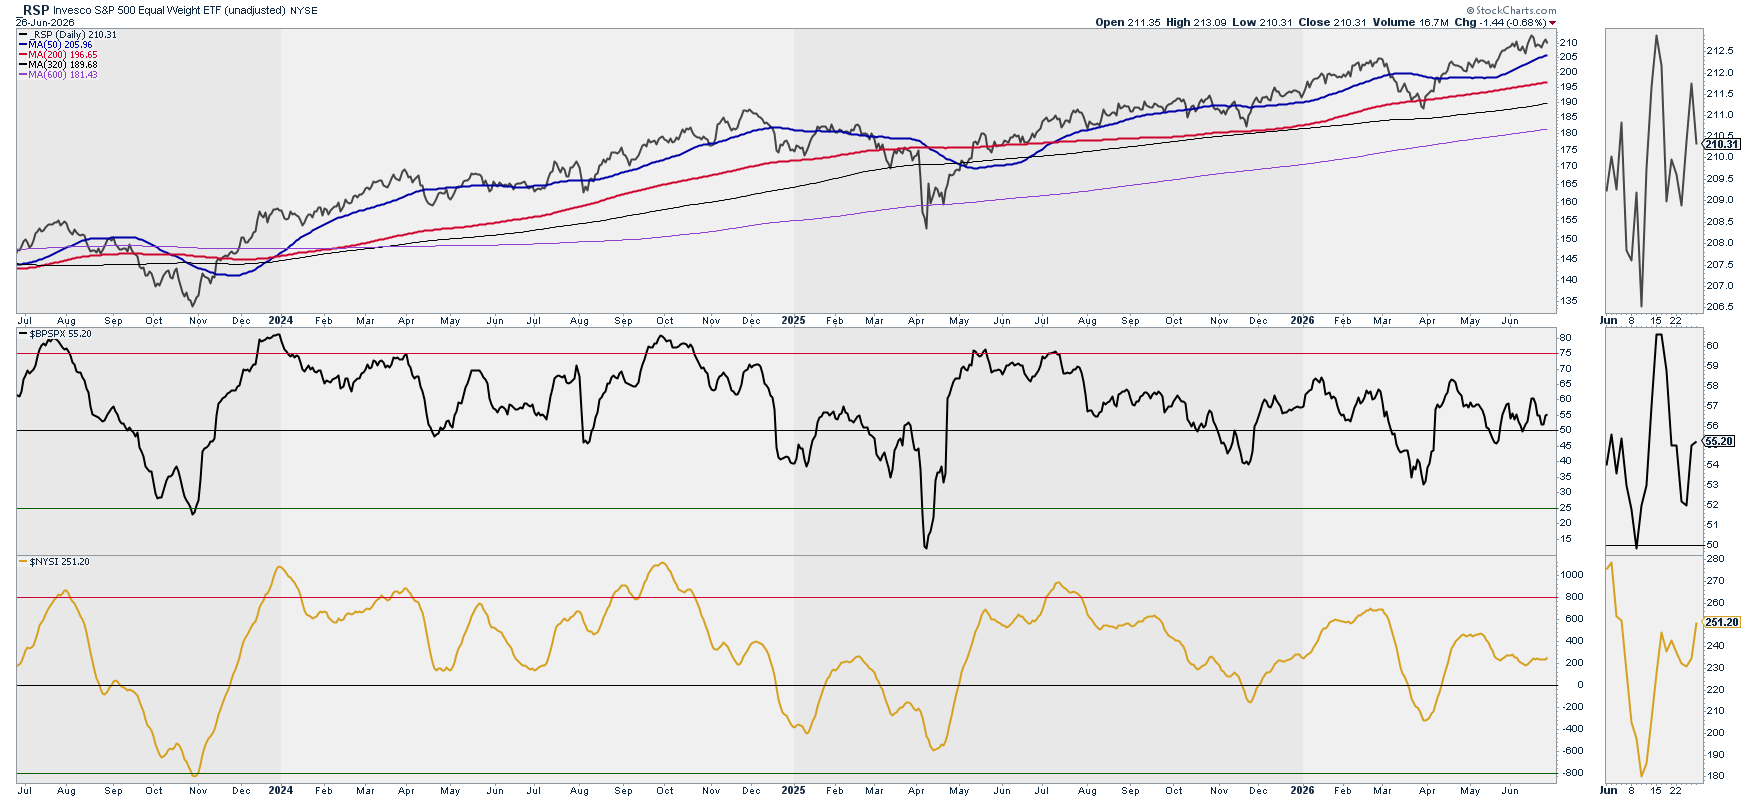
Analysis: Both indicators continue in their bullish areas with quite a mute week.
Current Situation: Bullish
Future Outlook: Bullish
Volatility: Ratio Low Vol. Stocks / SPY vs. RSP & SPY
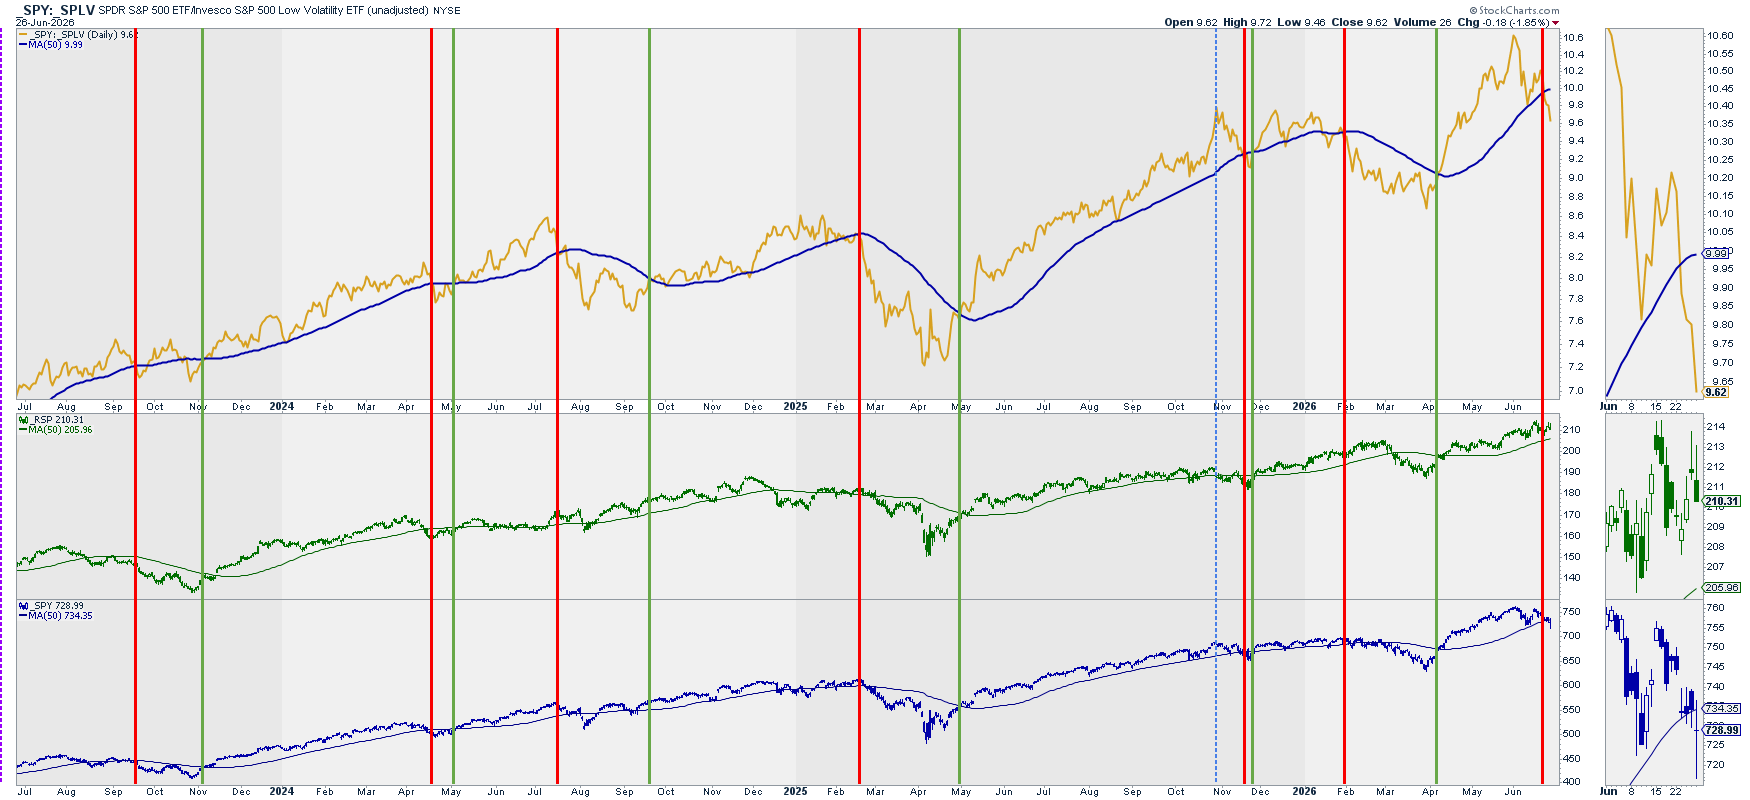
Analysis: This very reliable ratio have just triggered the bearish signal.
Current Situation: Bearish
Future Outlook: Bearish
Volatility: VIX vs. RSP & SPY
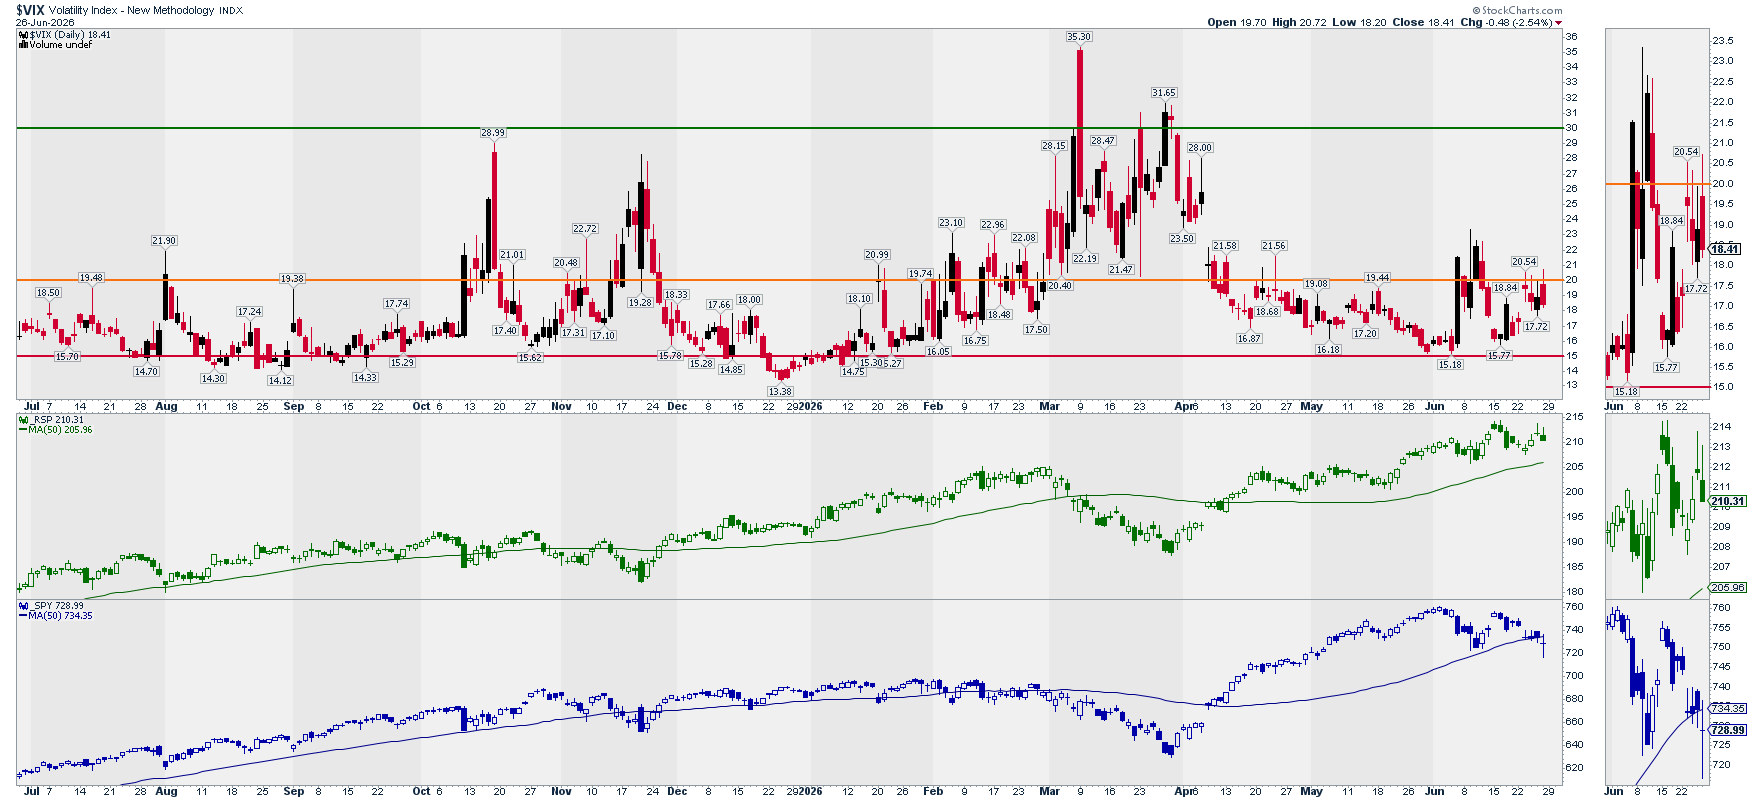
Note: This chart is mainly to detect market bottoms.
Analysis: Increase in volatility from the two-weeks ago lows.
Current Situation: Bearish
Future Outlook: Neutral
Options: (Inverted) Put/Call Ratio vs. SPY
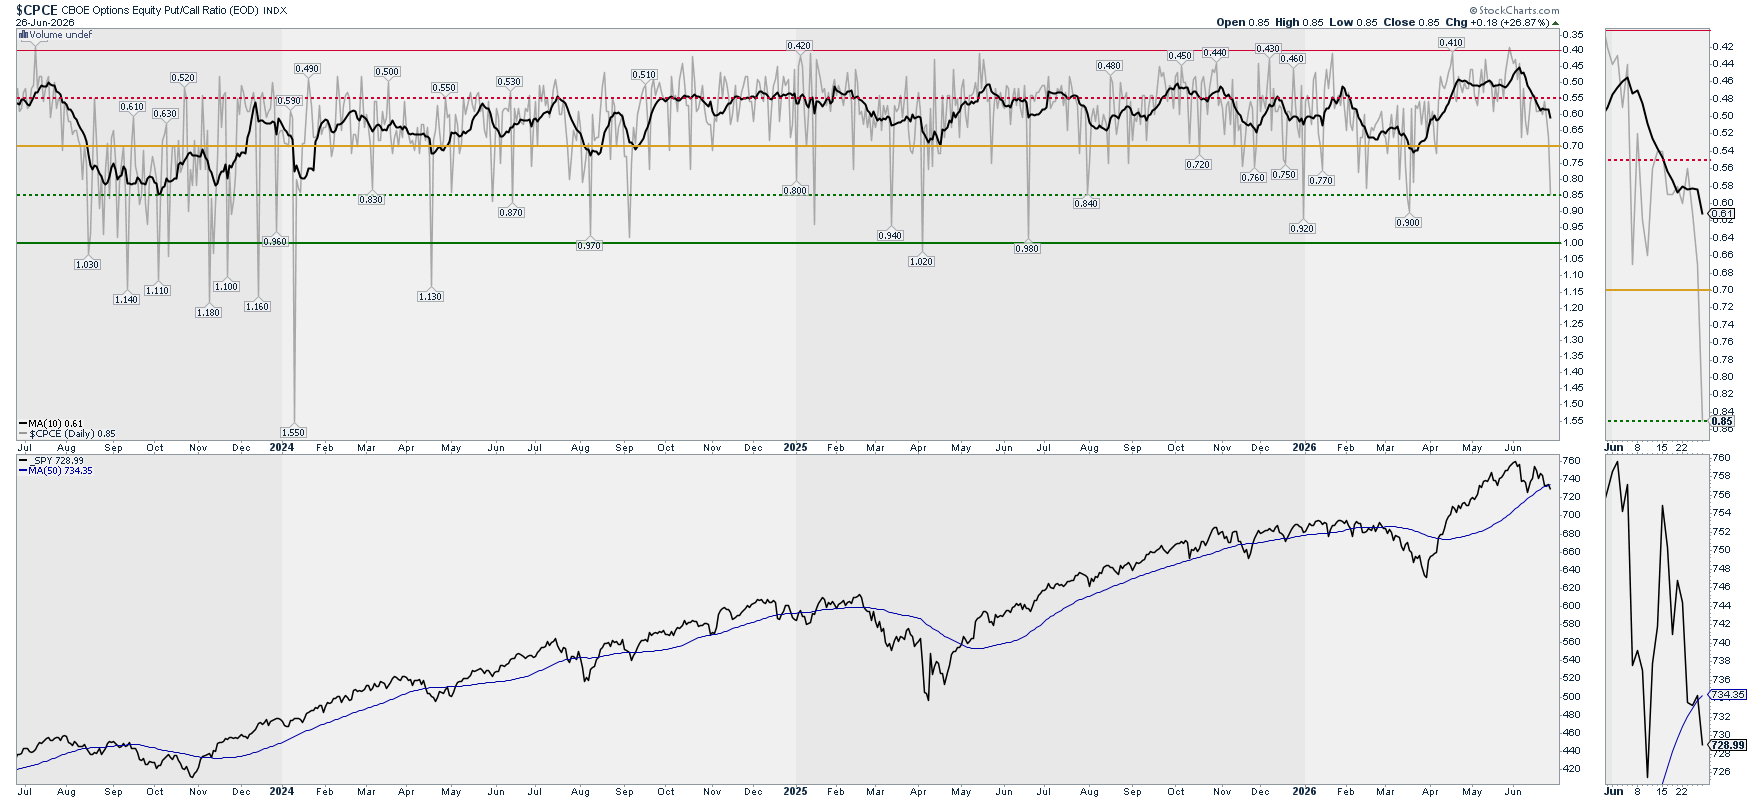
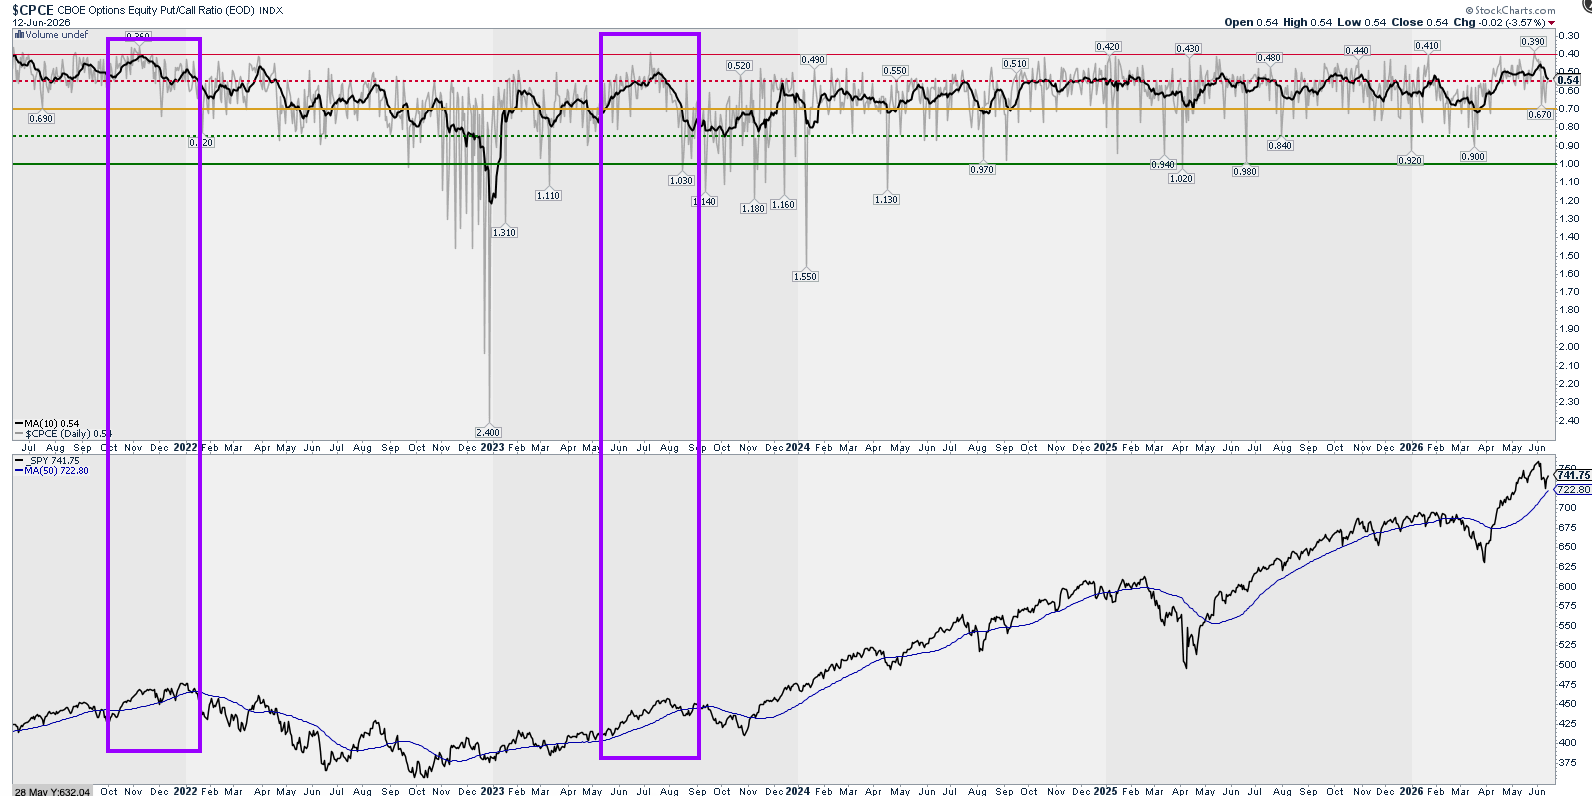
Analysis: Low spot reading (gray) which will push lower the signal (black) line, and the market with it.
Current Situation: Bearish
Future Outlook: Bearish
Options: Gamma Exposure – SPY
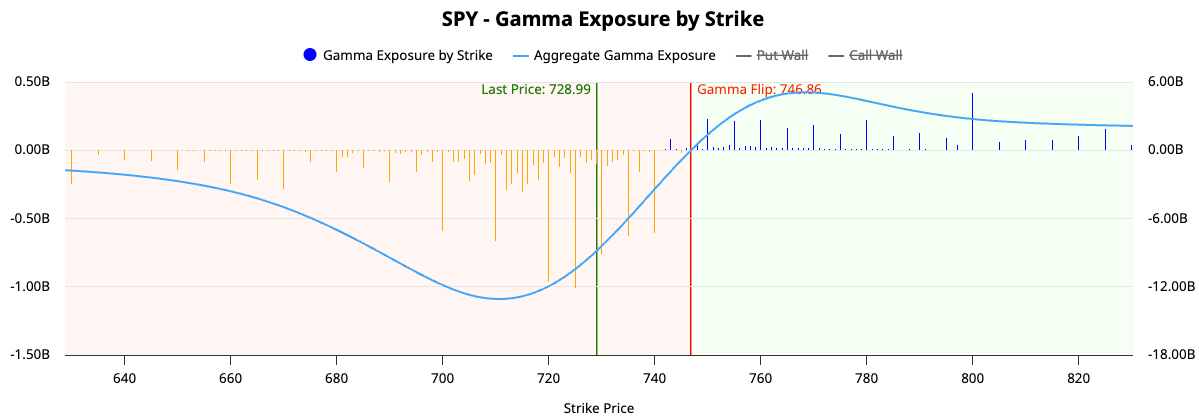
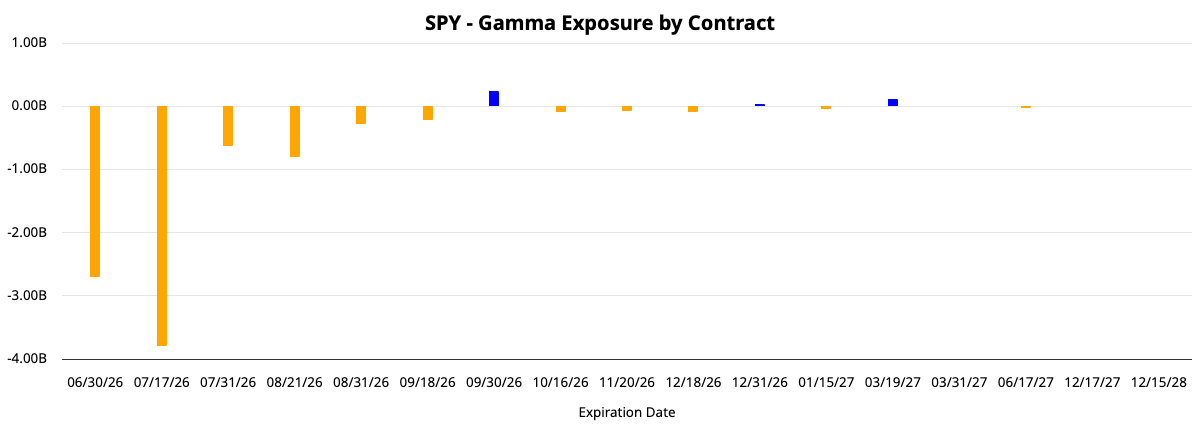
Analysis: Open interest GEX is negative with the last support at 720. July the 17th has the most negative GEX accumulation.
Current Situation: Bearish
Future Outlook: Bearish
Level 2: What is happening? Summary
Price Action: Bearish/Bearish
Breadth: Neutral/Bullish
Volatility: Bearish/Bearish
Options: Bearish/Bearish
Level 3: Where is it happening?
Bulls vs. Bears: RSP vs. RSPD (Cons. Disc. – Bulls) and RSPS (Cons. Sta. – Bears)
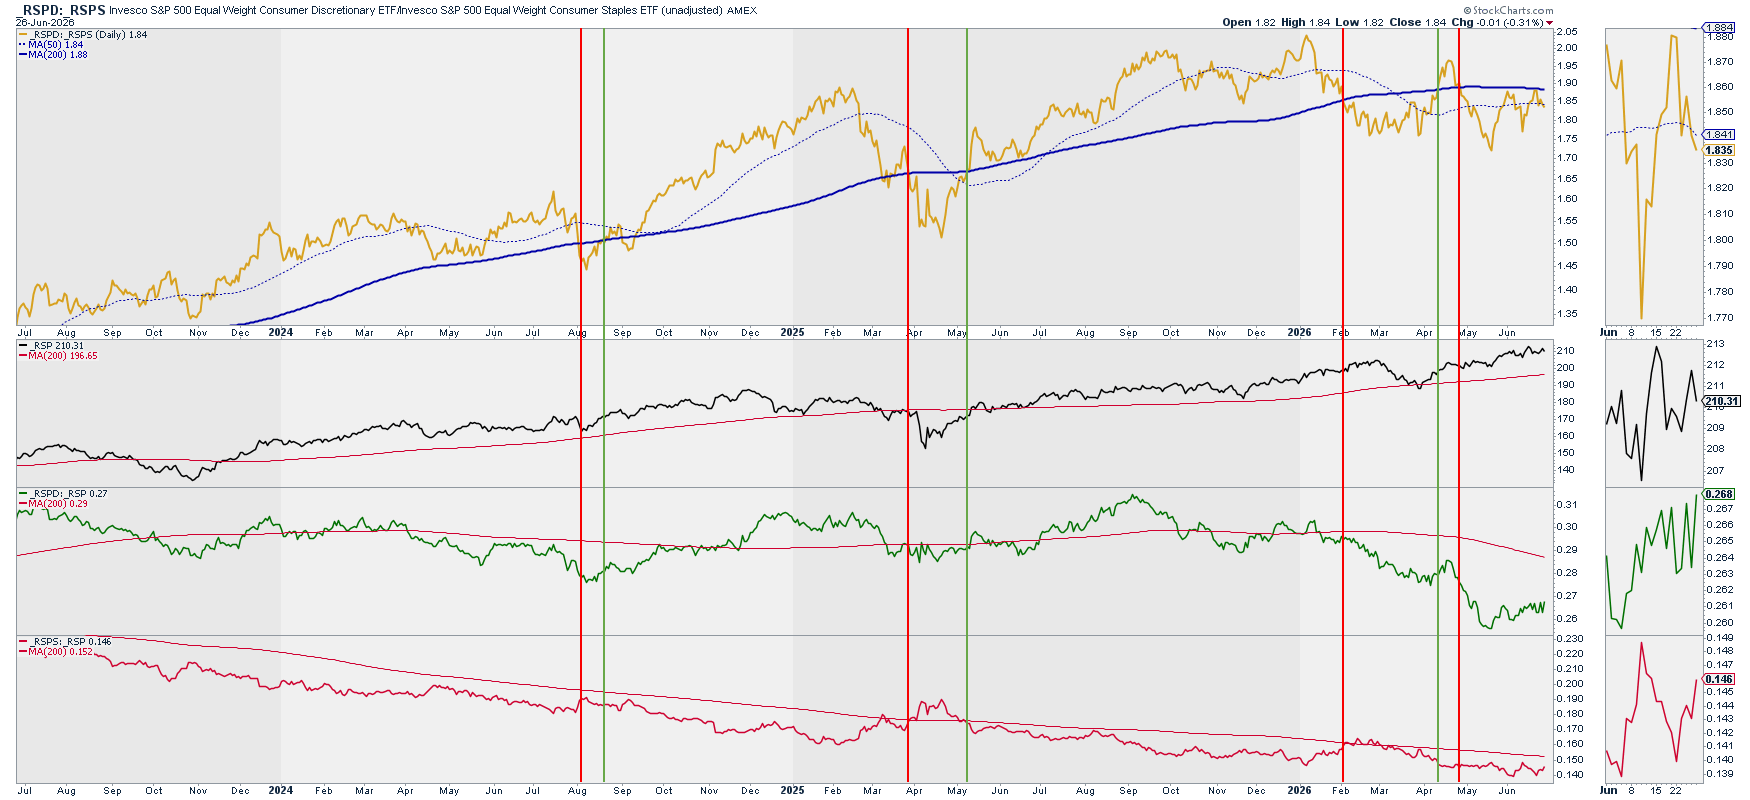
Analysis: Ratio (yellow)failed to break above the 200D SMA and also broke below the 50D SMA.
Current Situation: Bearish
Future Outlook: Bearish
Sectors Rotation
Sectors Performance
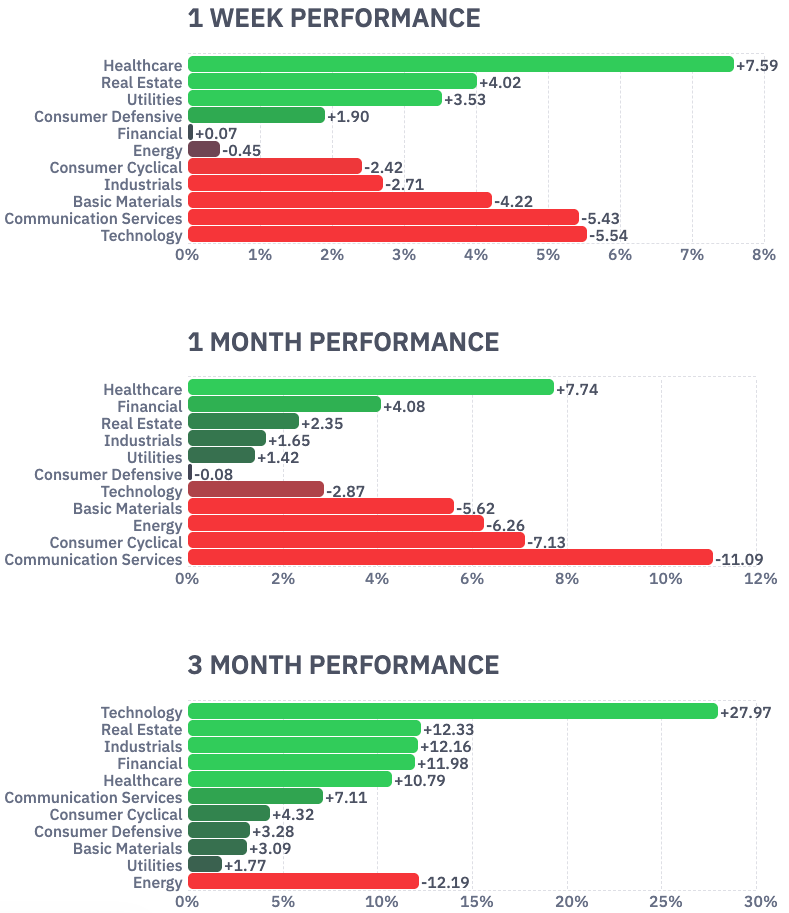
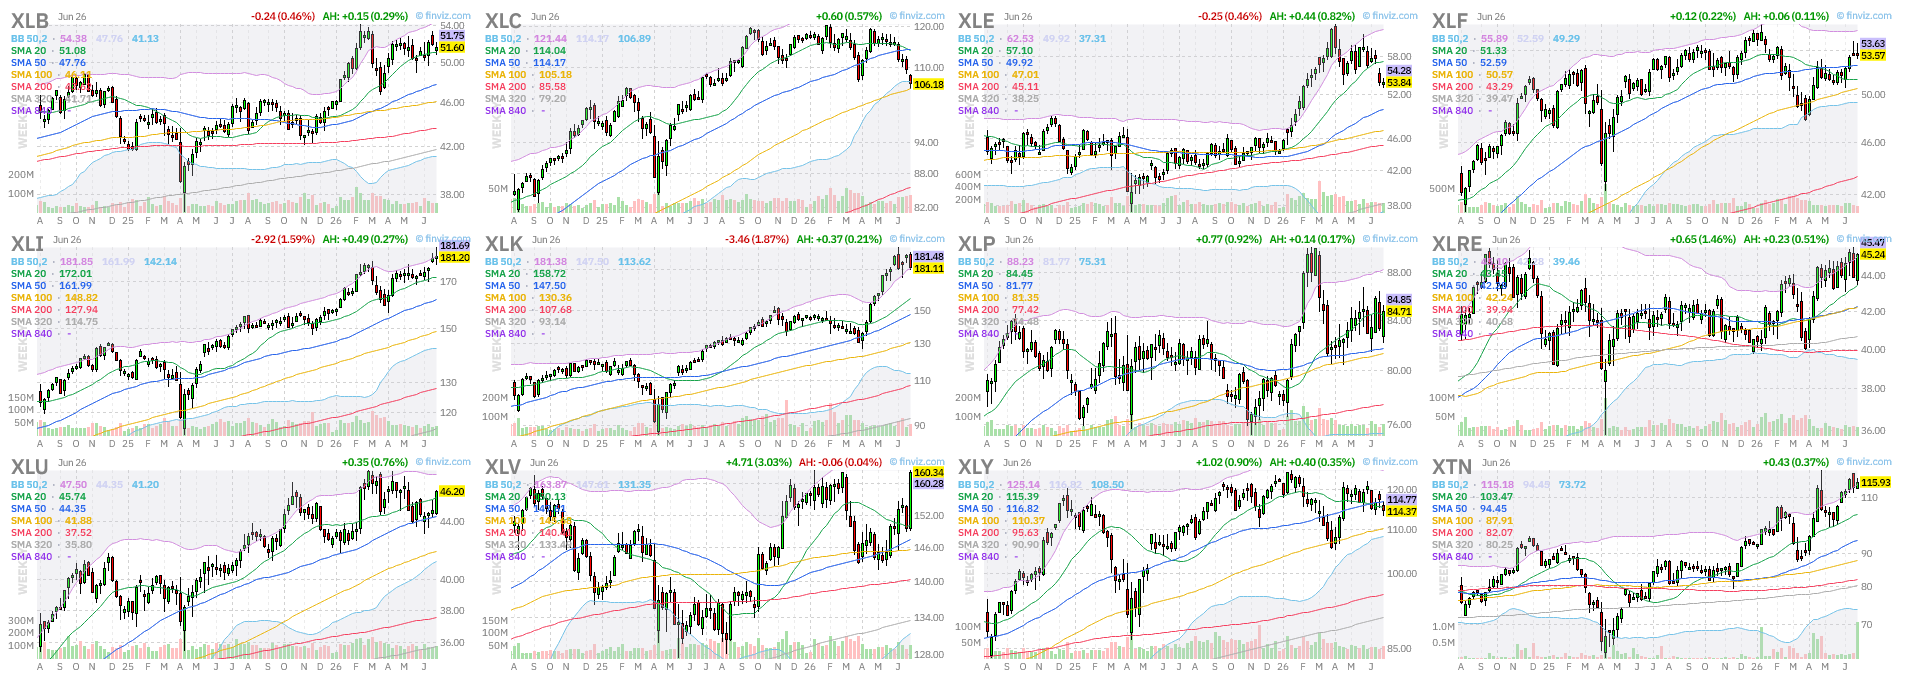
Healthcare (XLV) has been this week’s star and is about to break out of a long-term high. Industrials (XLI) continue with the bullish trend. Energy (XLE) is feeling the pain from the Iran war ceasefire. Both Communications (XLC) and Technology (XLK) are dragging the main indexes down.
Sectors Bullish Percent Index
Growth Sectors
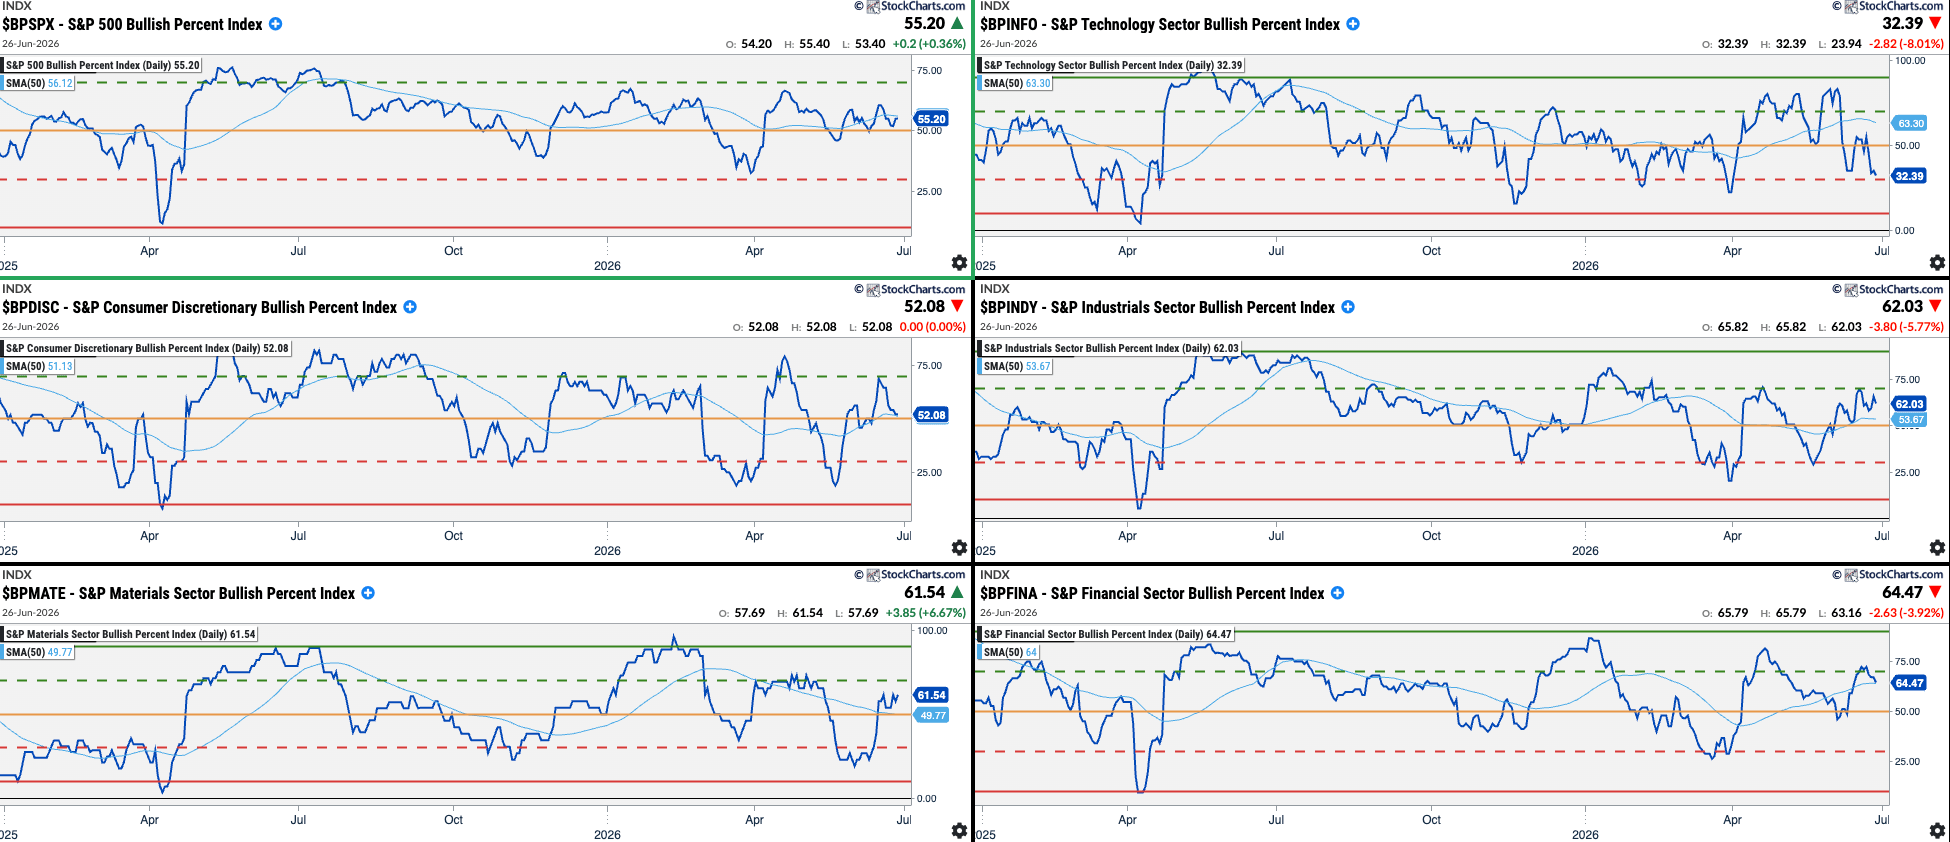
Value Sectors

Note: Any sectors below their red levels are good opportunities to find great companies at good valuations or buy sector ETFs (buy cheap). Those sectors above their Green levels are candidates to be sold (sell expensive).
Current Situation: Bullish - & - Future Outlook: Bullish:
Industrials, Materials, Financials, Utilities
Current Situation: Bullish - & - Future Outlook: Bearish:
Healthcare, C. Disc., Real Estate
Current Situation: Bearish - & - Future Outlook: Bullish:
C.Staples, Energy
Current Situation: Bearish - & - Future Outlook: Bearish:
Technology, Communications
SPX has a Neutral Current Situation and a Neutral Future Outlook.
Level 3: Where is it happening? Summary
Bulls vs. Bears: Neutral
All Levels Summary and Final Thoughts
Level 1 Summary - The Why
Economic Data (long-term): Bullish/Bullish
Interest Rates: Bearish/Neutral
Investors Sentiment: Bearish/Bearish
Level 2 Summary - The What
Price Action: Bearish/Bearish
Breadth: Neutral/Bullish
Volatility: Bearish/Bearish
Options: Bearish/Bearish
Level 3 Summary - The Where
Bulls vs. Bears: Neutral
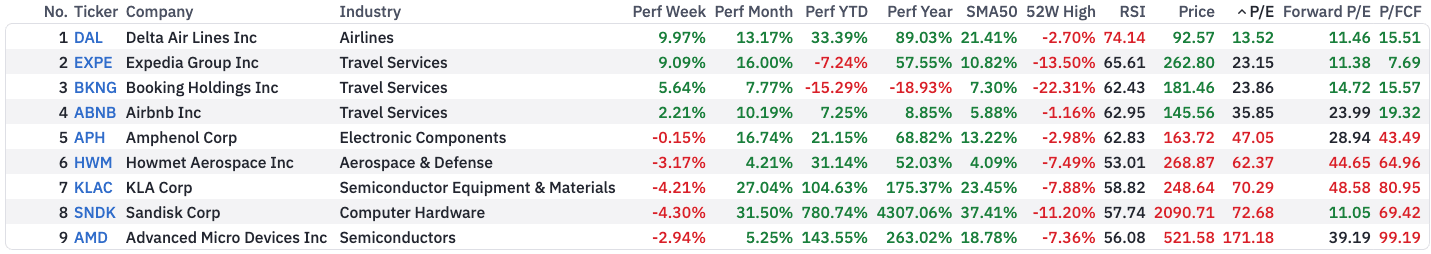
Level 4: Scanning for opportunities
Great Companies with Great Technicals
Descriptive
Index: Any | Market Cap.: +Mid (+$2B) | Option/Short: Yes/Yes
Avg. Volume: >1M | Relative Vol.: Over 1 | Price: >$10
Fundamental
EPS Growth Next Year: >15% | EPS Growth Past 3 Years: >5% | Sales Growth Past 3 Years: >5%
- Sorted by P/E
Technical
Performance: Quarter Up | Price above 20D SMA & 50D SMA | Beta: >1 | ATR: > 1
S&P500 and Nasdaq New Highs
Descriptive
Index: S&P 500 and Nasdaq | Market Cap.: +Mid (+$2B) | Option/Short: Yes/Yes
Avg. Volume: >1M | Price: >$10
(order by Market Cap desc.)
Technical
50-Day New High
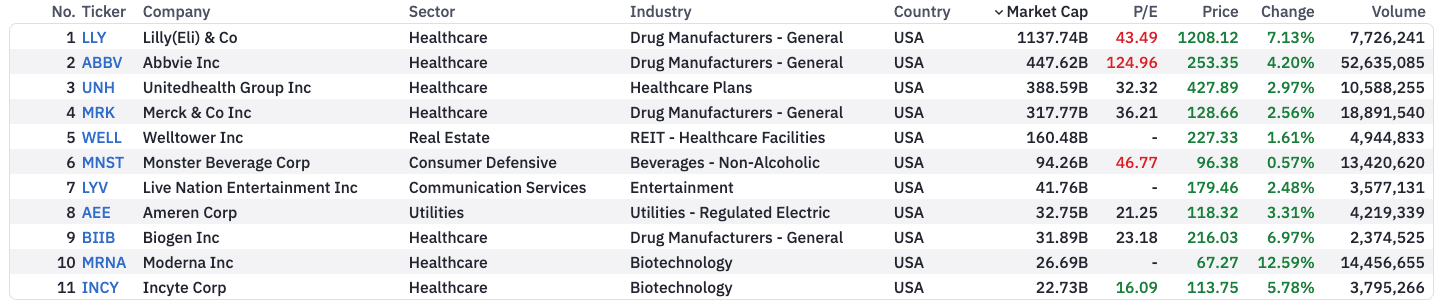
Chart of the week:
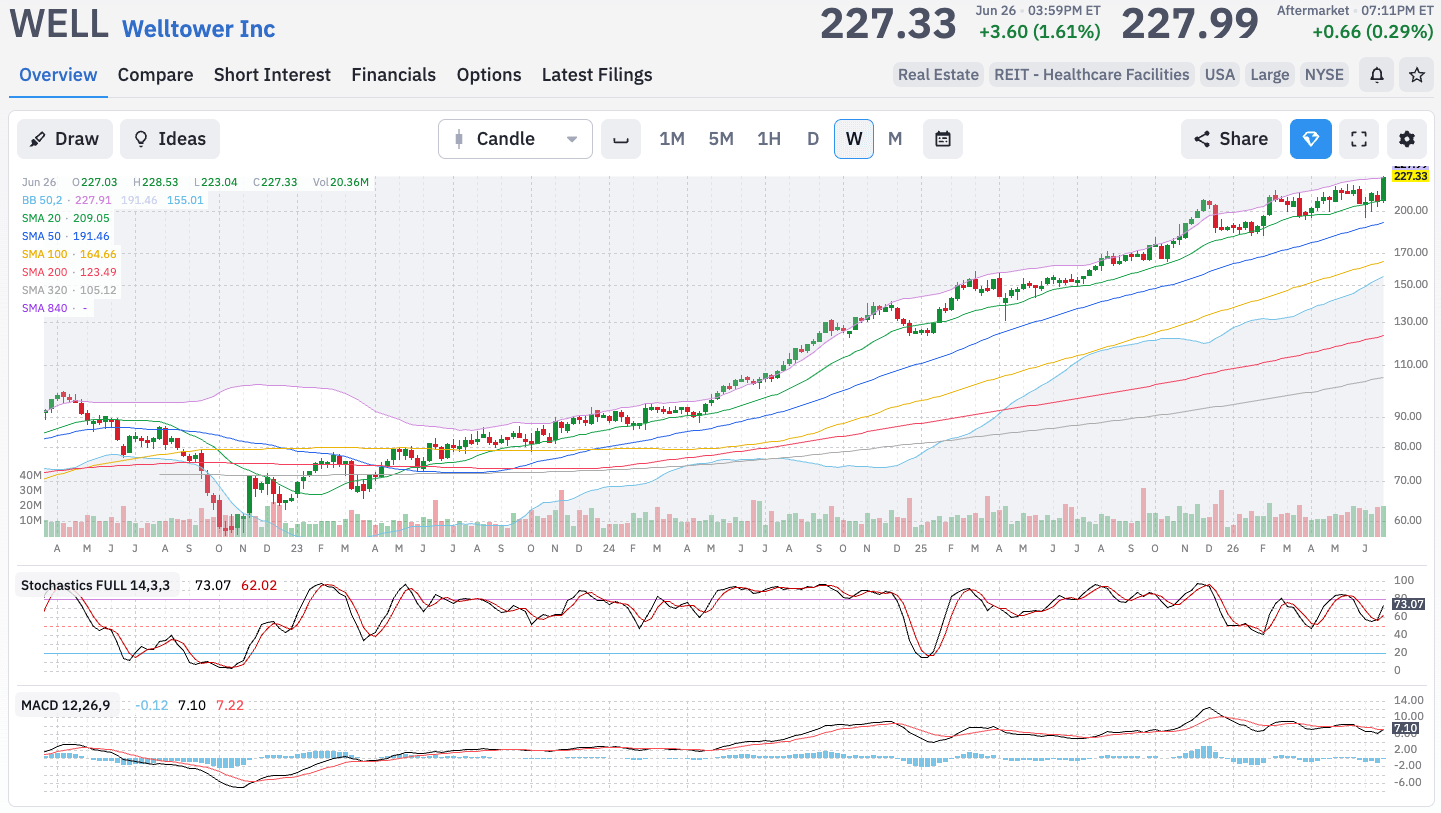
Welltower, both in Healthcare and in Real Estate.
Disclaimer: The content on AMAT Investing is strictly for educational and learning purposes. The author is not a licensed financial advisor and holds no formal financial education. This post does not constitute professional financial advice. All investing involves risk of loss. Always conduct your own research and consult a licensed professional before making any investment decisions.
