Context: Why is it happening?
Economic Production: ISM PMI vs. SPX
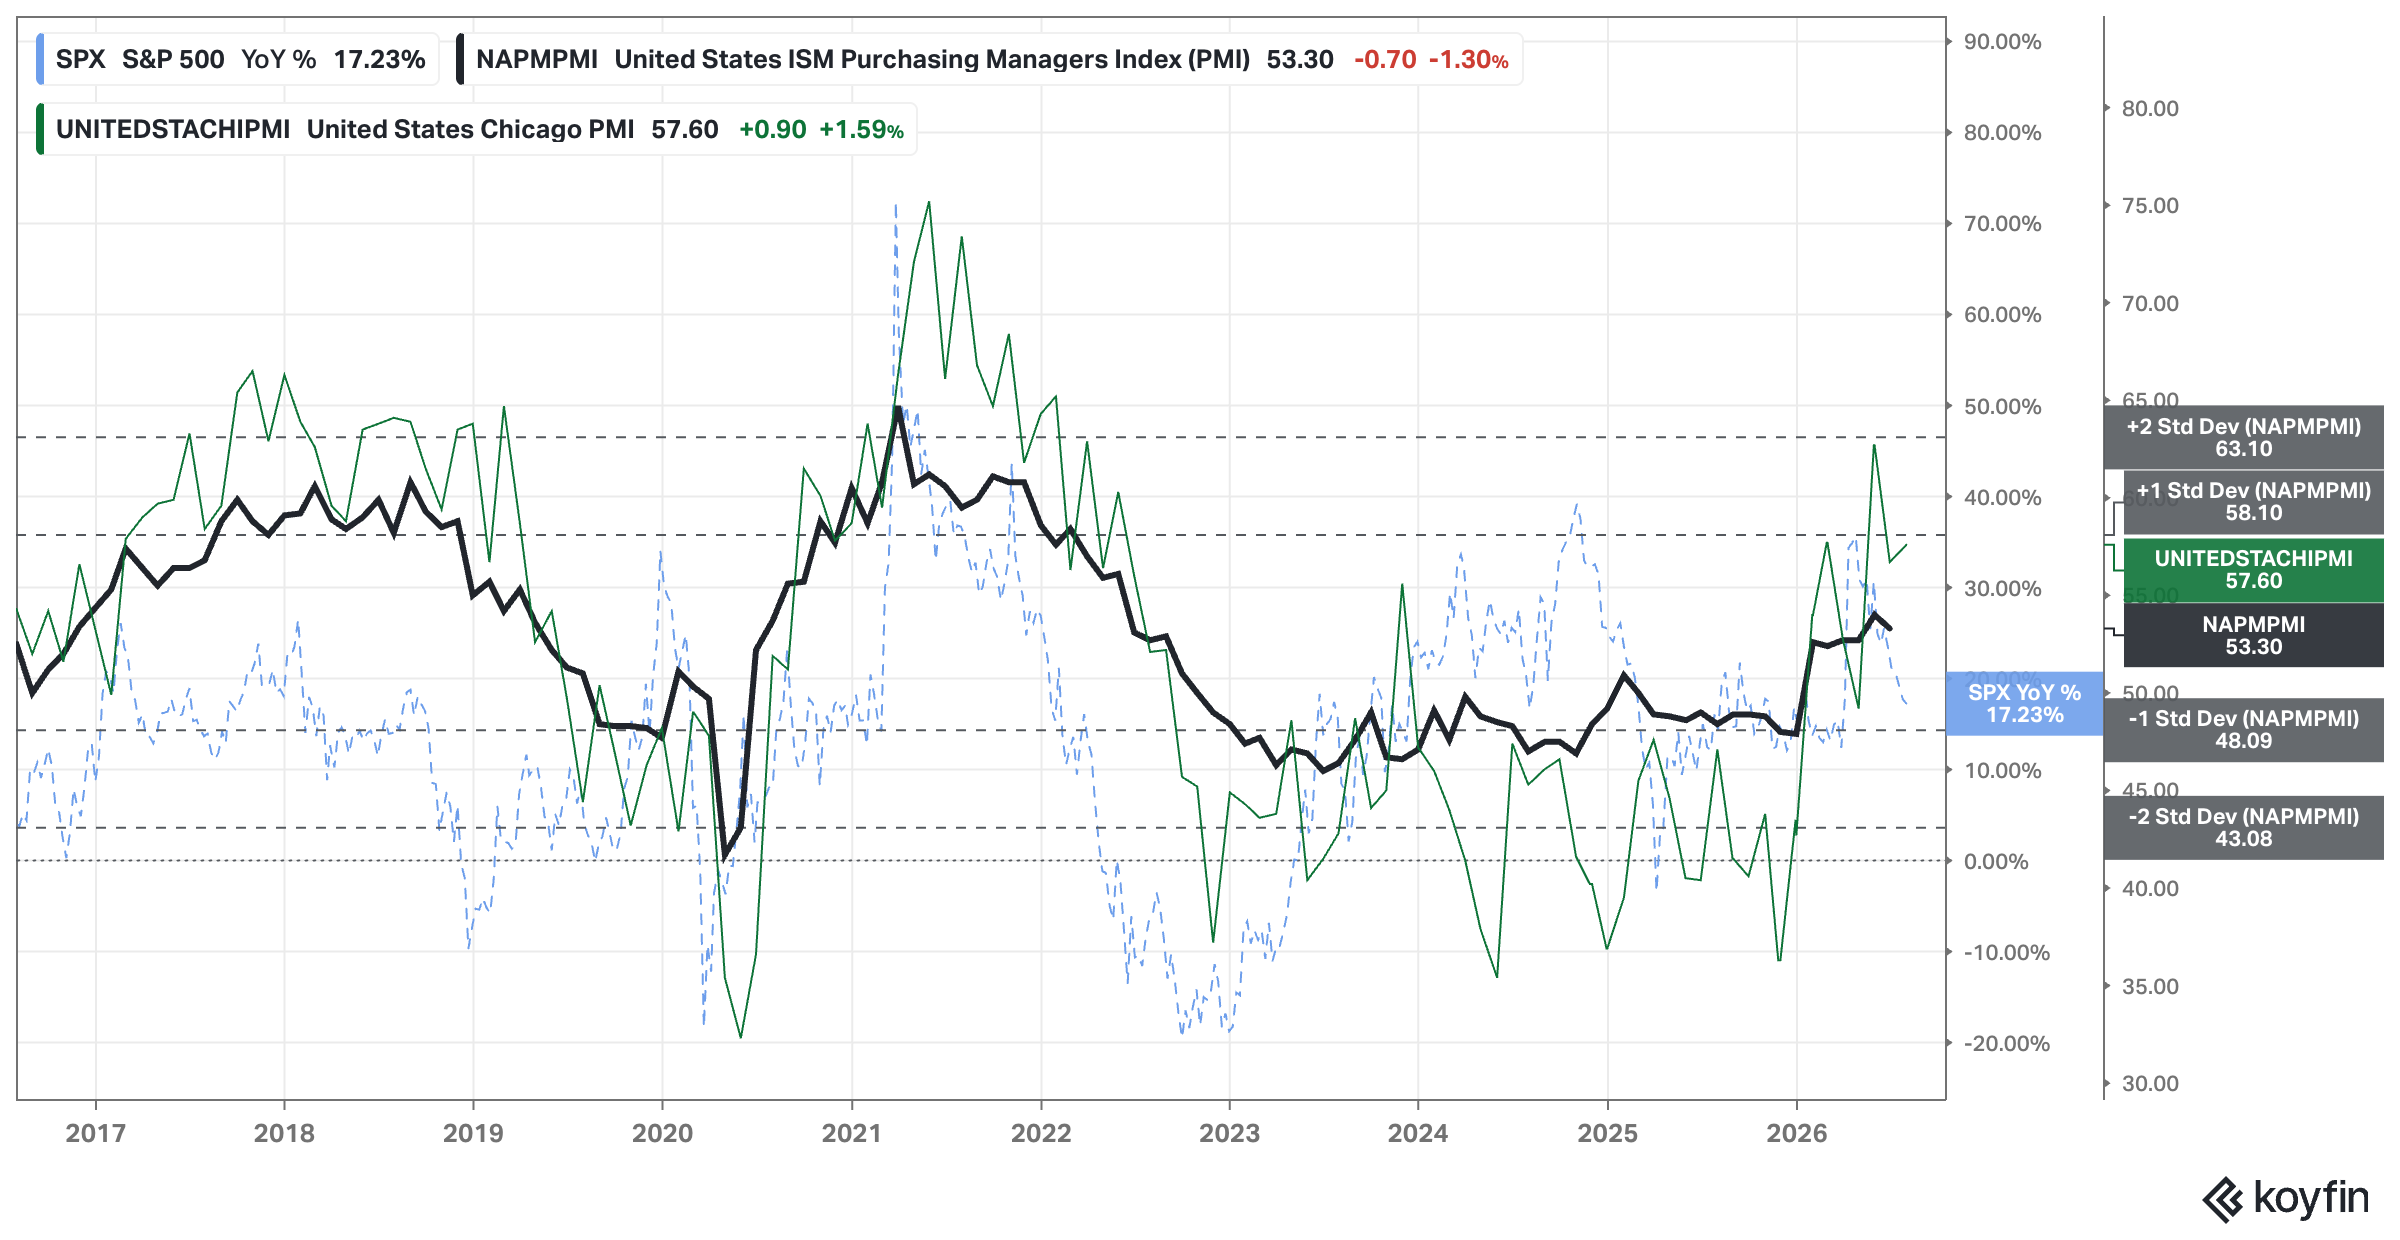
Analysis: Slight increase on Chicago’s PMI.
Outlook: Bullish
Economic Activity: Regional Banks Performance
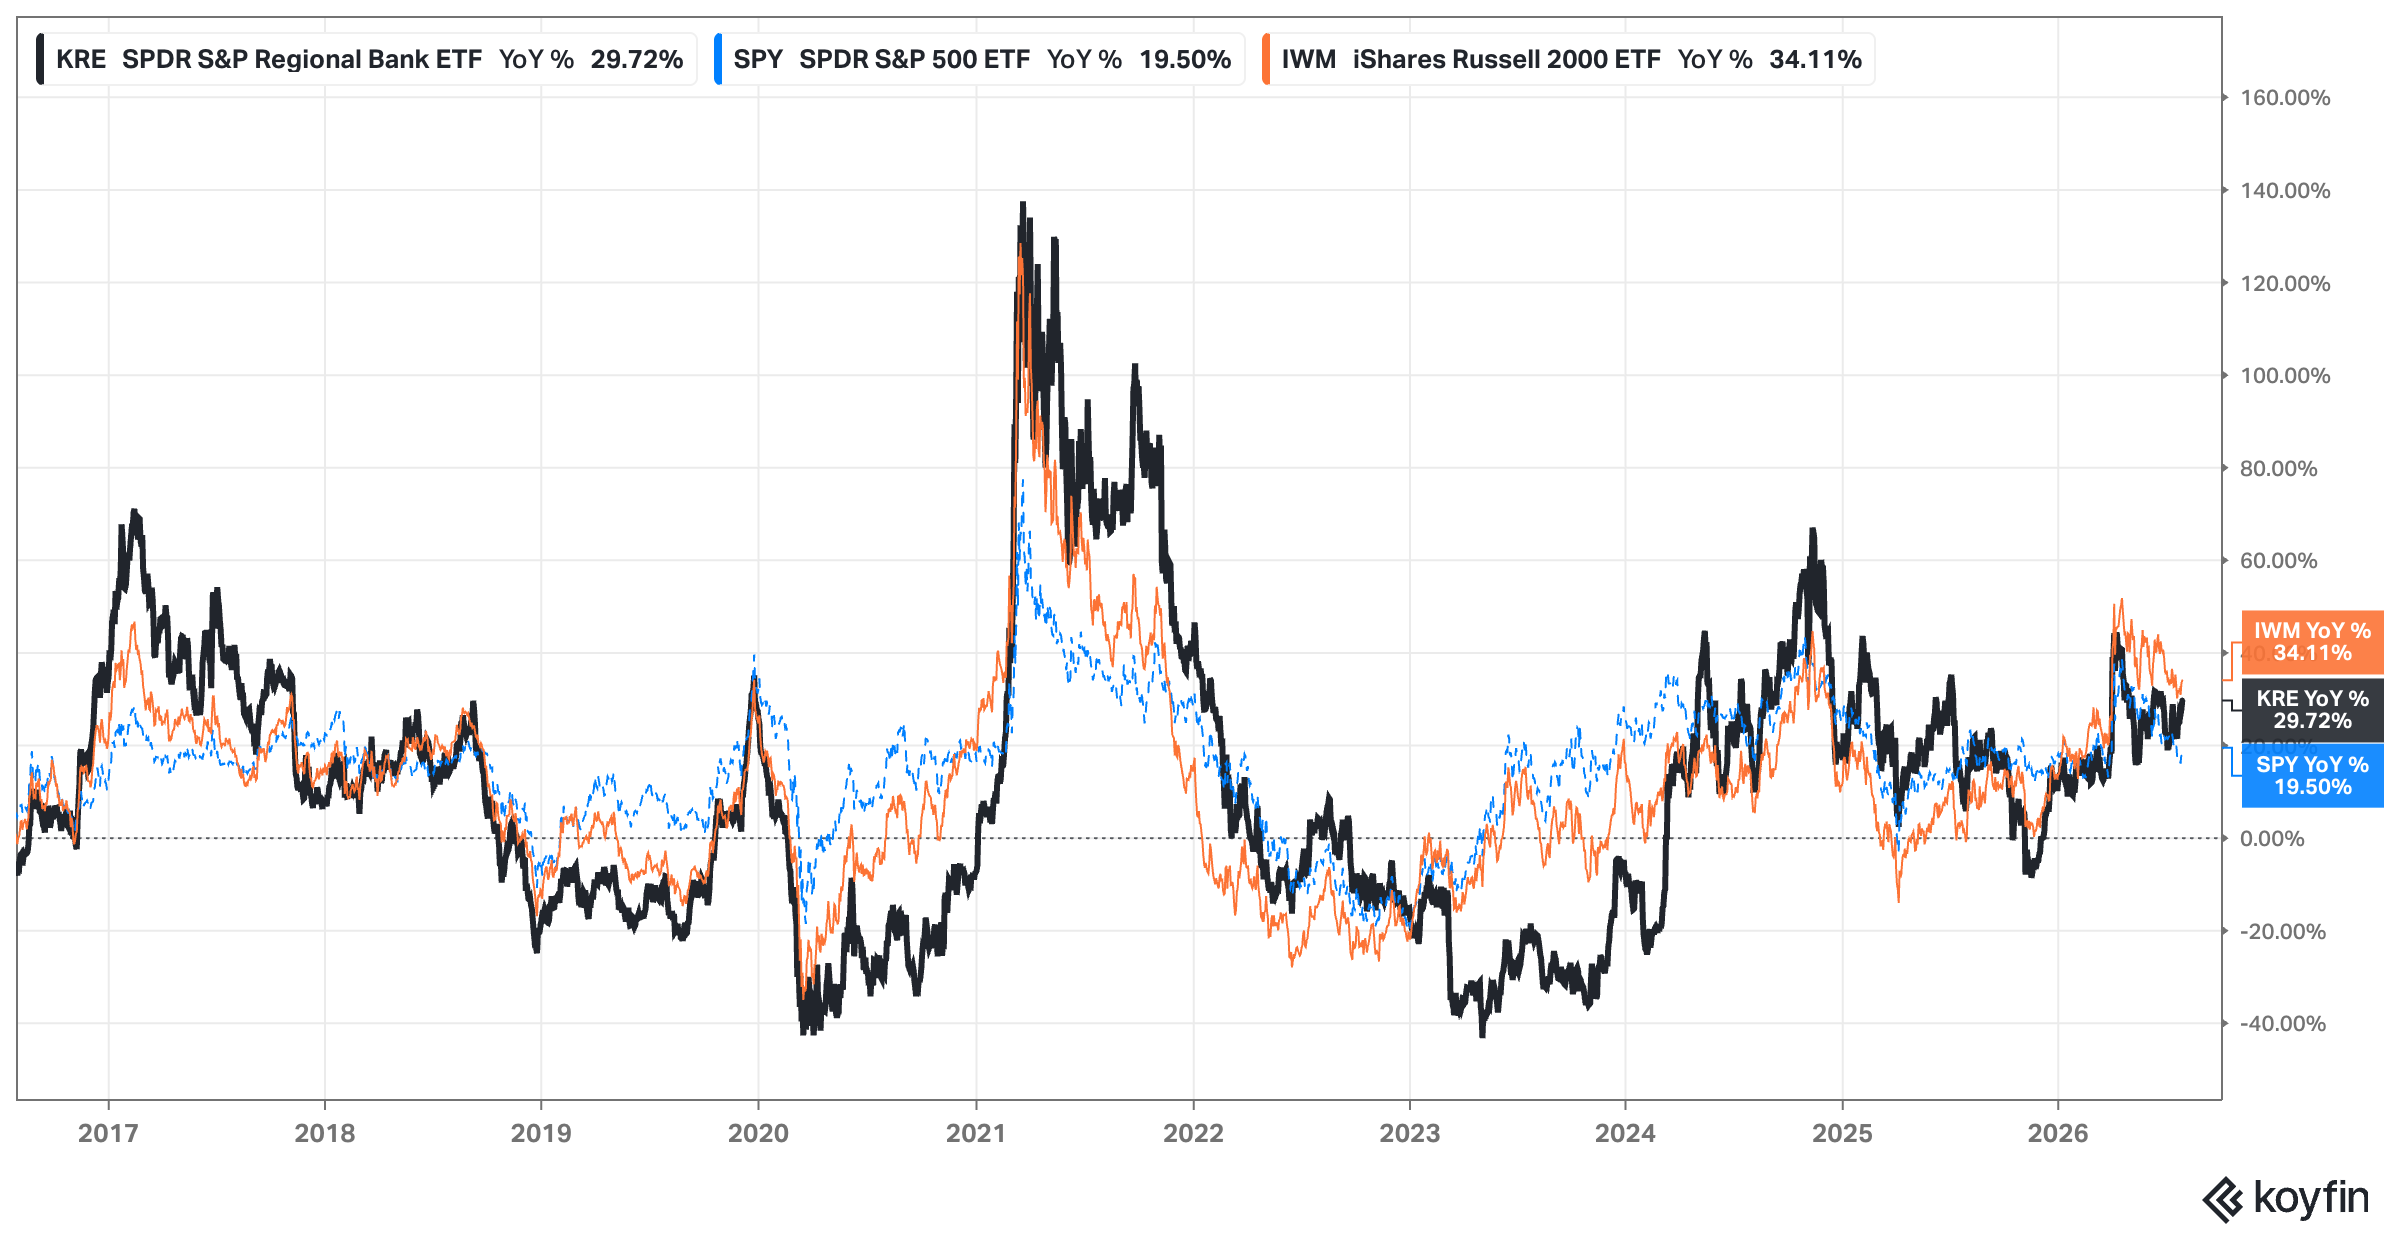
Analysis: KRE is clearly on an uptrend making new higher lows and higher highs.
Outlook: Bullish
Interest Rates: FED, 2yr, 10yr, and 30yr Rates
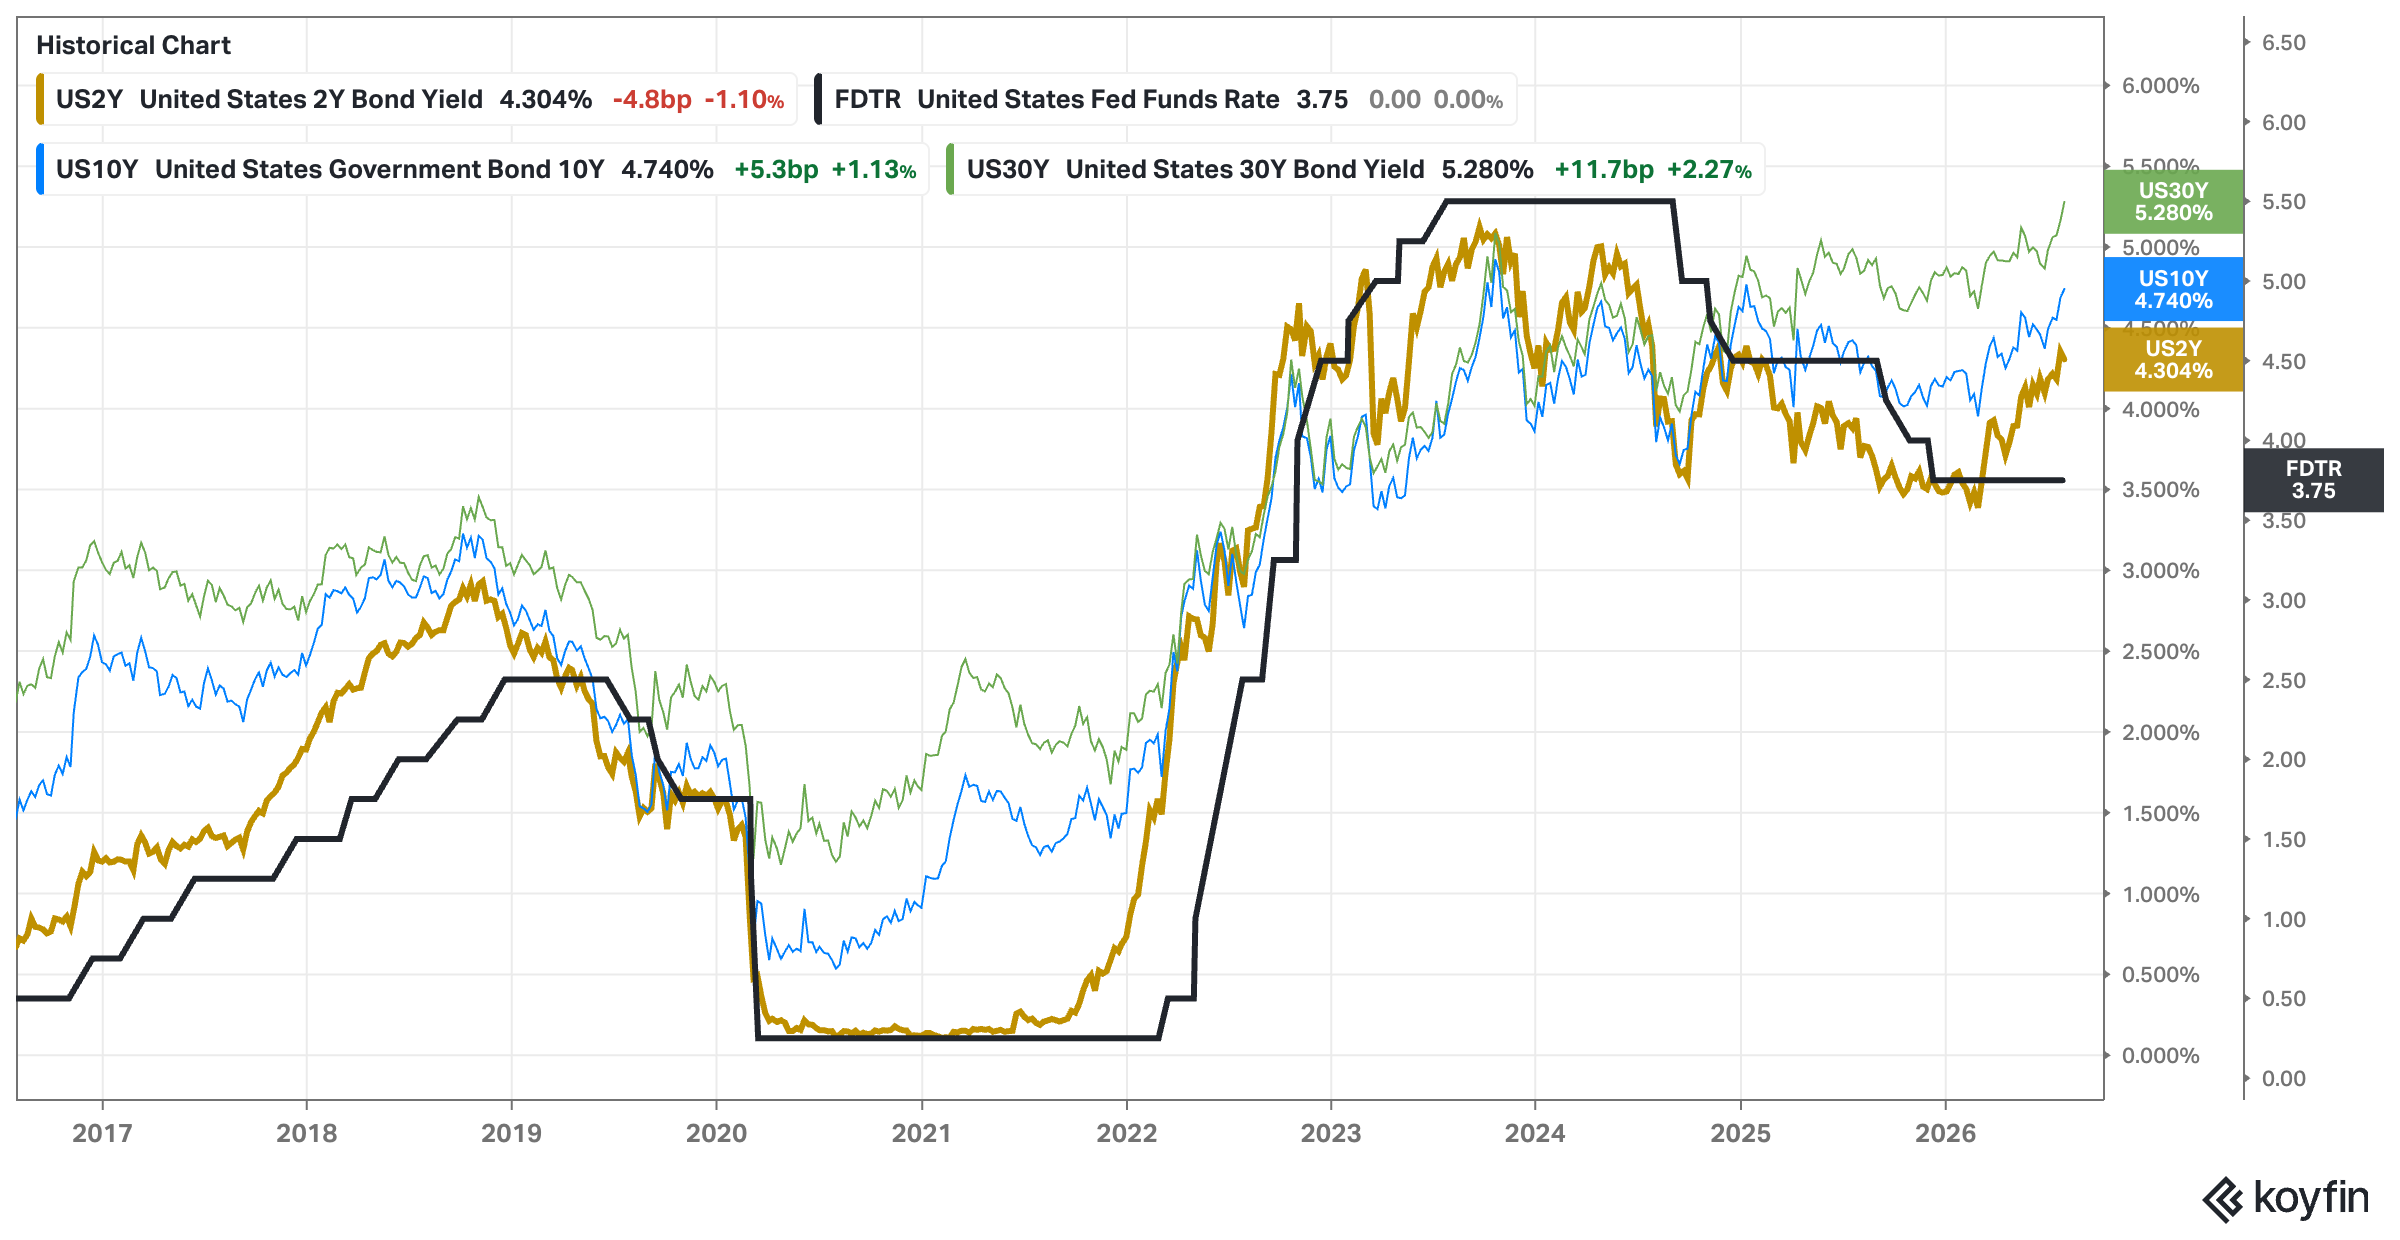
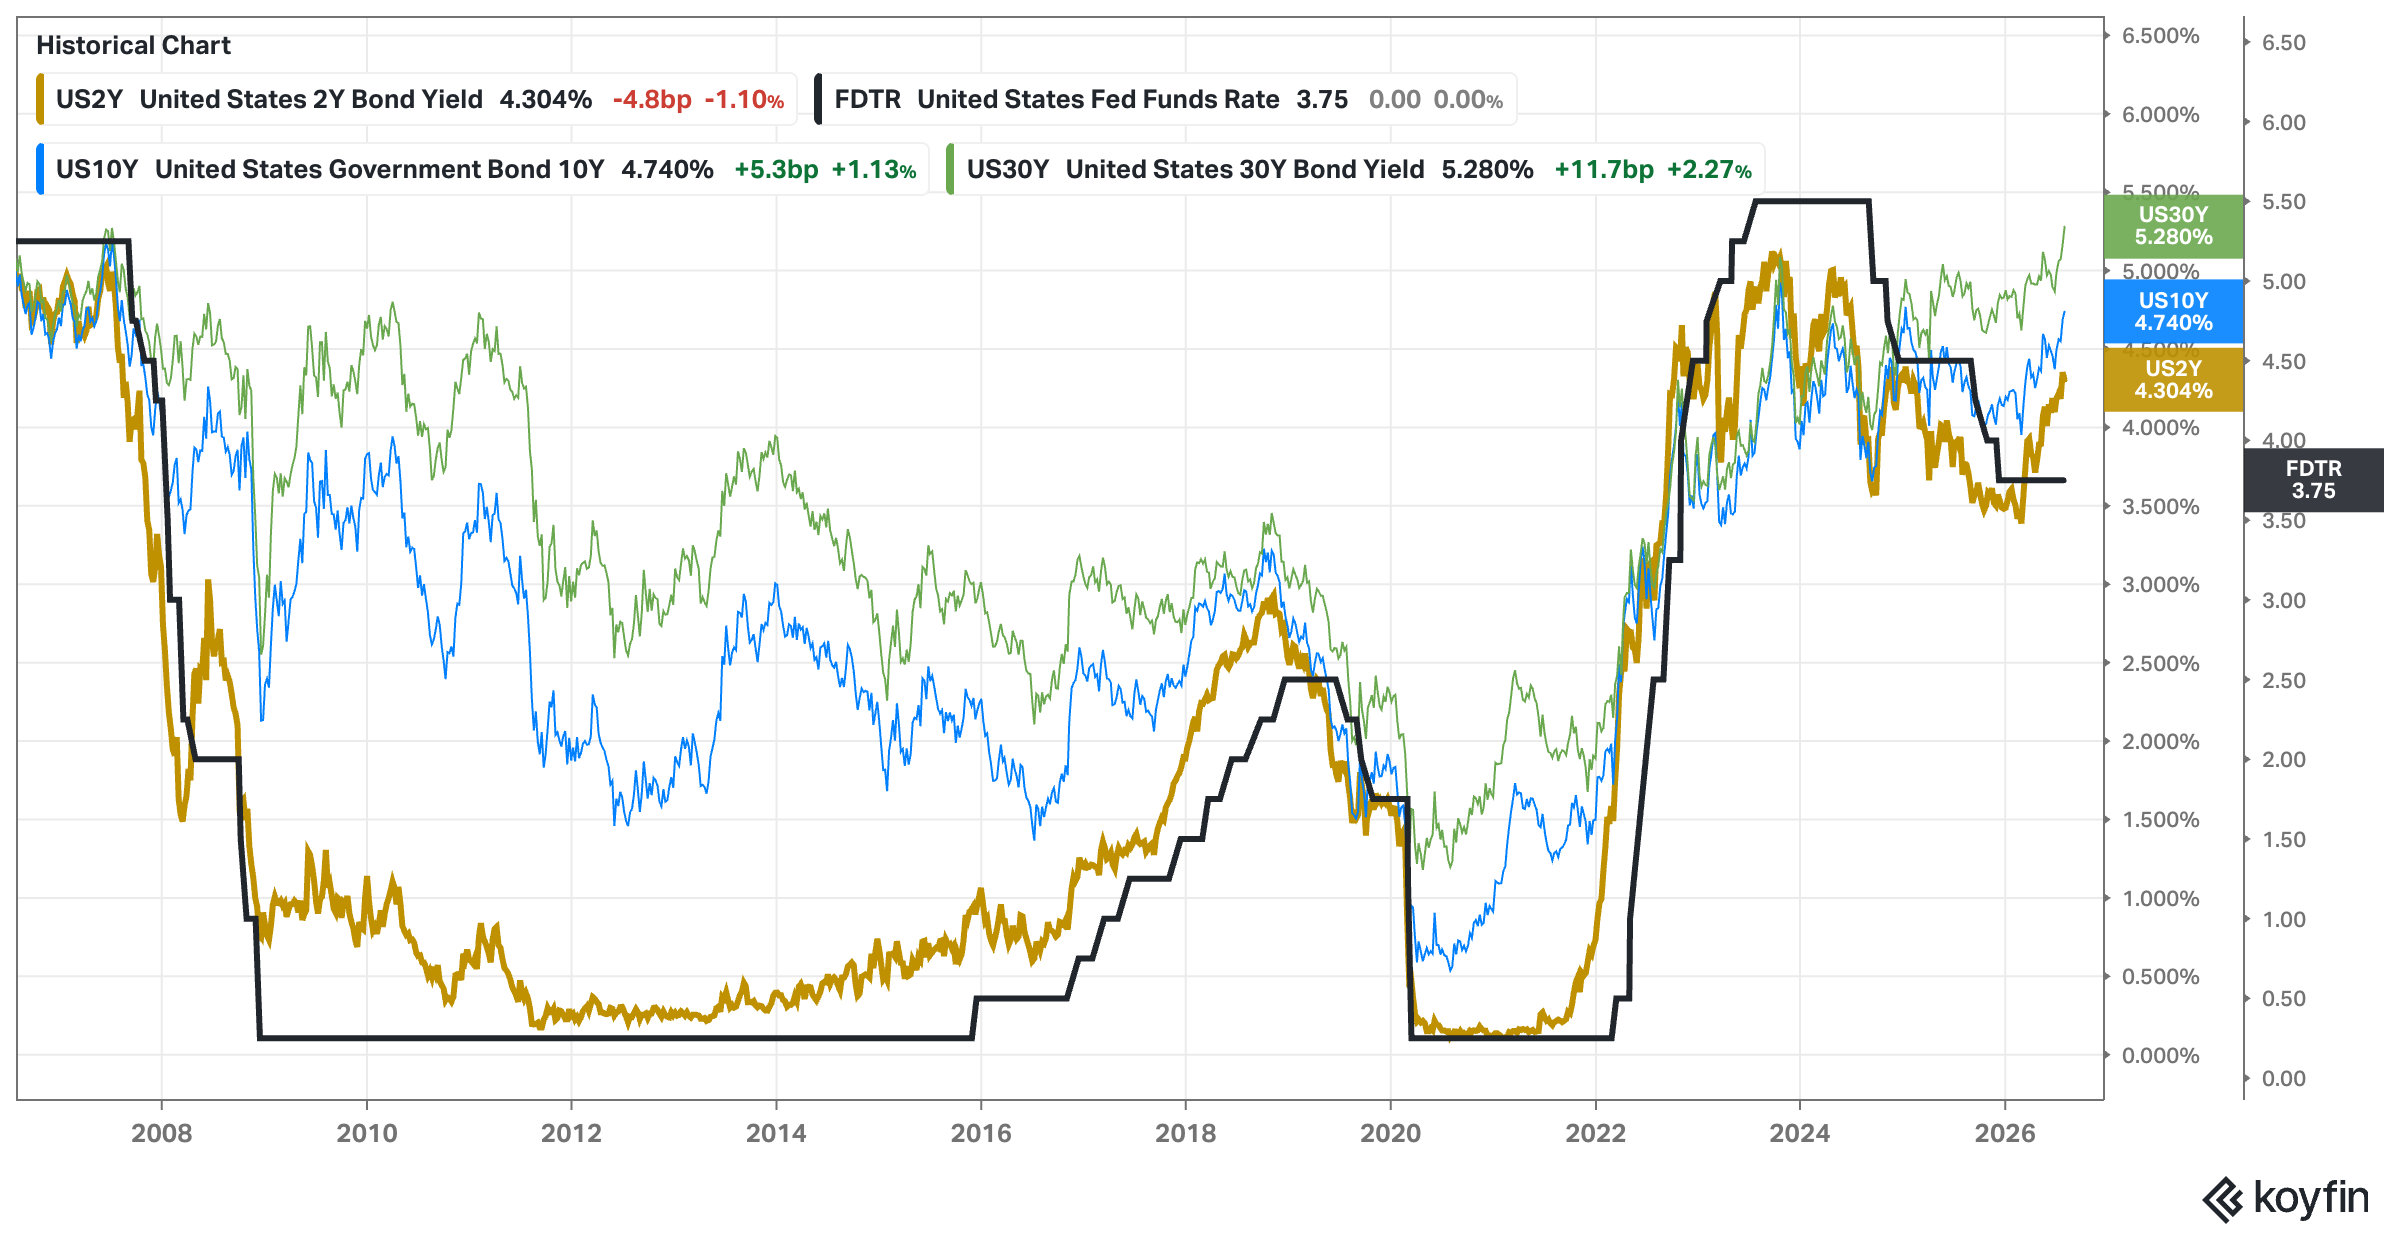
Analysis: Long-term rates increased this week when the Fed took the decision to not increase reference rates. I read plenty of news and experts saying that the Fed will be forced to raise, but when I check the period between 2009 to 2019, I see a big gap between long-term and reference rates. Only the 2-year rate seem to follow more the reference rate (or the other way around). Still, I cannot say that the current situation is bullish for the stock market, but I won’t say is bearish either.
Outlook: Neutral
Context: Why is it happening? Summary
Economic Production: Bullish
Economic Activity: Bullish
Interest Rates: Neutral
Indexes: What is happening?
Price Action, Trend & Momentum:
Weekly & Daily SPY, QQQ, and IWM
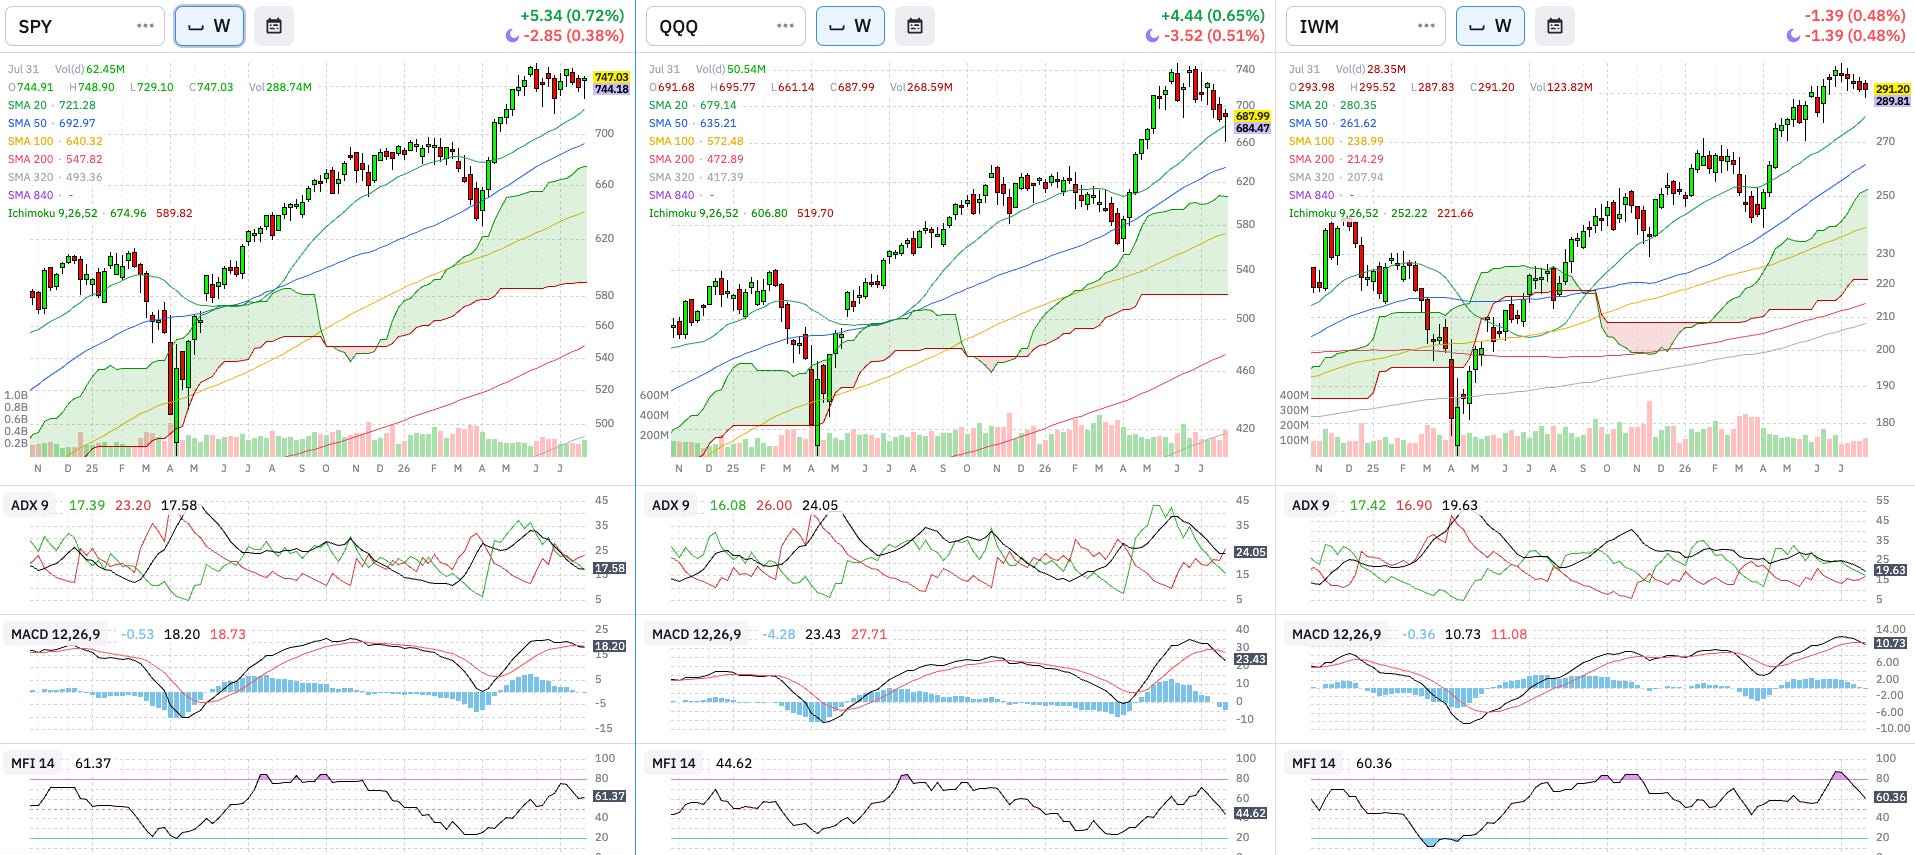
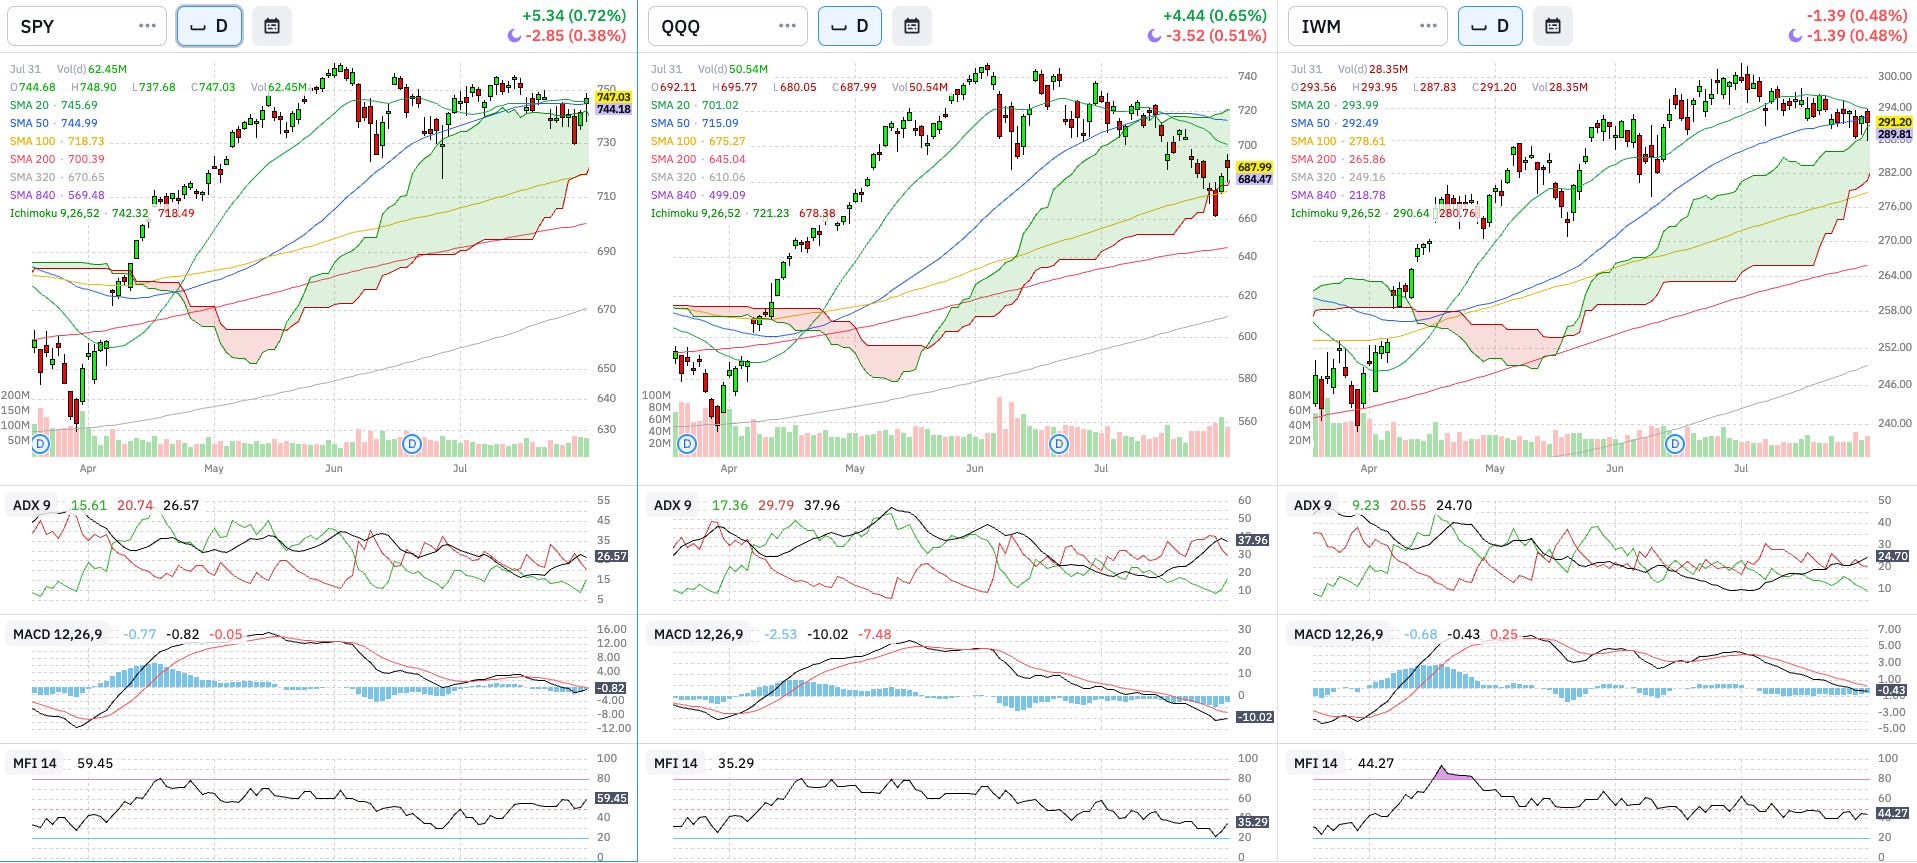
Analysis:
Weekly: The 3 indexes are at the start of the “markdown” Wyckoff stage. MACD just triggered the bearish signal, ADX confirms, and MFI is coming down from the highs. Nasdaq found support on the 20W SMA.
Daily: More neutral picture with MACD near the mid range. ADX confirming the end of the bearish trend. MFI signalling bullish pressure on the SPY, bounced off the lows in QQQ, and neutral on IWM. SPY and IWM found support on the upper end of the cloud, while QQQ found support at the bottom of the cloud.
Conclusion: We may see a relief rally on the daily but the weekly charts signal that more bearish pressure is still to come.
Wyckoff Stage: Markdown
Breadth: % Stocks above SMAs
Above 200 Daily SMA
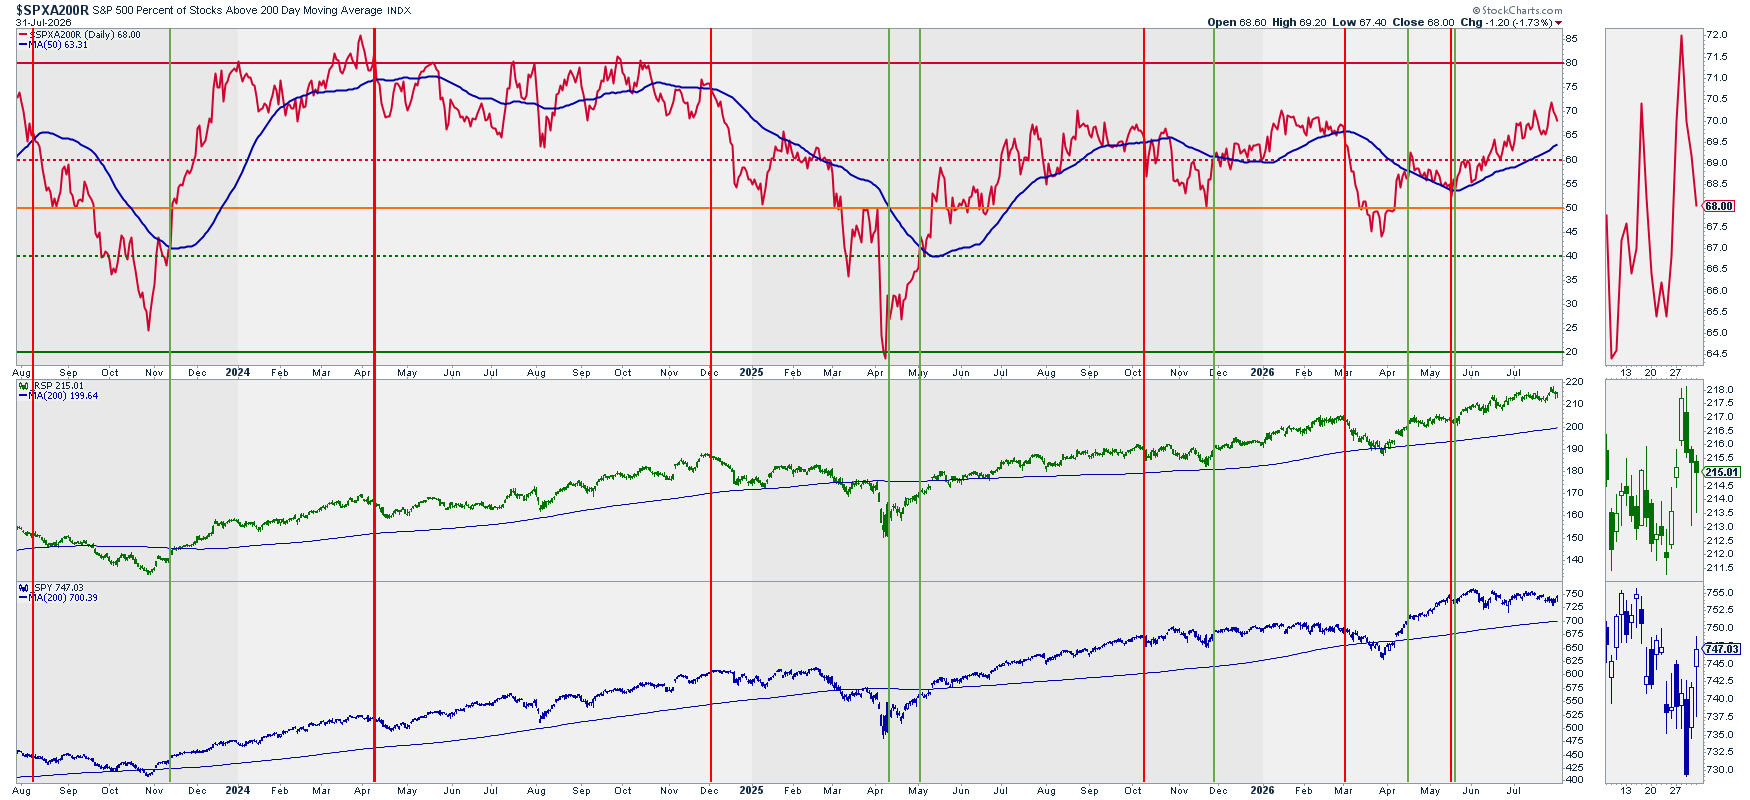
Above 20, 50, and 200 Daily SMAs vs. RSP
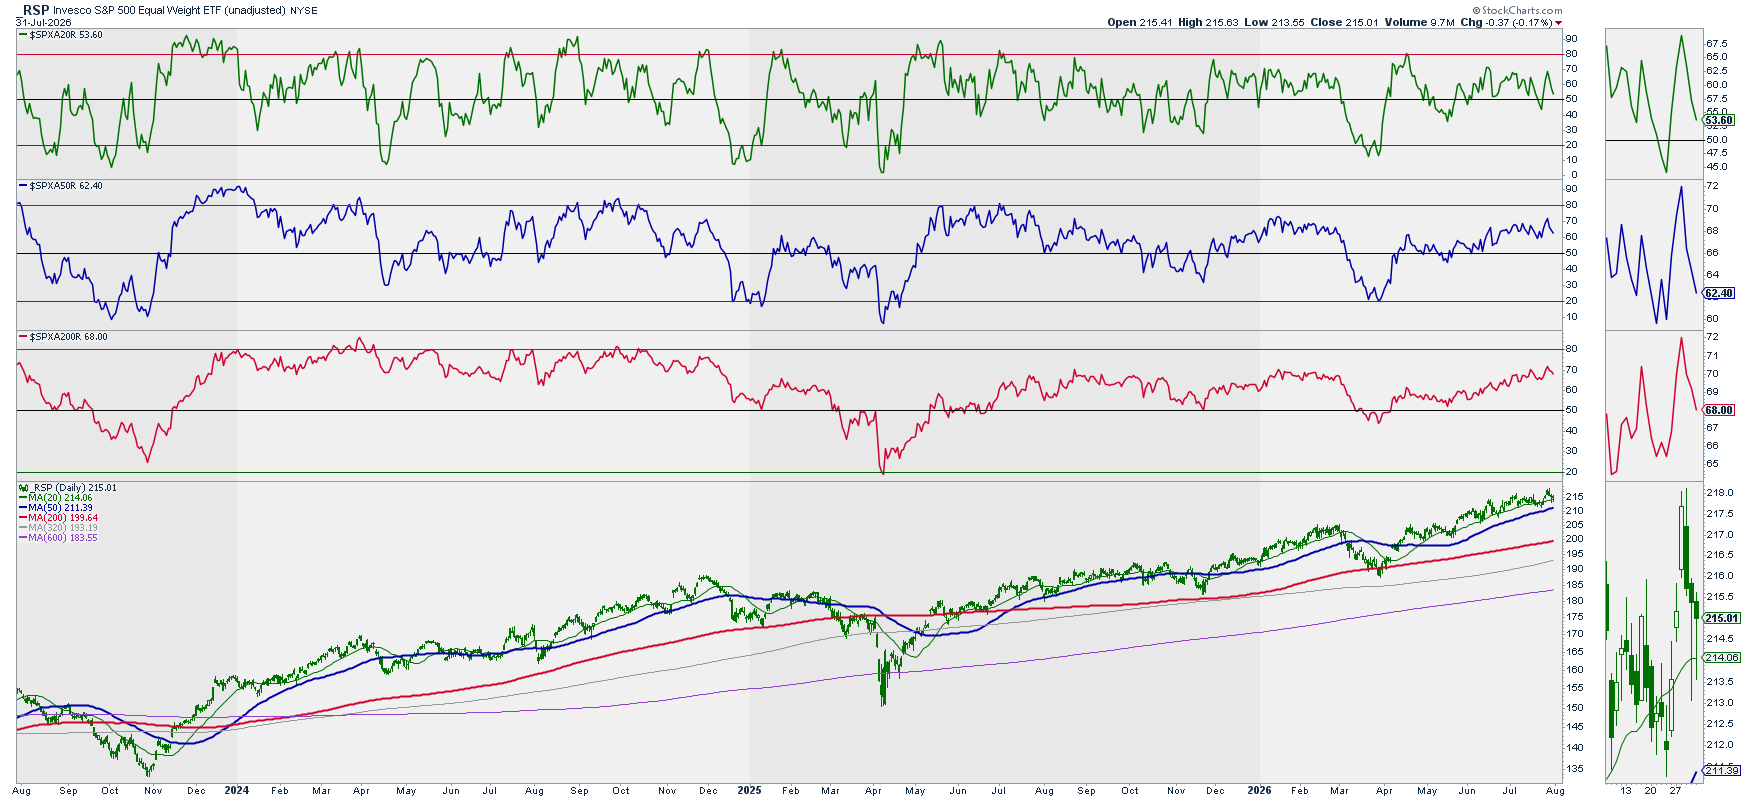
Analysis: % stocks above their 200D and 50D remains elevated. 20D recovered and then went sharply down in the last two sessions.
Outlook: Broadening.
Volatility: Ratio Low Vol. Stocks / SPY vs. RSP & SPY
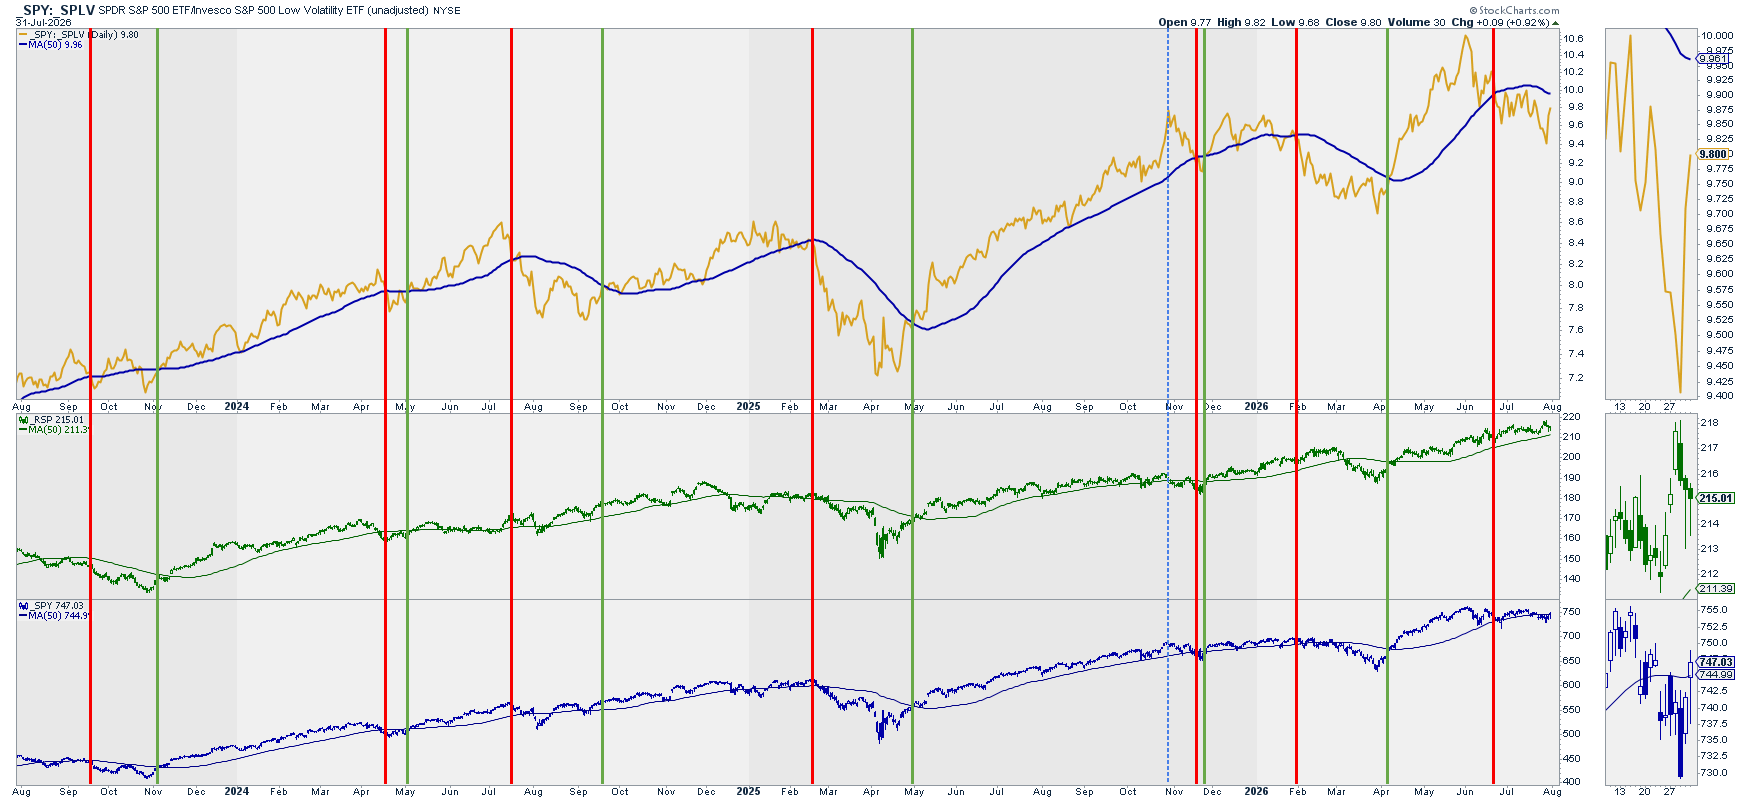
Analysis: The ratio bounced and sharply raised towards its 50D SMA. We are still bearish but it is a good sign to see this rapid recovery.
Outlook: Bearish
Volatility: VIX vs. RSP & SPY
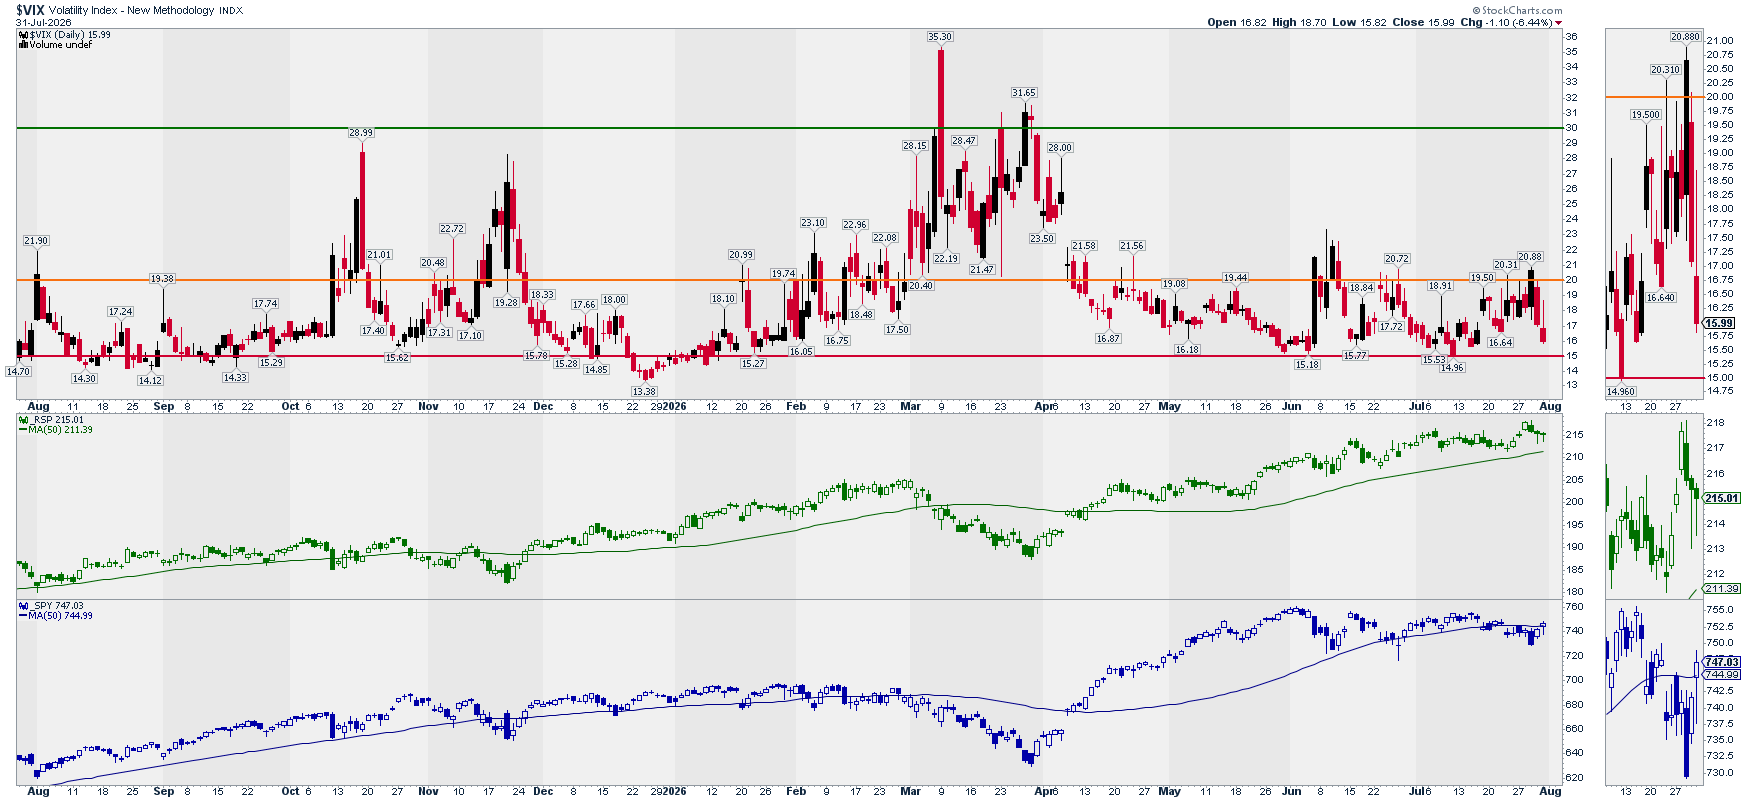
Note: This chart is mainly to detect extreme volatility situations that, once they reverse, offer great long opportunities in the market.
Analysis: VIX sharply dropped this week, breaking the upward trend for the last two weeks.
Options: (Inverted) Put/Call Ratio vs. SPY
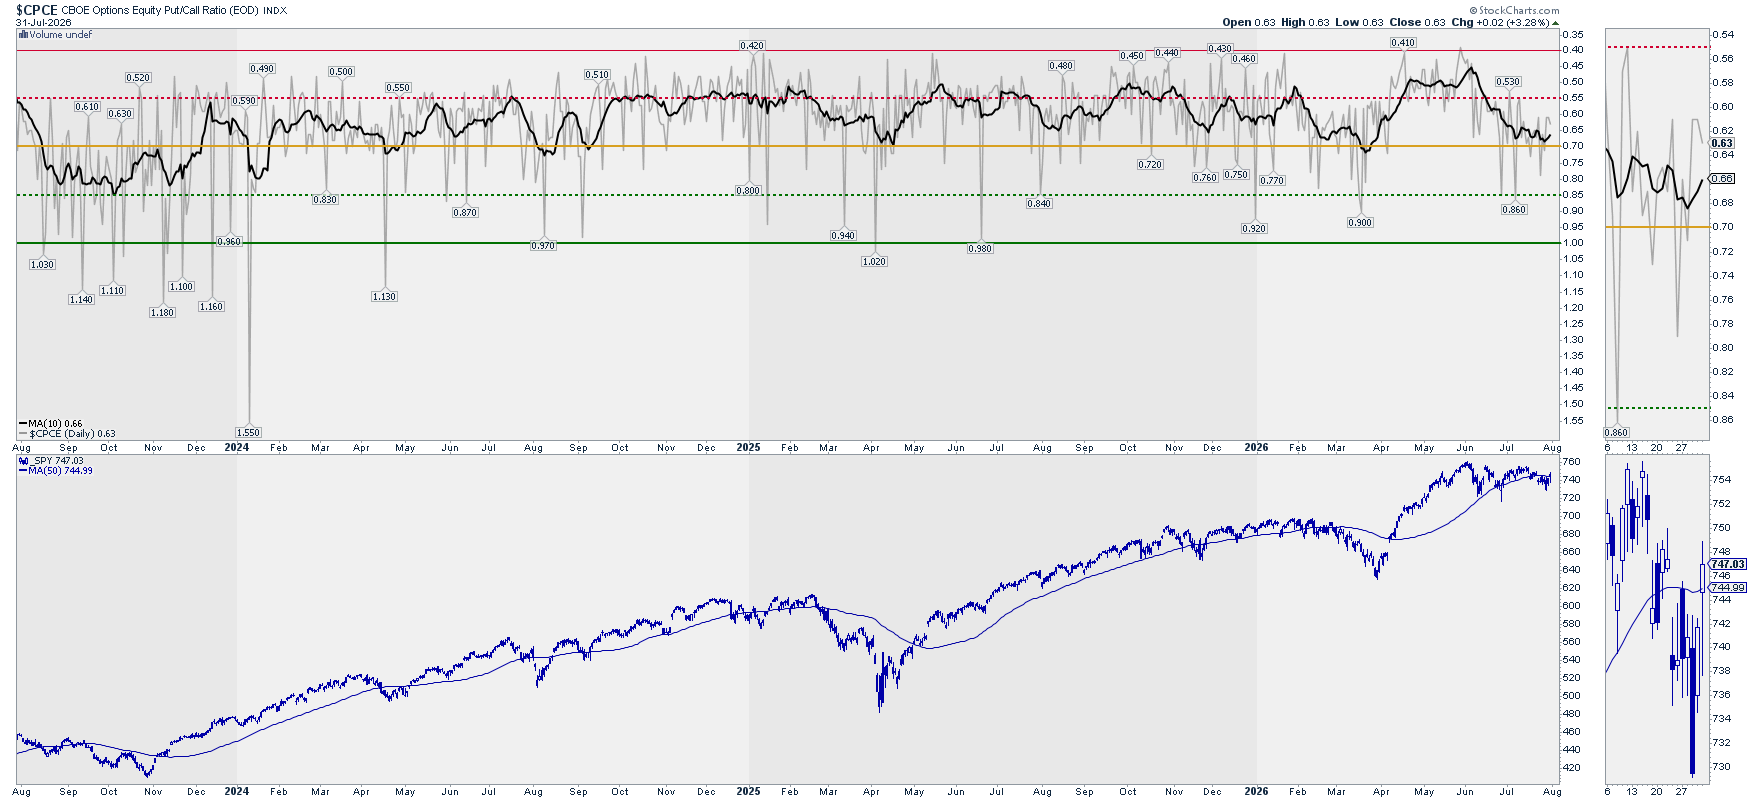
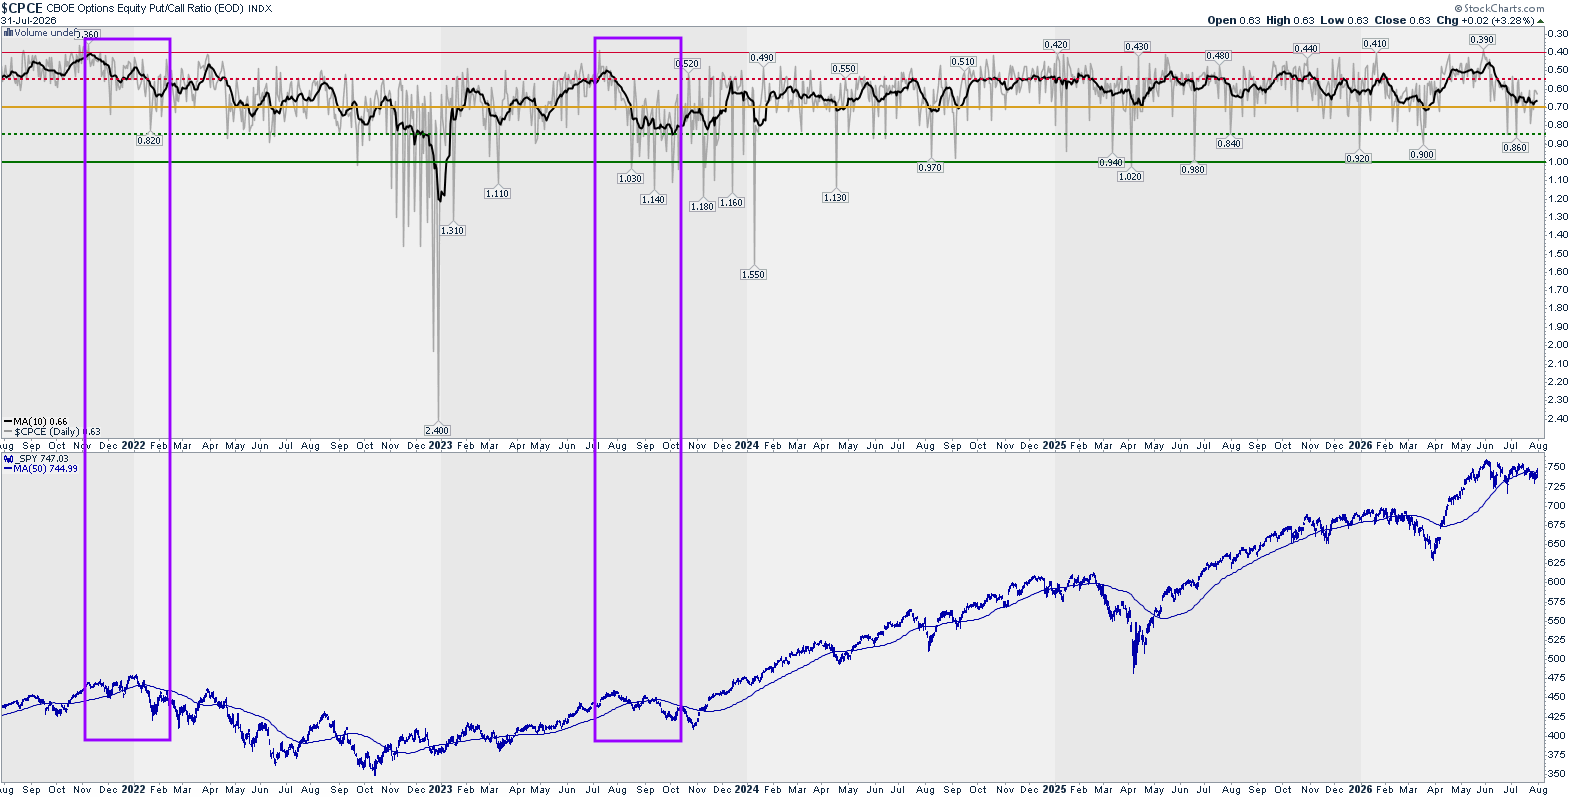
Analysis: P/C ratio continues its downward trend, as predicted. We will remain bearish until we don’t see this ratio improving.
Outlook: Bearish
Options: Gamma Exposure – SPY
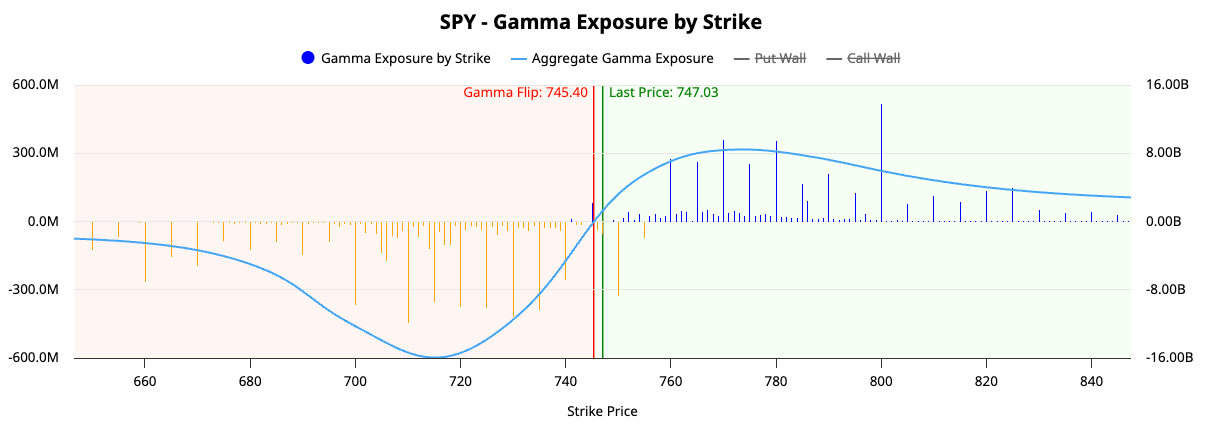
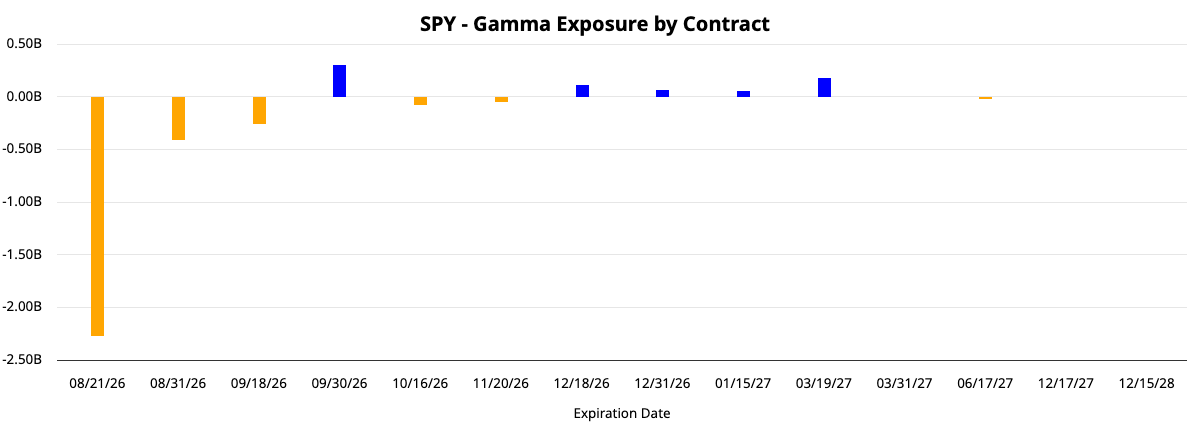
Analysis: GEX has improved from last week but still there is a great negative pressure going into August expiration.
Outlook: Bearish
Indexes: What is happening? Summary
Price, Trend & Momentum: Markdown
Breadth: Broadening
Volatility: Bearish
Options: Bearish
Sectors: Where is it happening?
Sectors Rotation
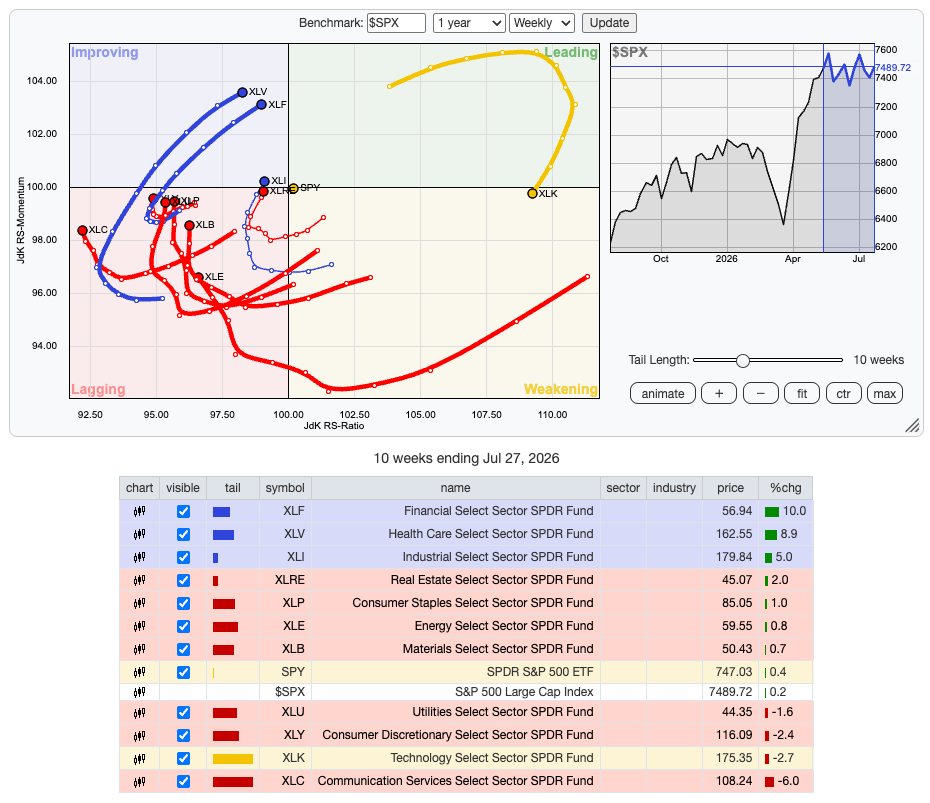
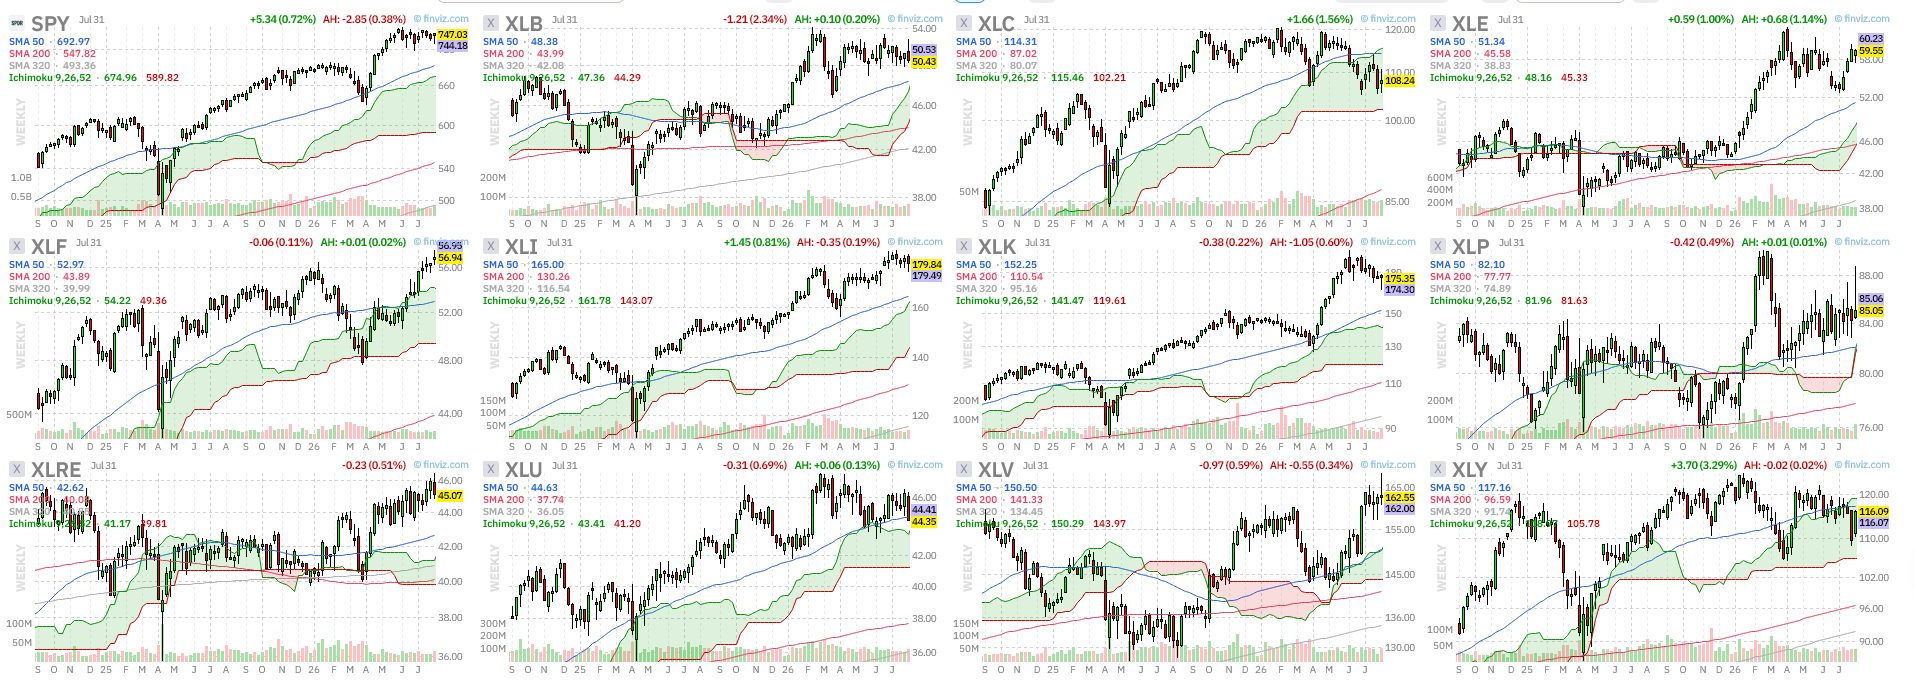
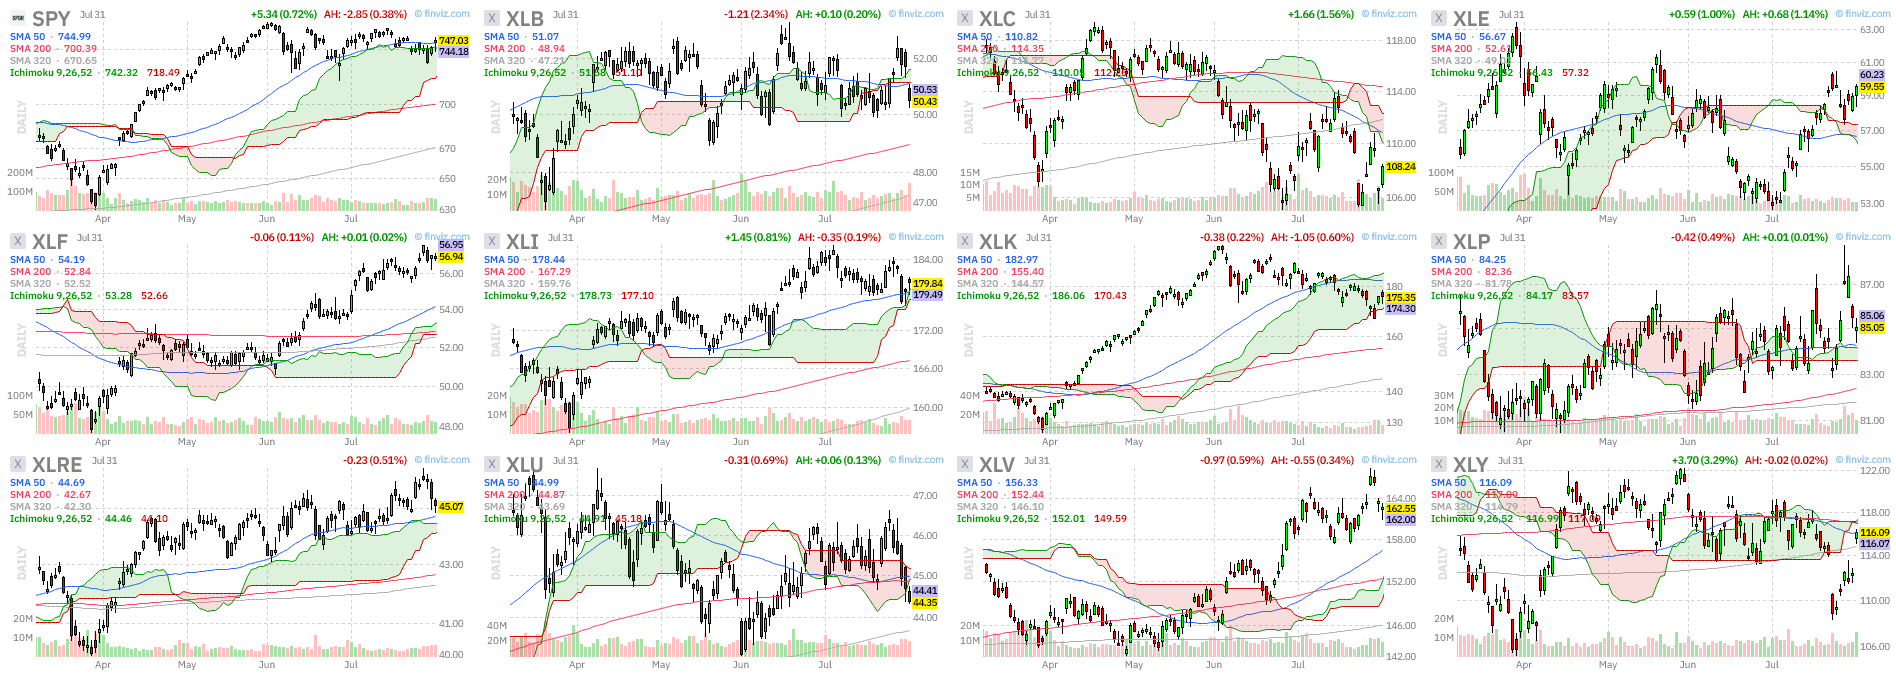
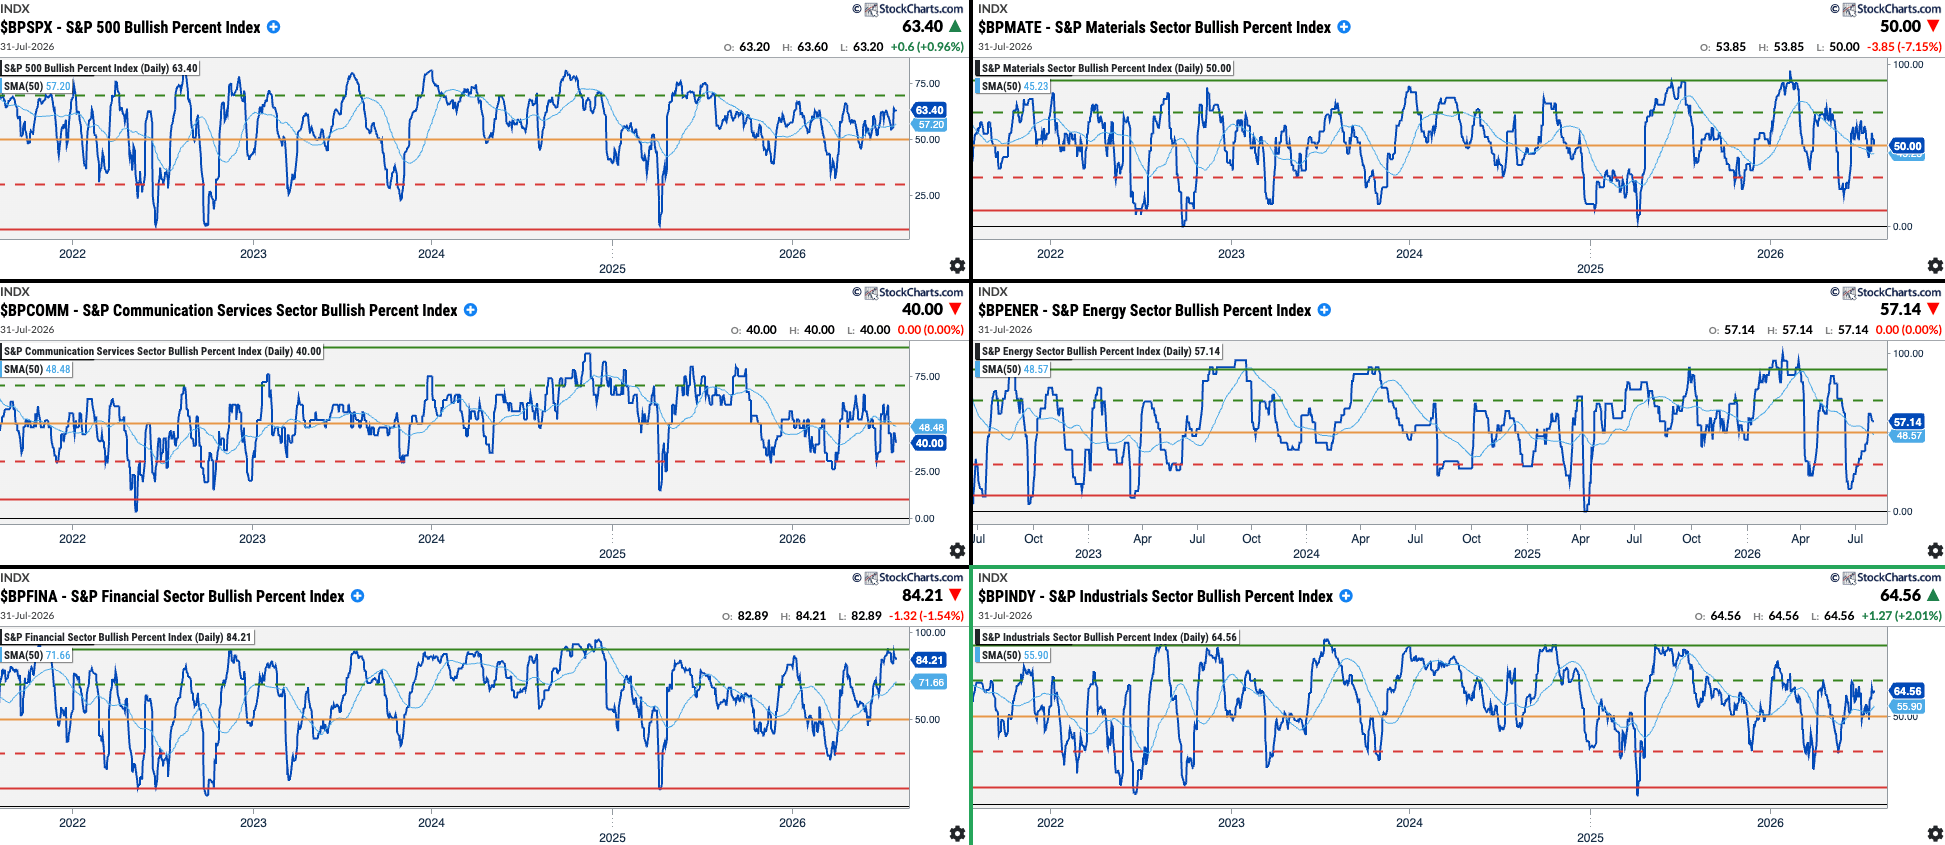
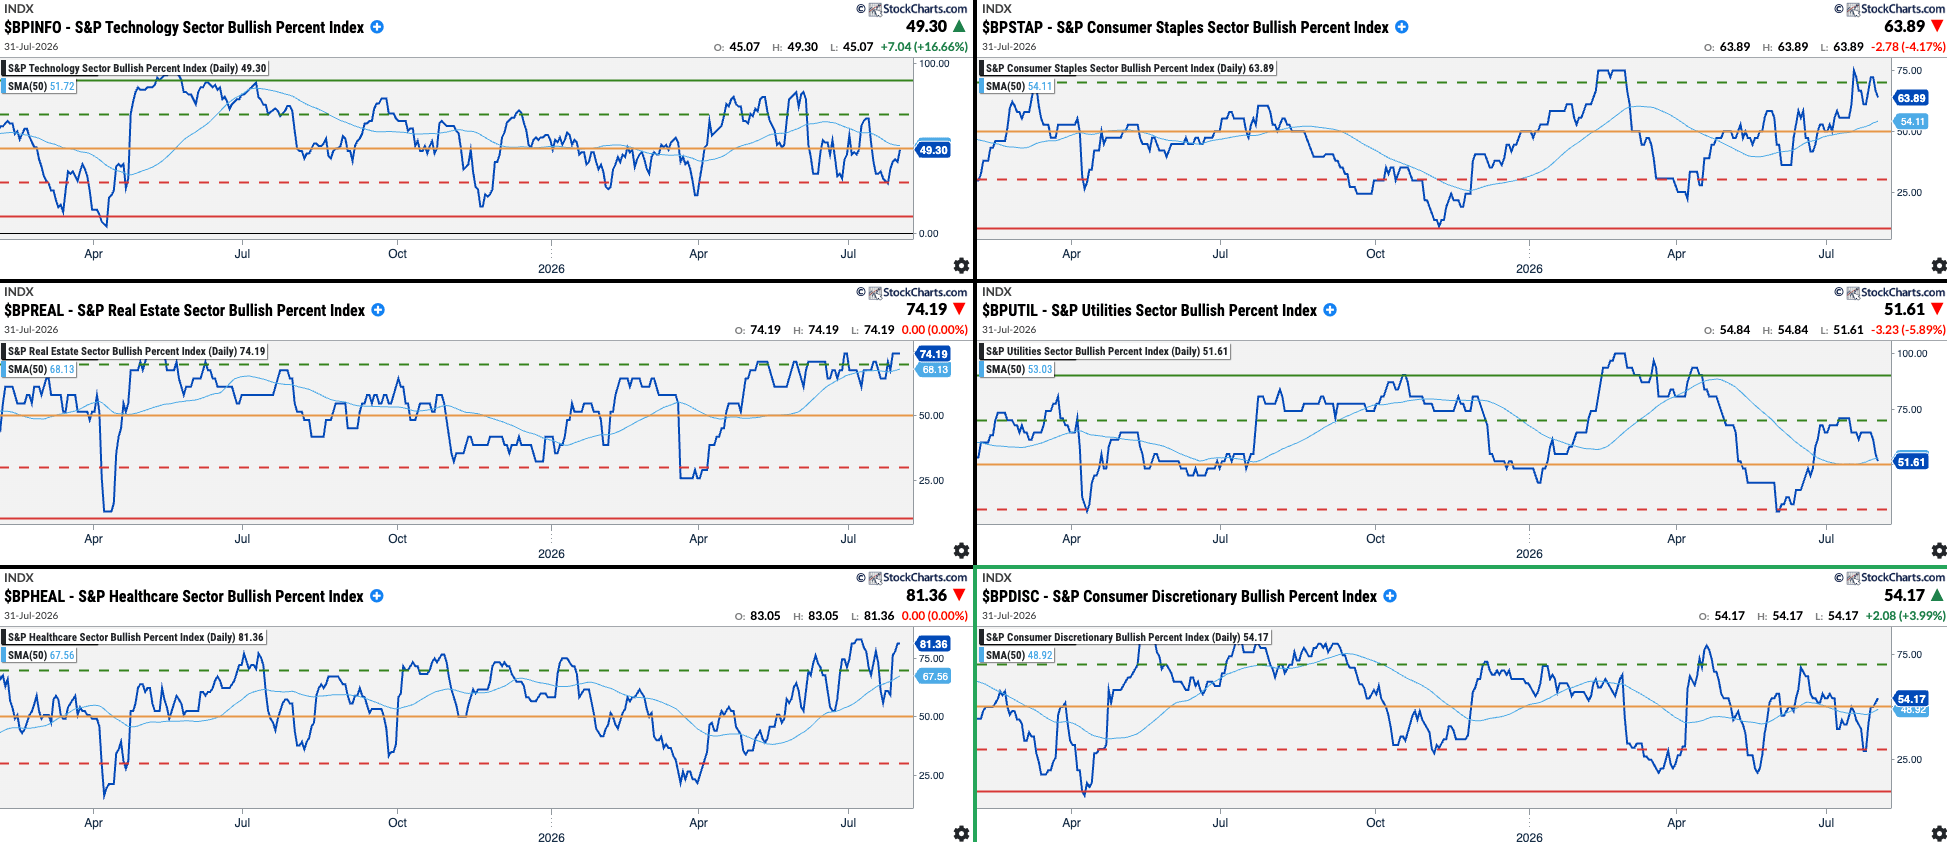
Analysis: XLV and XLF are trying to break to new ATHs. XLK offers a good entry point from its Bullish Percentage perspective
SPX Pct. Bullish Indicator shows us a Bullish Outlook.
Scanners: Scanning for opportunities
S&P500 and Nasdaq New Highs in Leading Sectors
Descriptive
Index: S&P 500 and Nasdaq | Market Cap.: +Mid (+$2B) | Option/Short: Yes/Yes
Avg. Volume: >1M | Price: >$10
(order by Market Cap desc.)
Technical
50-Day New High


Last Word
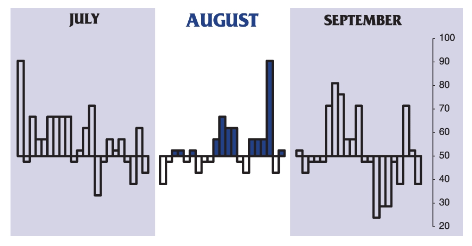
Moving into August, know as one of the weakest months, and coming from a quite negative July, we may have a bit of a relief rally at some point.
The Stock Trader’s Almanac shows us the following seasonality for August 2026:
And for midterm years:
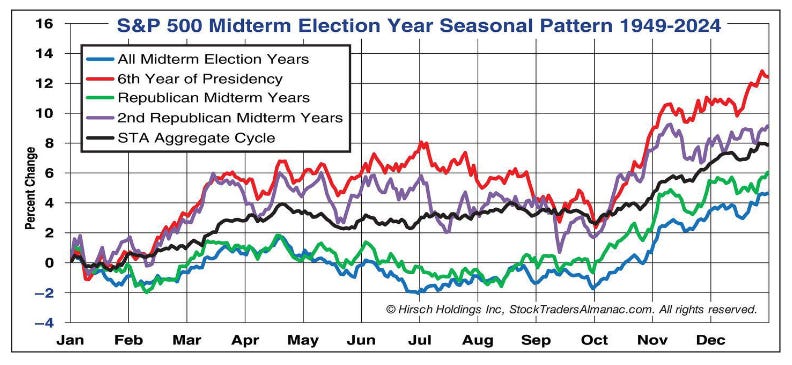
I hope 2026 follows the green pattern, with the market topping in June and bottoming mid-August, before it goes into a strong rally.
StockCharts.com shows us the following accumulated seasonality for the last 10 years:
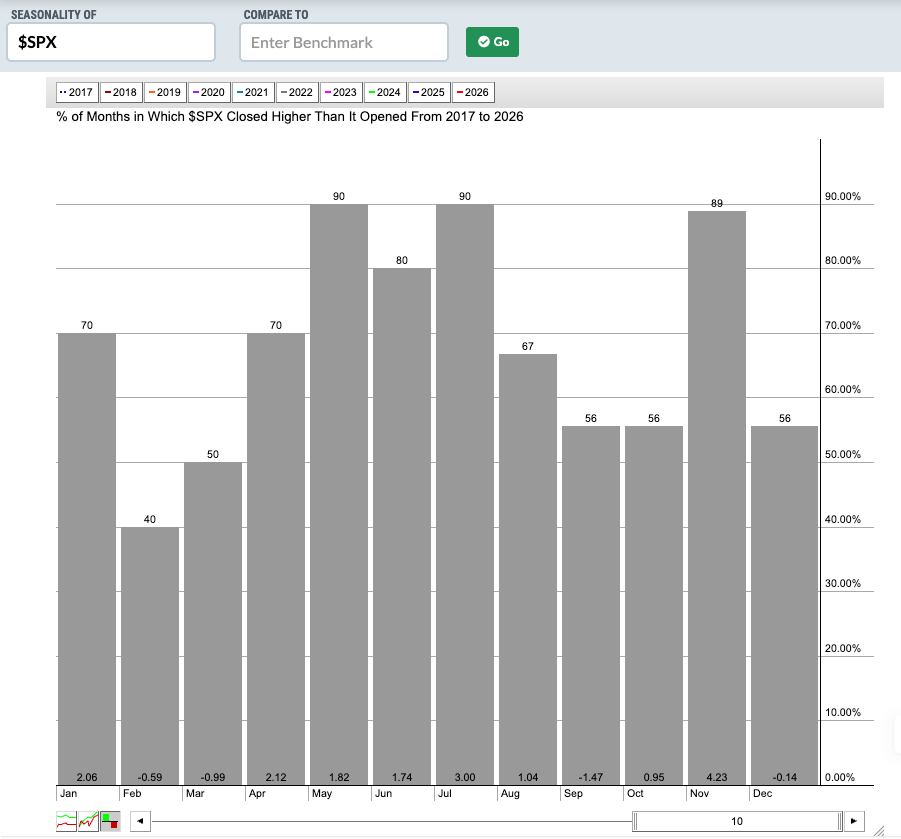
By this chart, we have in front of us the worse two months of the year. Or if you prefer, the best two months of the year to buy into your portfolio at a great sale prices.
Disclaimer: The content on AMAT Investing is strictly for educational and learning purposes. The author is not a licensed financial advisor and holds no formal financial education. This post does not constitute professional financial advice. All investing involves risk of loss. Always conduct your own research and consult a licensed professional before making any investment decisions.