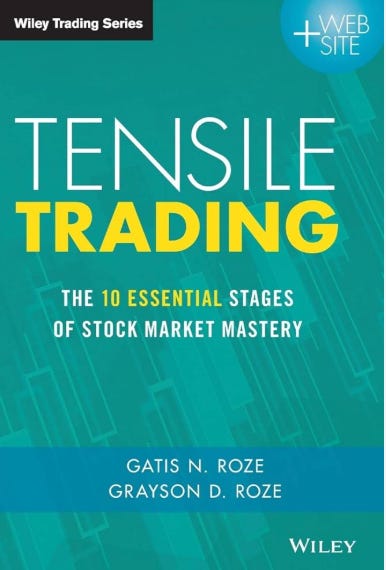
Last week, I had the privilege to take some days off in Greece and spend quite a bit of hours reading and taking notes from this amazing book. As a result, I will update my weekly reviews and other areas of AMAT Investing. Learning and adapting to changes is a great way to improve and as long as I don’t see that Ferrari on the driveway… there is room for improvement :)
One of the ideas that I refreshed during my reading, is the Wyckoff Market Cycle: https://www.wyckoffanalytics.com/wyckoff-method/
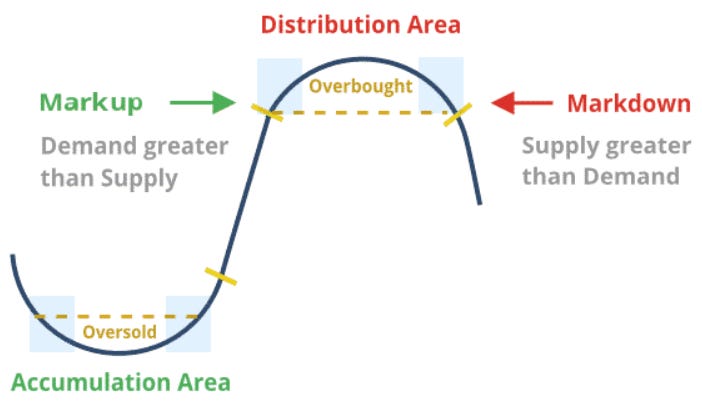
According to Wyckoff, the market can be understood and anticipated through detailed analysis of supply and demand, which can be ascertained from studying price action, volume and time. As a broker, he was in a position to observe the activities of highly successful individuals and groups who dominated specific issues; consequently, he was able to decipher, via the use of what he called vertical (bar) and figure (Point-and-Figure) charts, the future intentions of those large interests. An idealized Wyckoff schematic of how he conceptualized the large interests’ preparation for and execution of bull and bear markets is depicted in the figure above. The time to enter long orders is towards the end of the preparation for a price markup or bull market (accumulation of large lines of stock), while the time to initiate short positions is at the end of the preparation for price markdown.
Context: Why is it happening?
Economic Production: ISM PMI vs. SPX
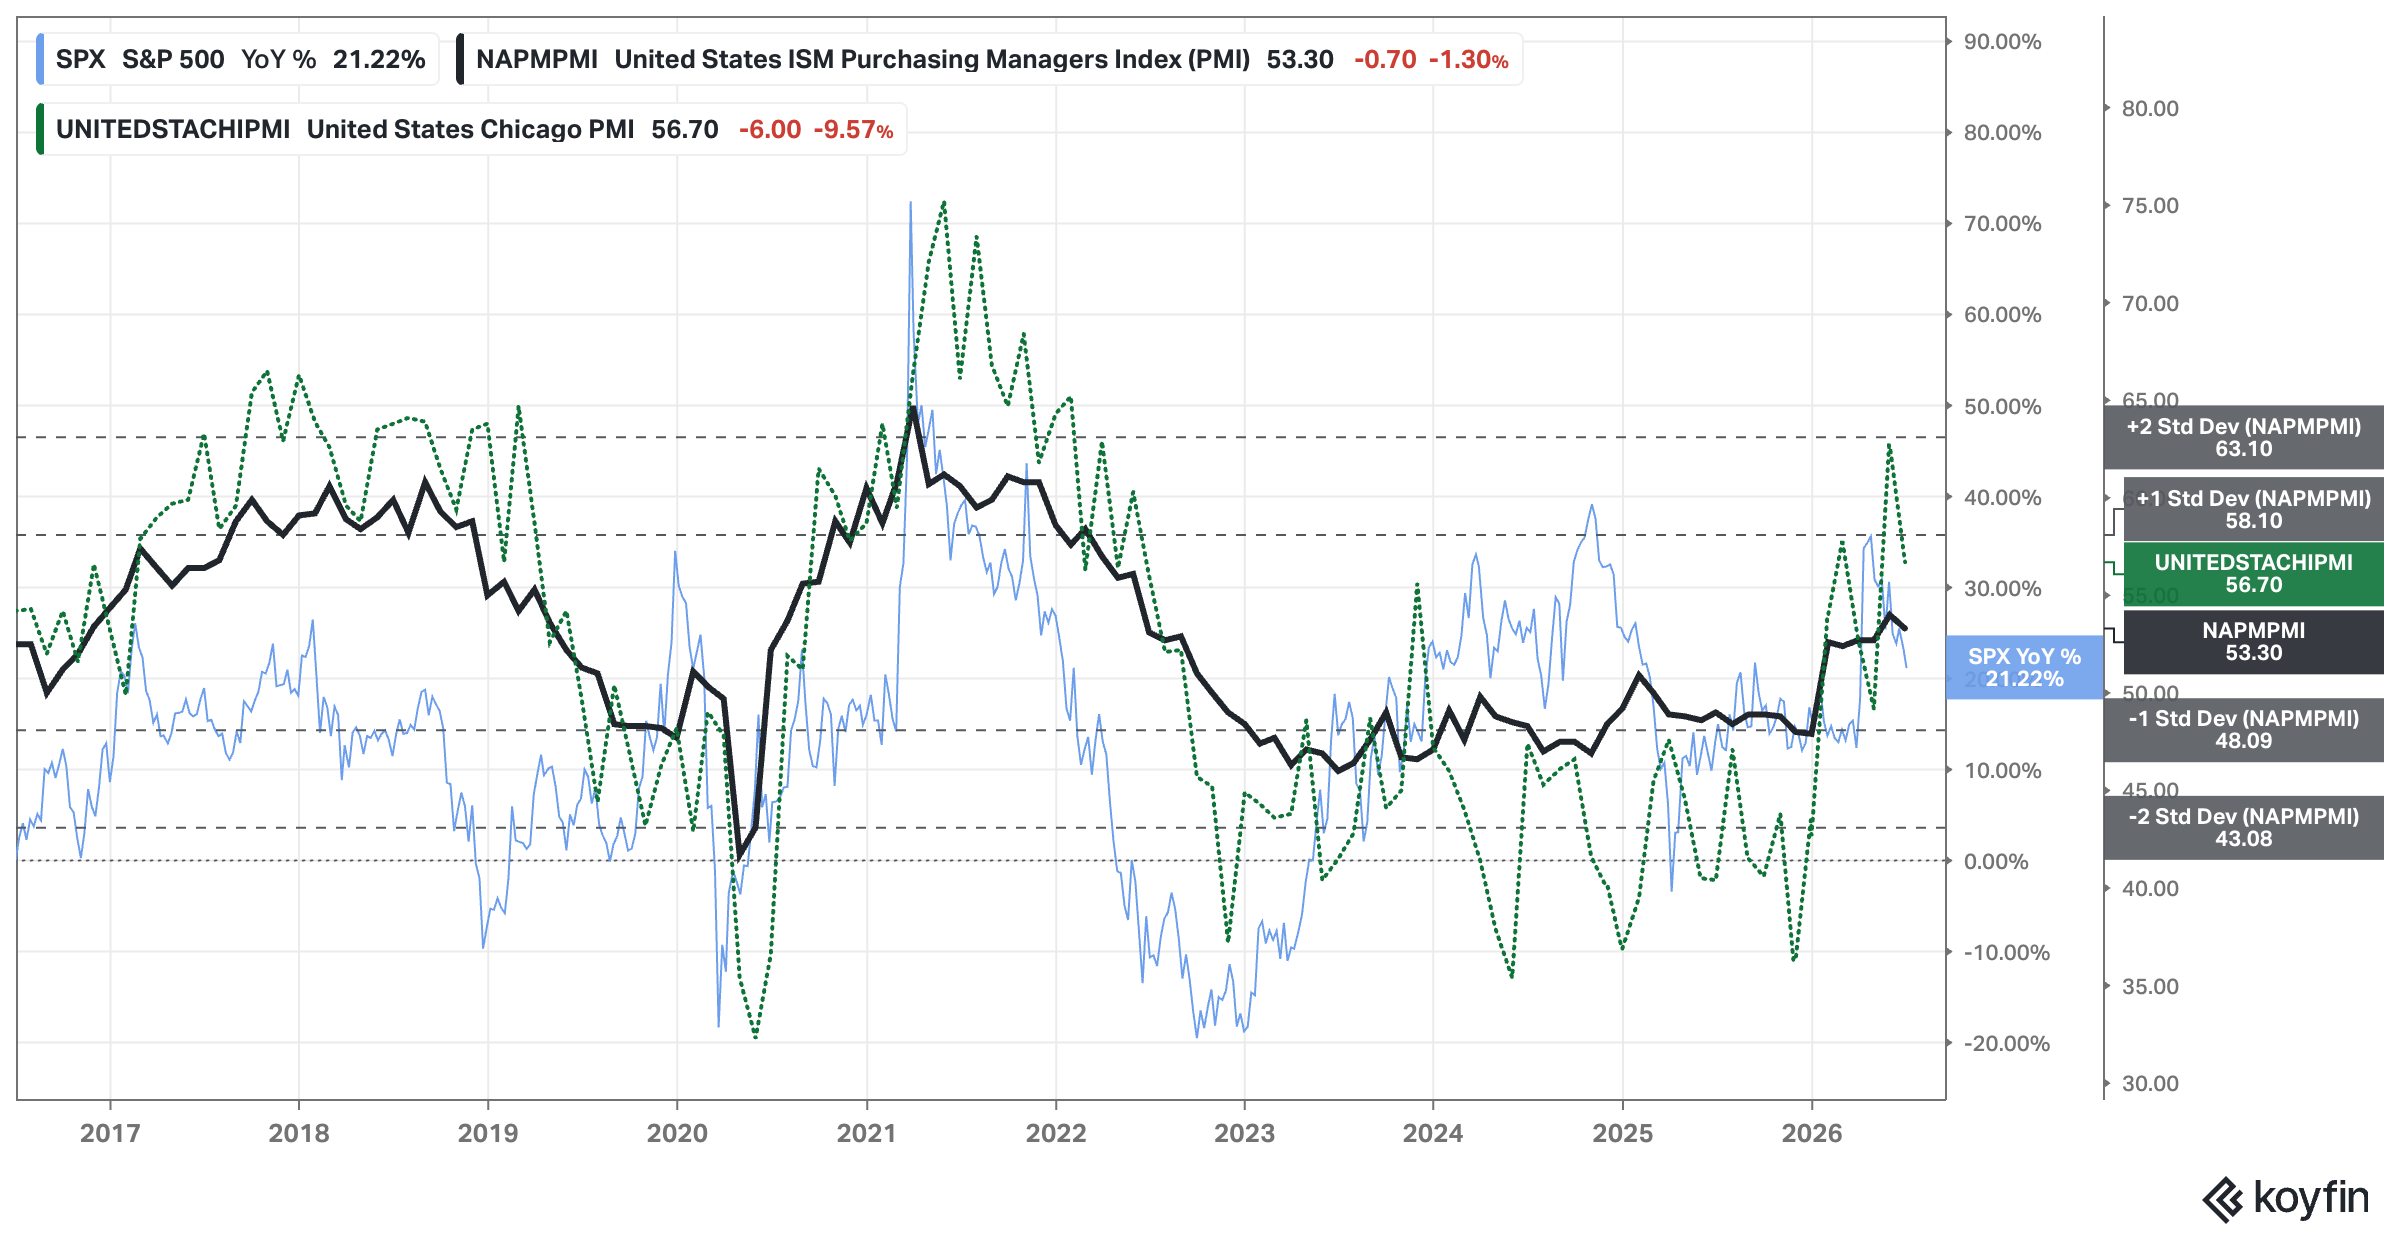
Analysis: No changes since last week.
Outlook: Bullish
Economic Activity: Regional Banks Performance
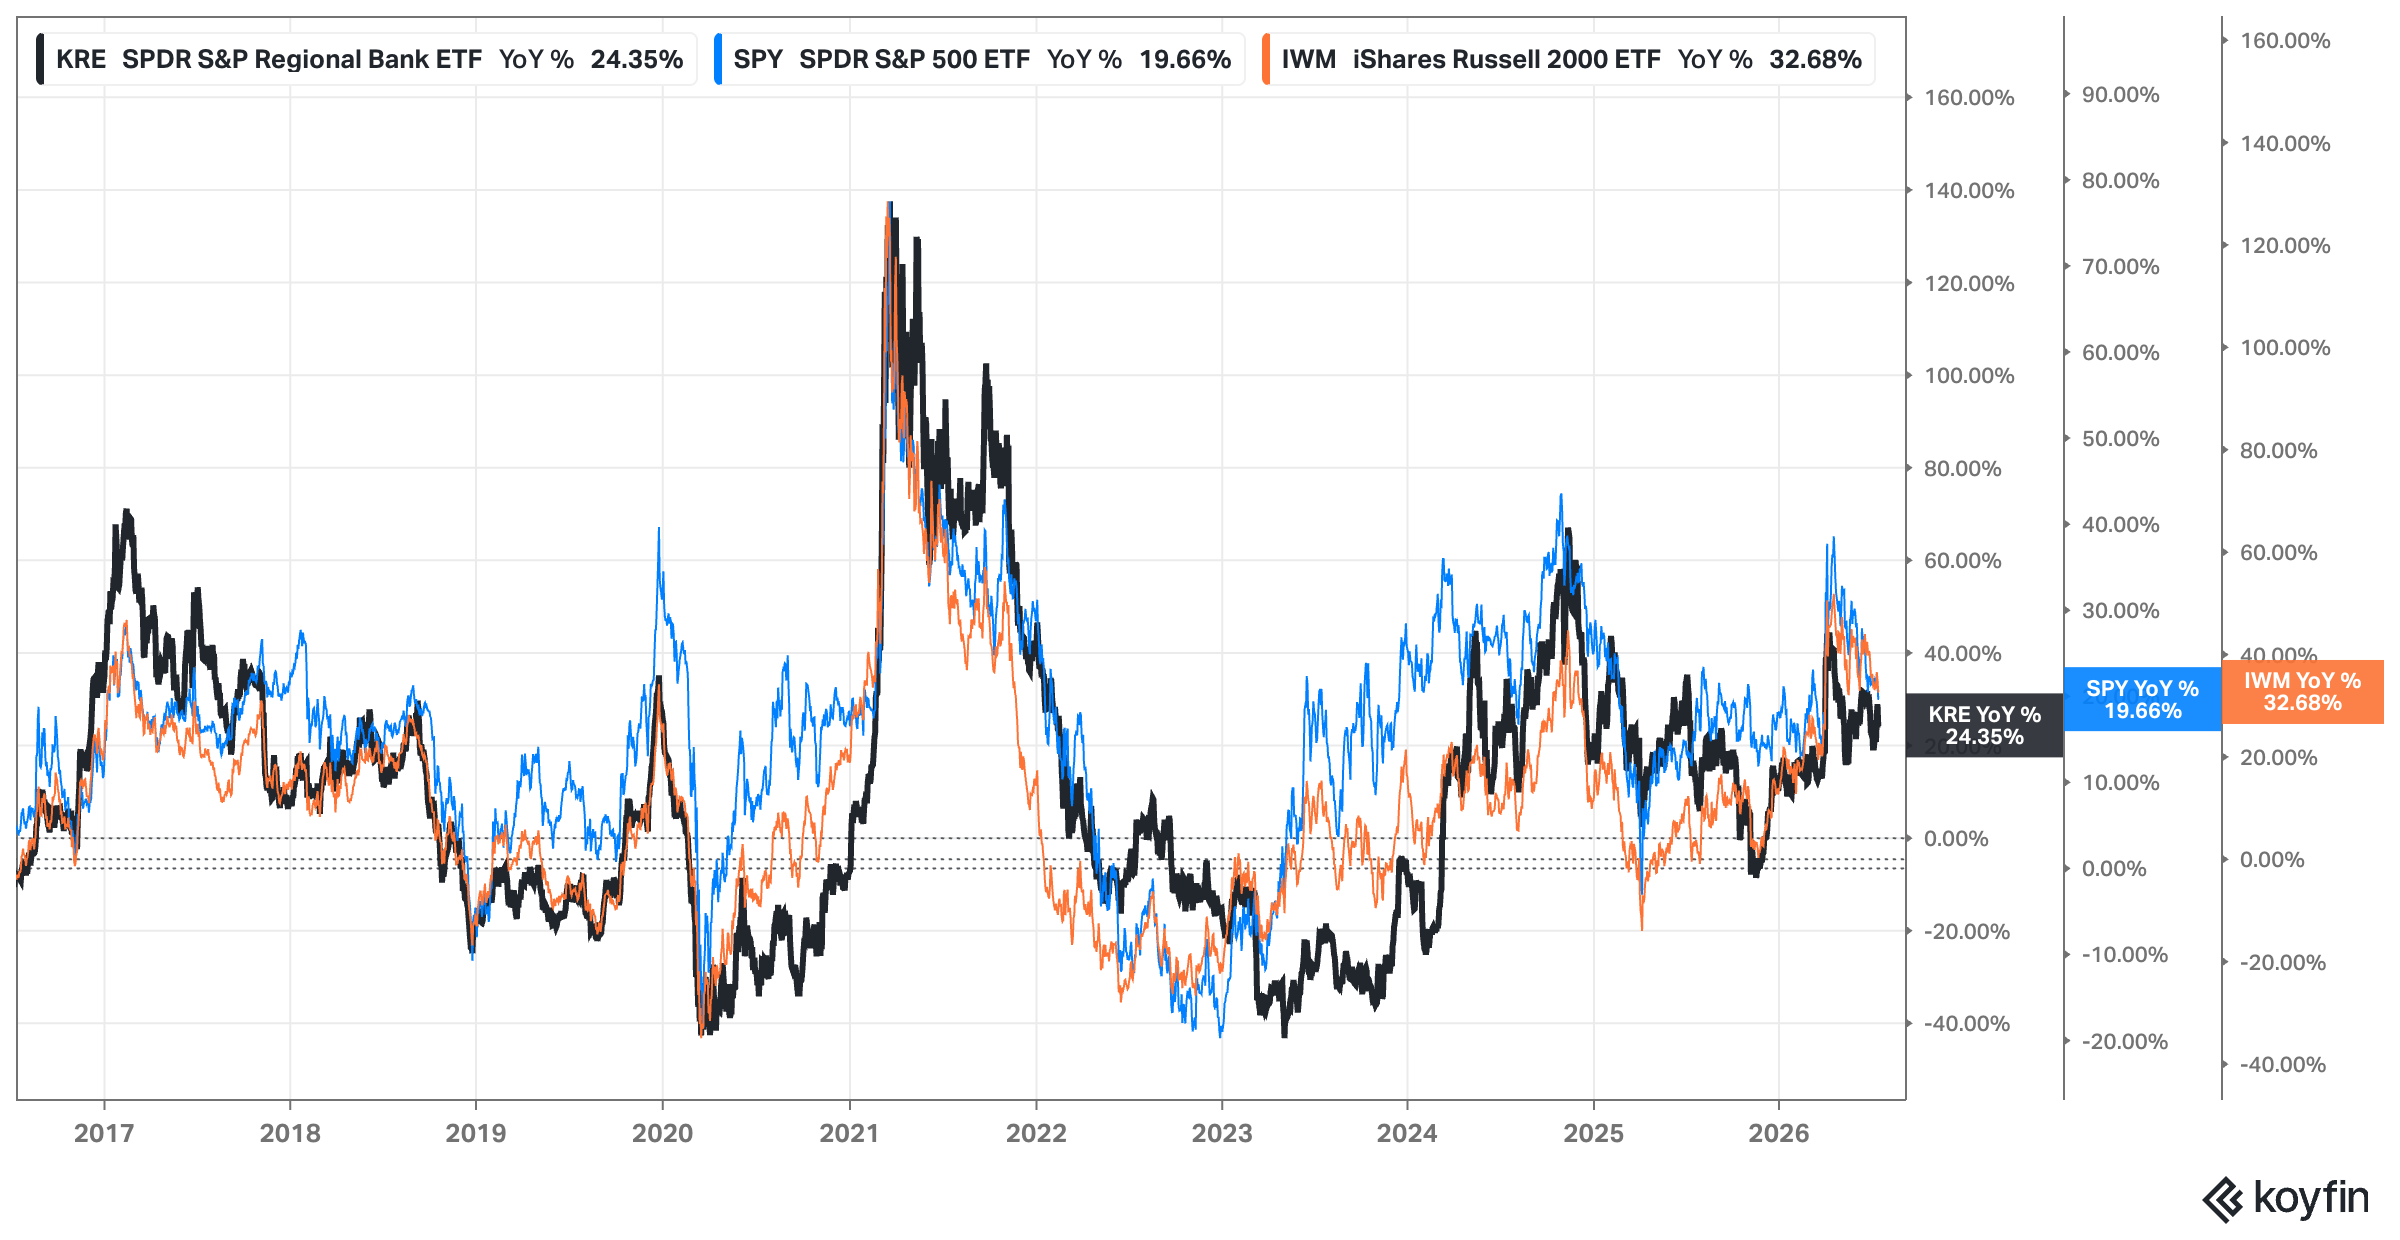
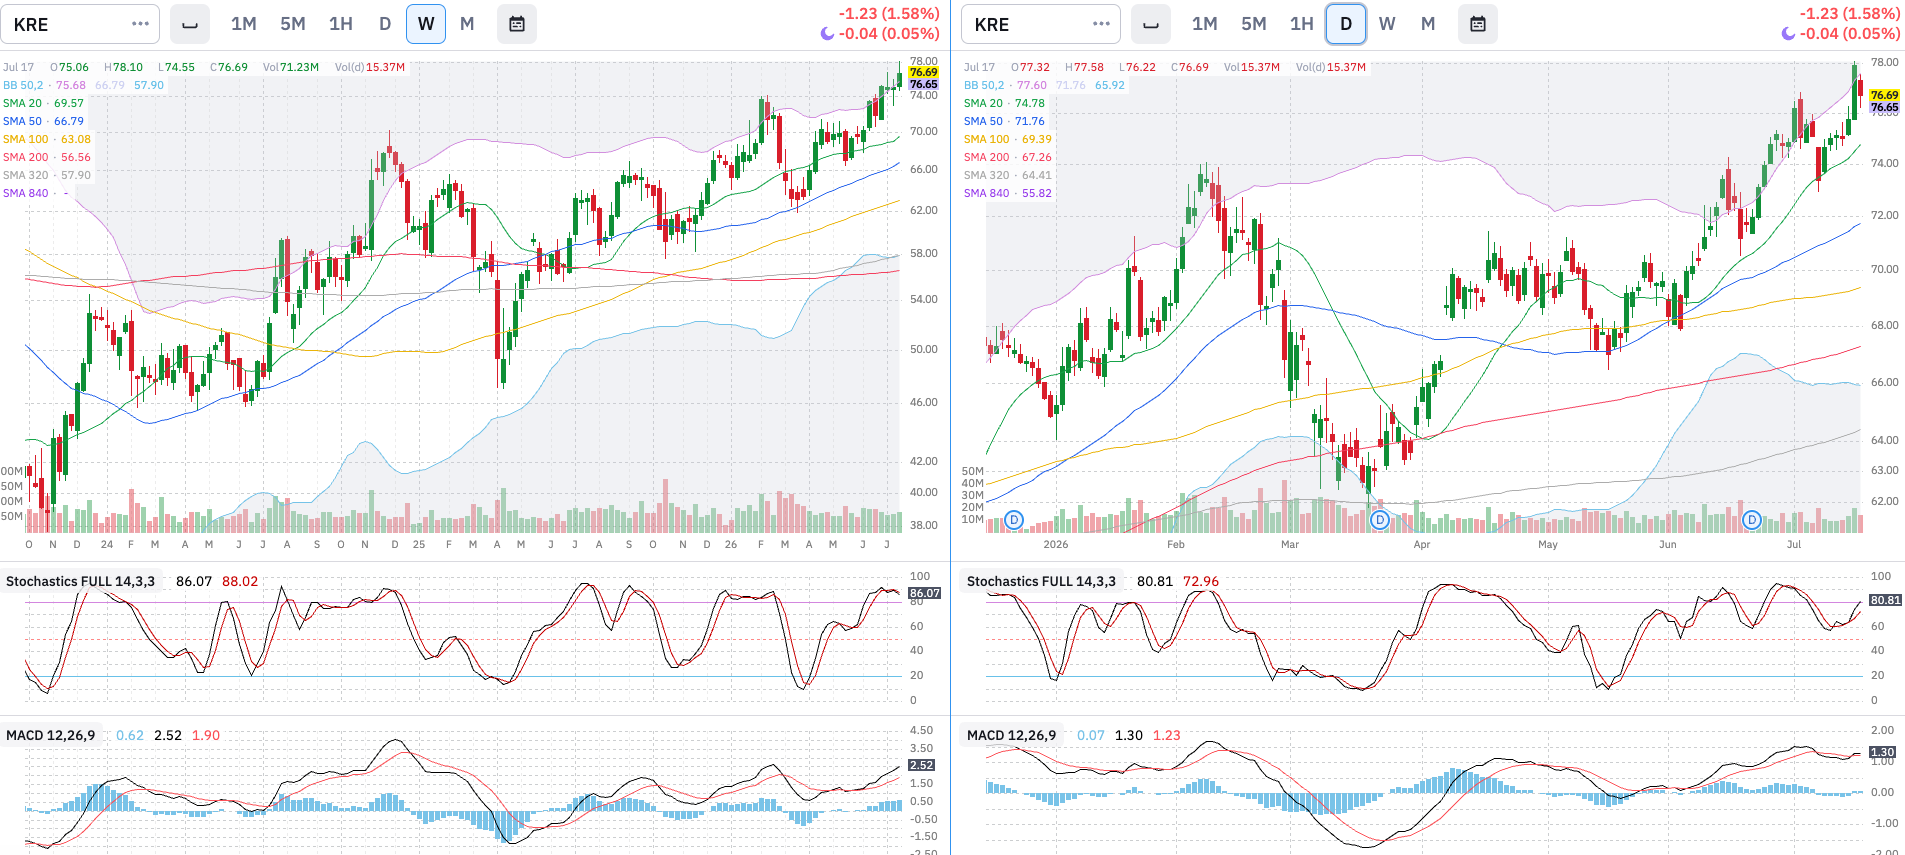
Analysis: KRE weekly stochastics and BB indicate that price is overbought. We had some correction last week but nothing major. Still the uptrend is clear.
Outlook: Bullish
Interest Rates: FED, 2yr, 10yr, and 30yr Rates
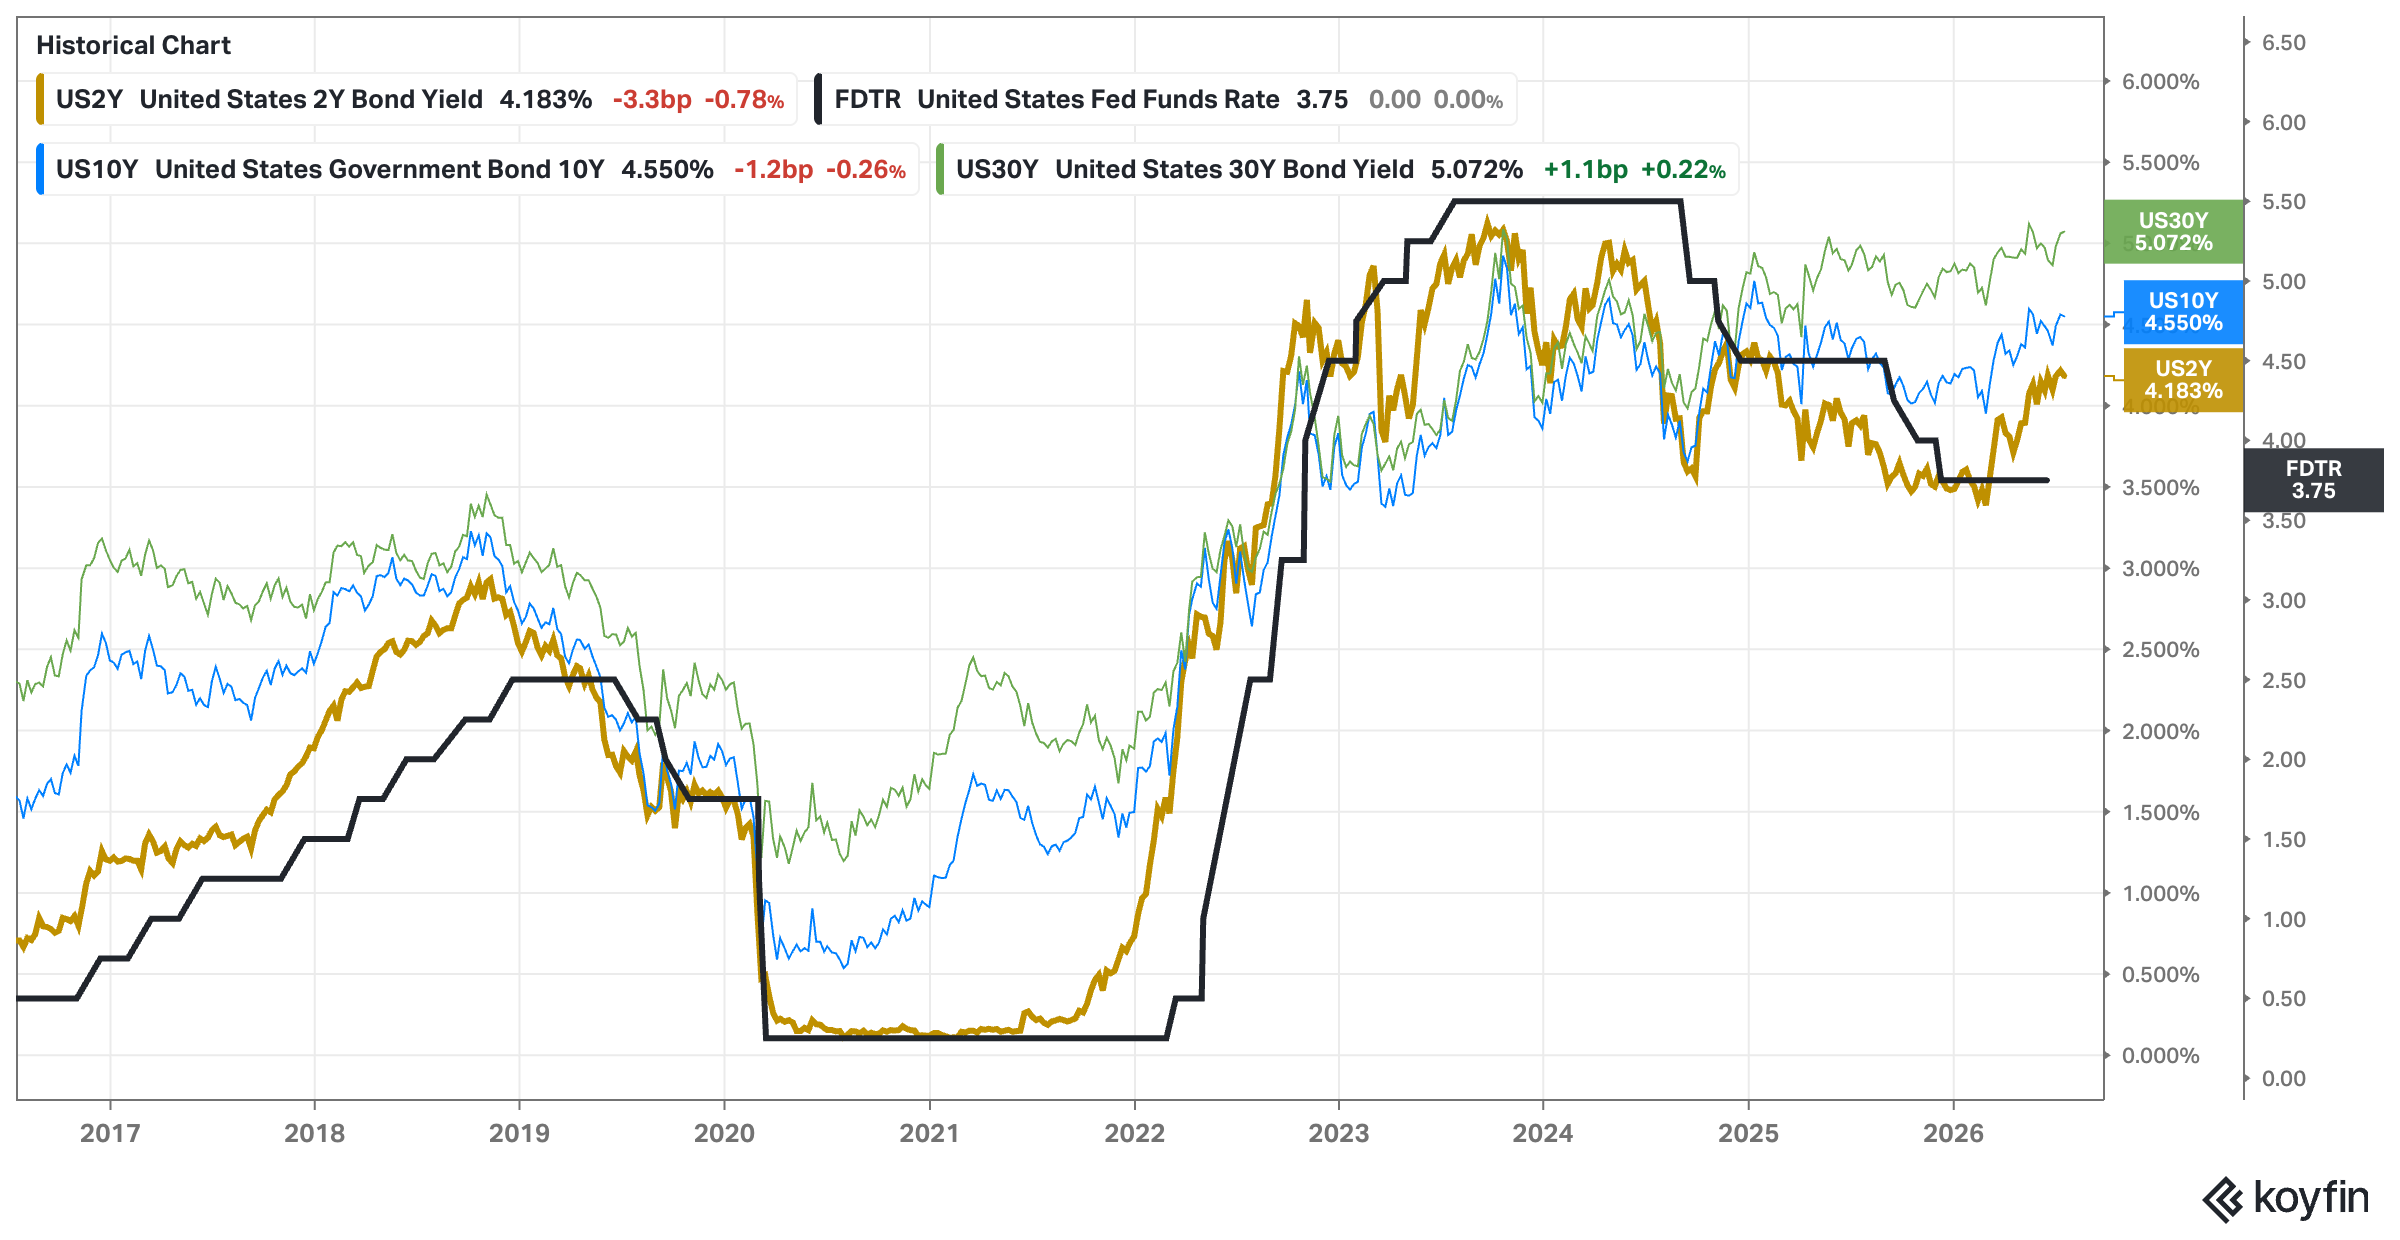
Analysis: Terms refuse to drop. The Fed may be forced to raise, which will certainly cool down the market. We prefer seeing those long and mid-term rates drop quickly.
Outlook: Neutral
Context: Why is it happening? Summary
Economic Production: Bullish
Economic Activity: Bullish
Interest Rates: Neutral
Market: What is happening?
Price Action: Cap. Weighted & Equal Weighted
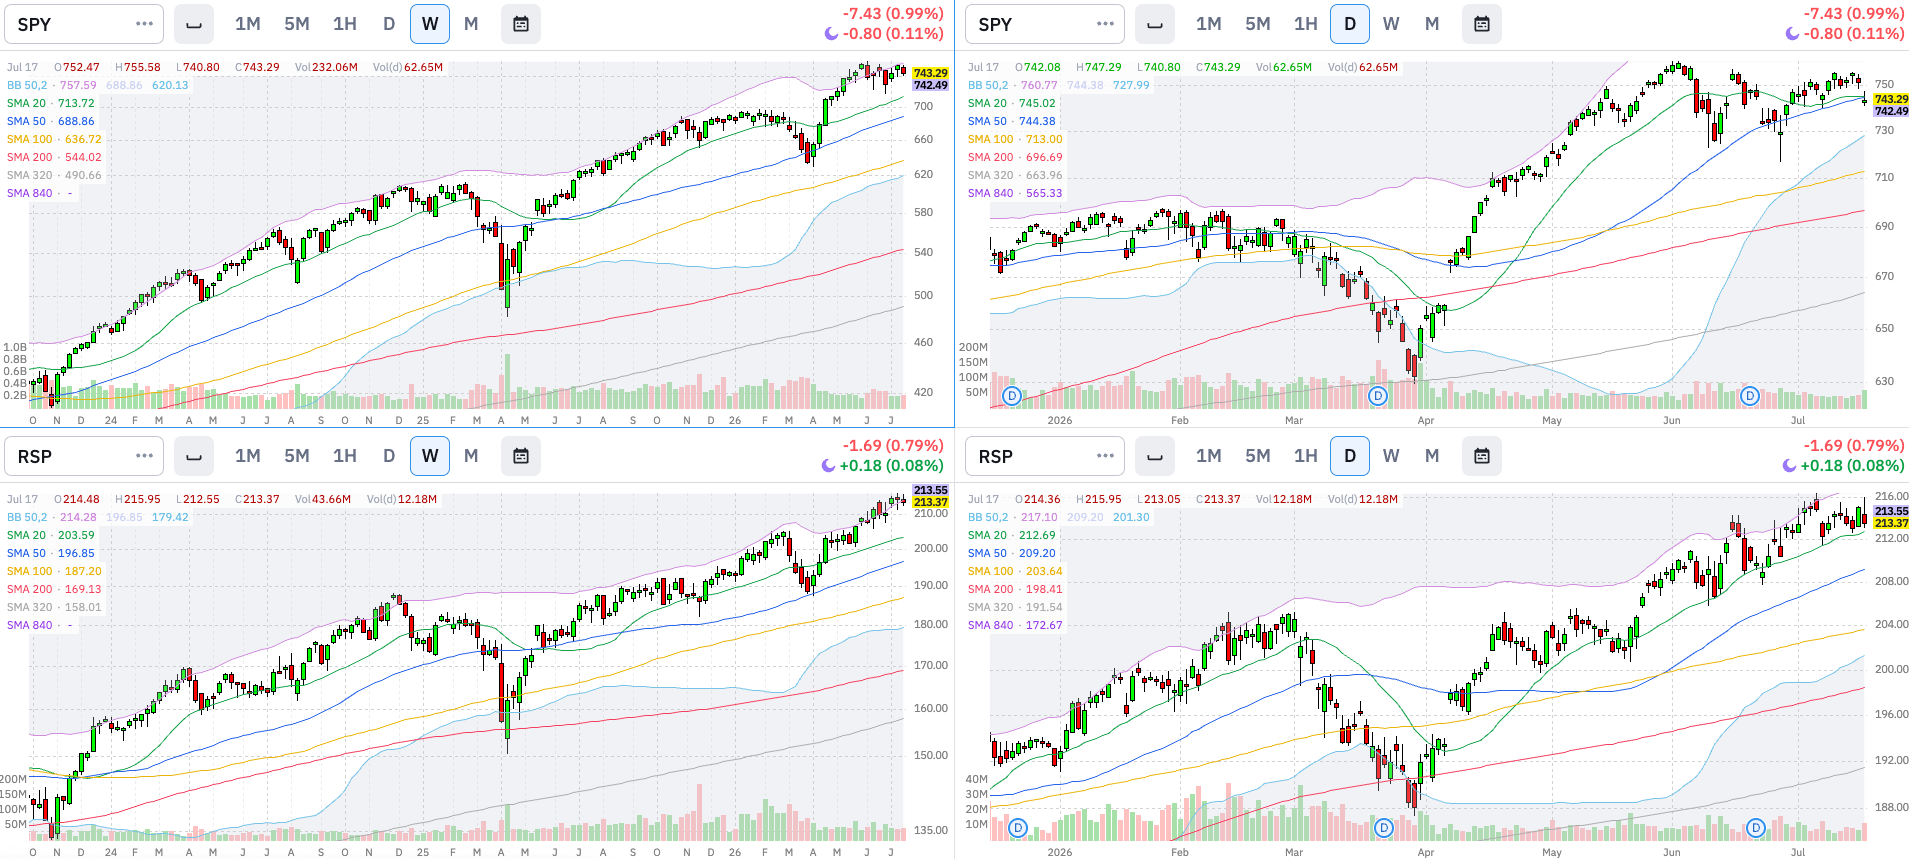
Analysis: SPY is facing difficulties to advance while RSP continues its uptrend. Breadth is expanding into the broader market, while big-cap stocks are facing difficulties to advance. SPY fell below both 20D and 50D SMAs on Friday.
Wyckoff Stage: Distribution
Momentum: Stochastics and MACD
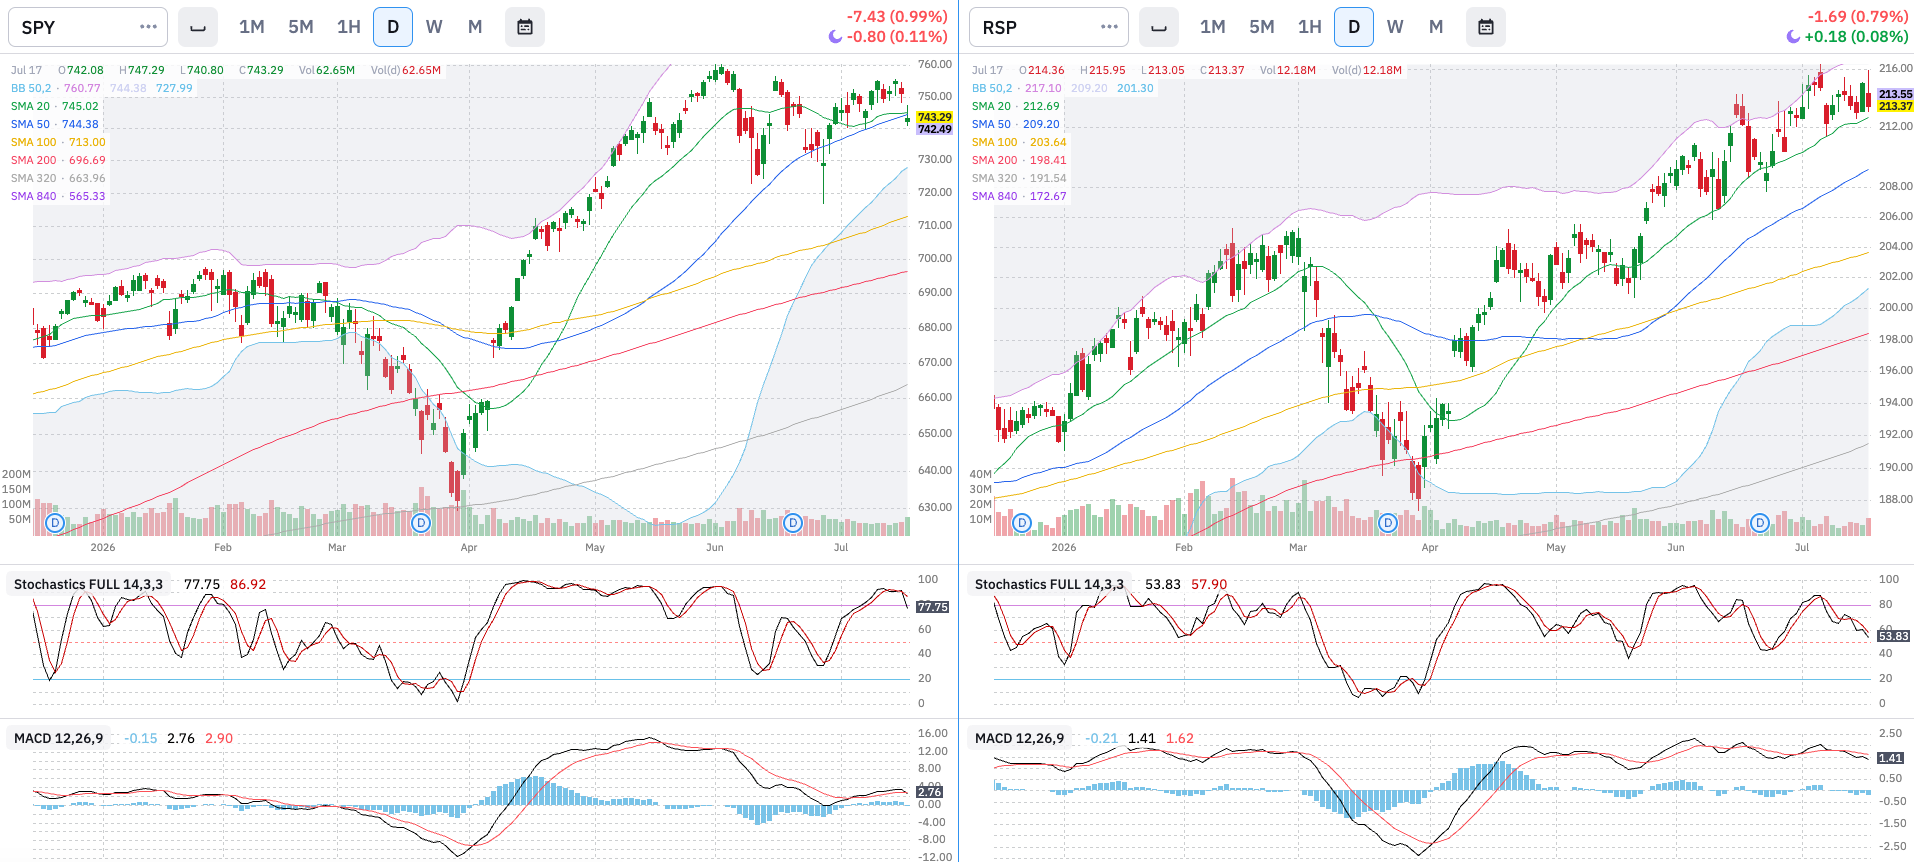
Analysis: Both indexes are having coming down from overbought territories.
Outlook: Bearish
Breadth: % Stocks above SMAs
Above 200 Daily SMA
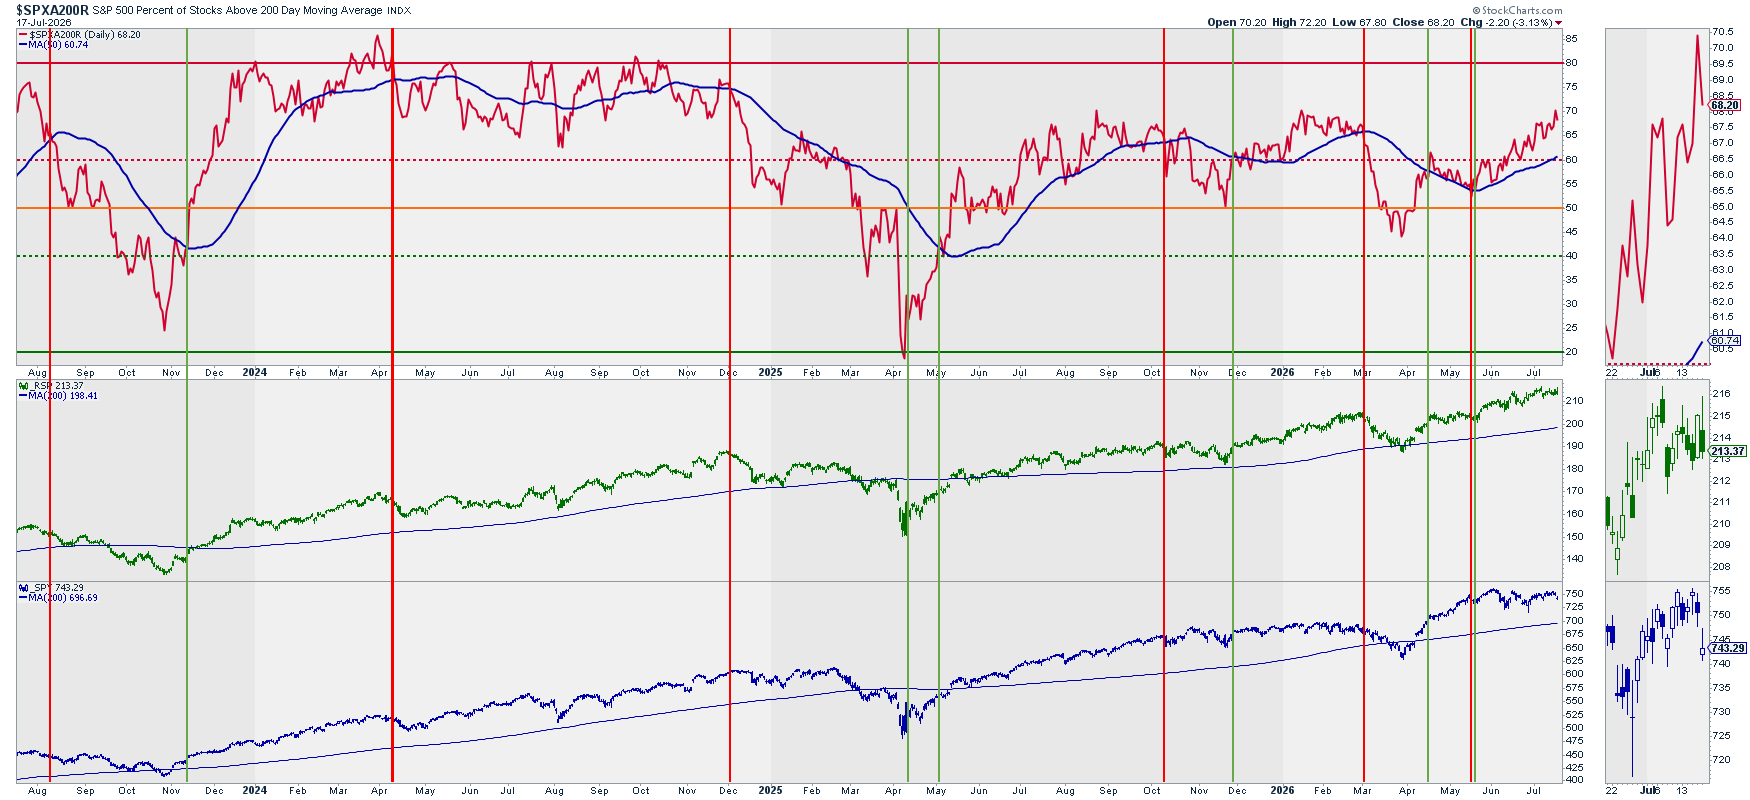
Above 20, 50, and 200 Daily SMAs vs. RSP
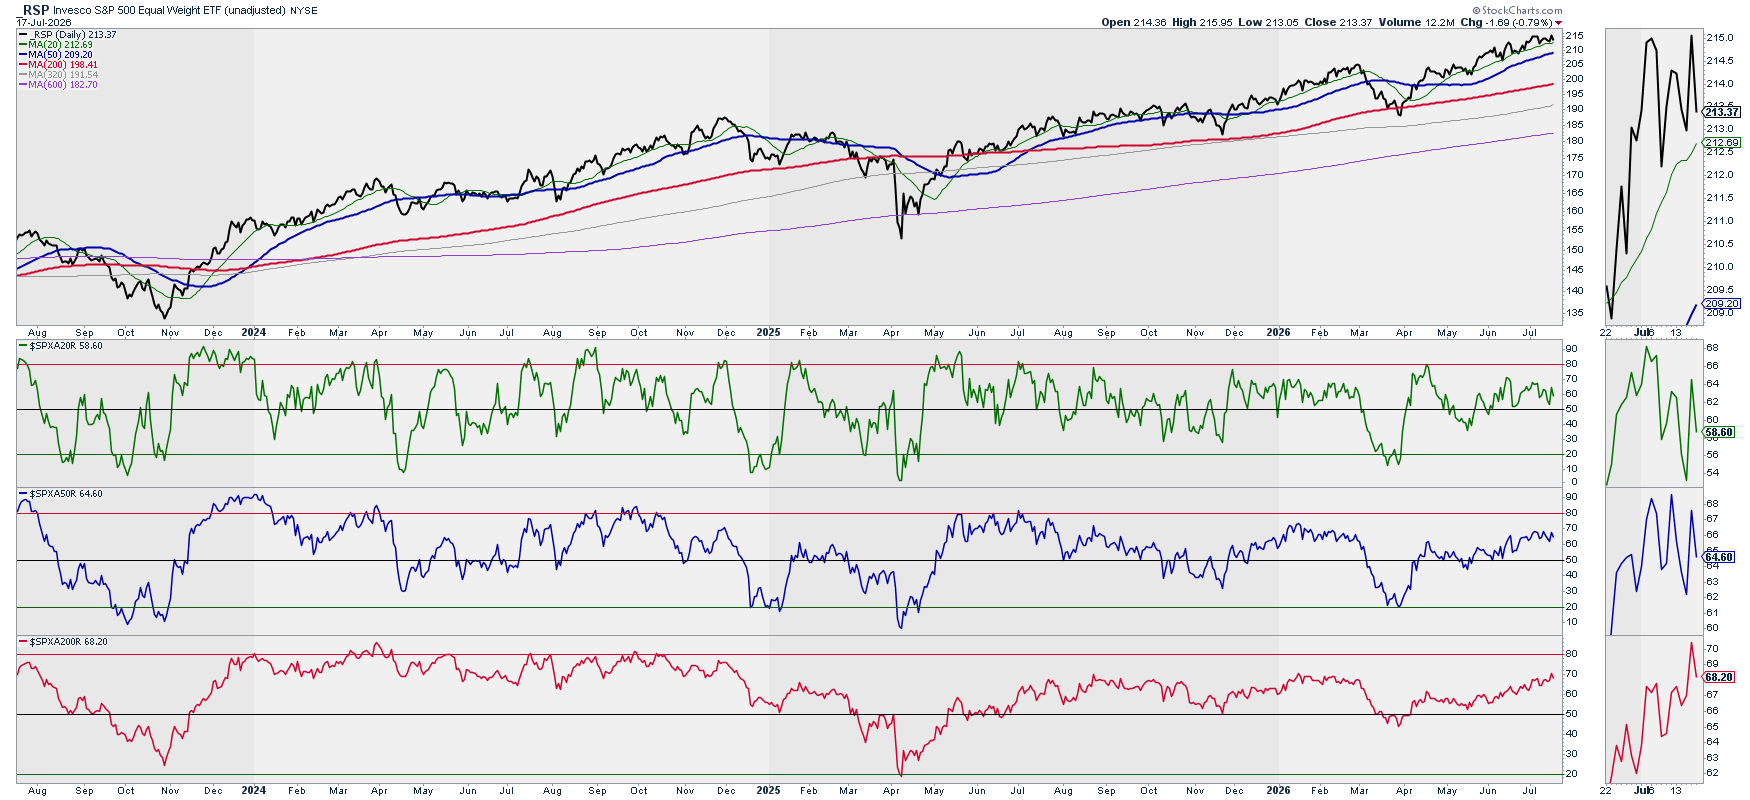
Analysis: Breadth is expanding and we have room to run. We remain on bullish territory.
Outlook: Bullish
Volatility: Ratio Low Vol. Stocks / SPY vs. RSP & SPY
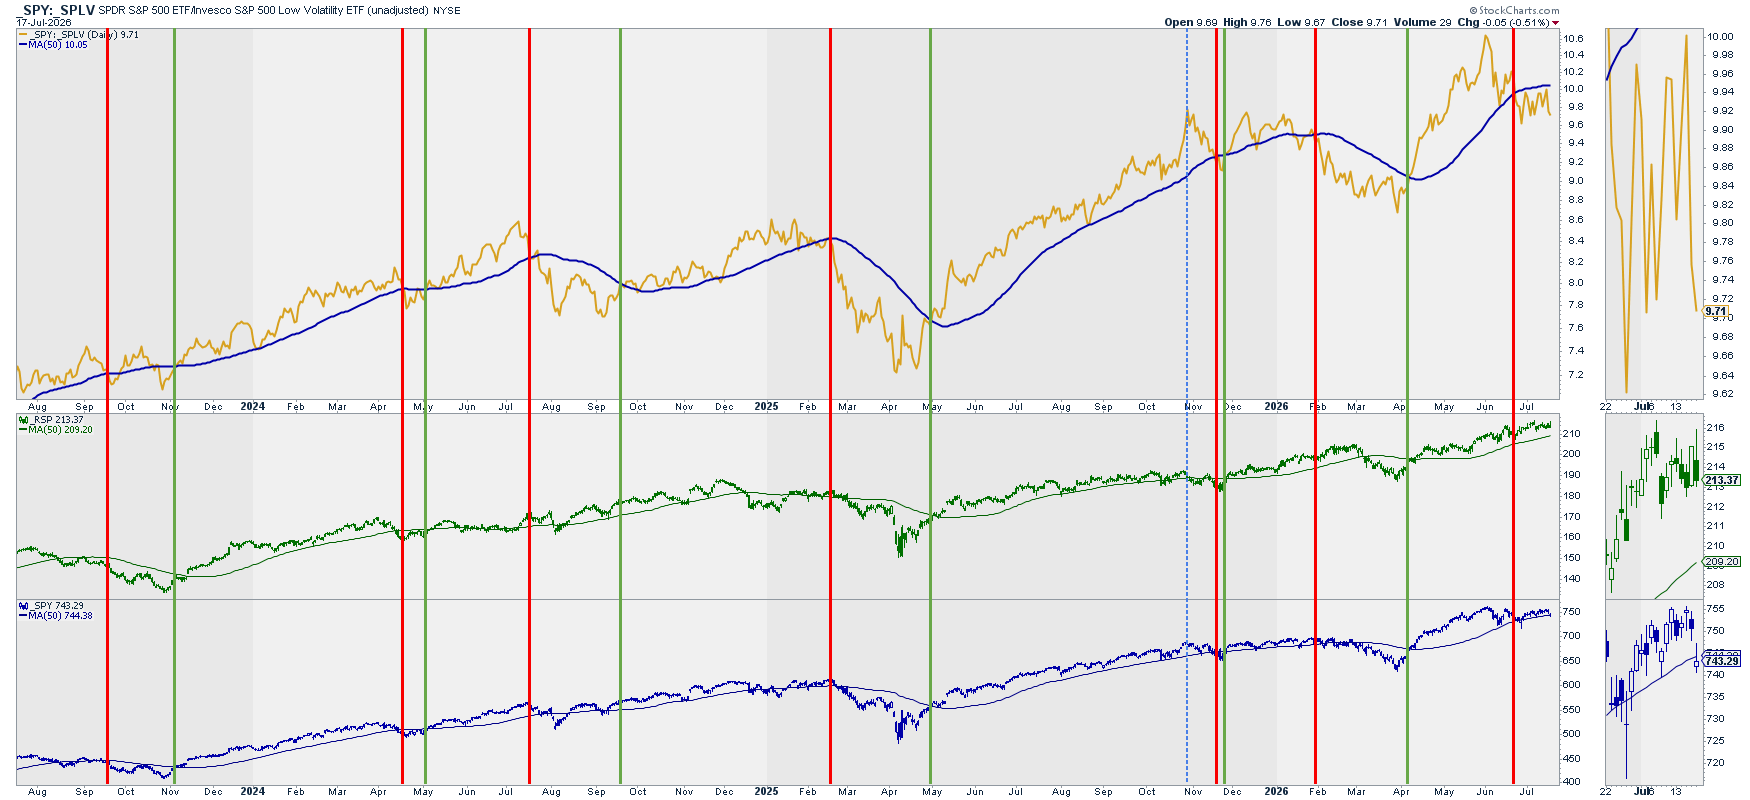
Analysis: This very reliable ratio seems bound to reverse the bearish signal into a bullish one.
Outlook: Bearish
Volatility: VIX vs. RSP & SPY
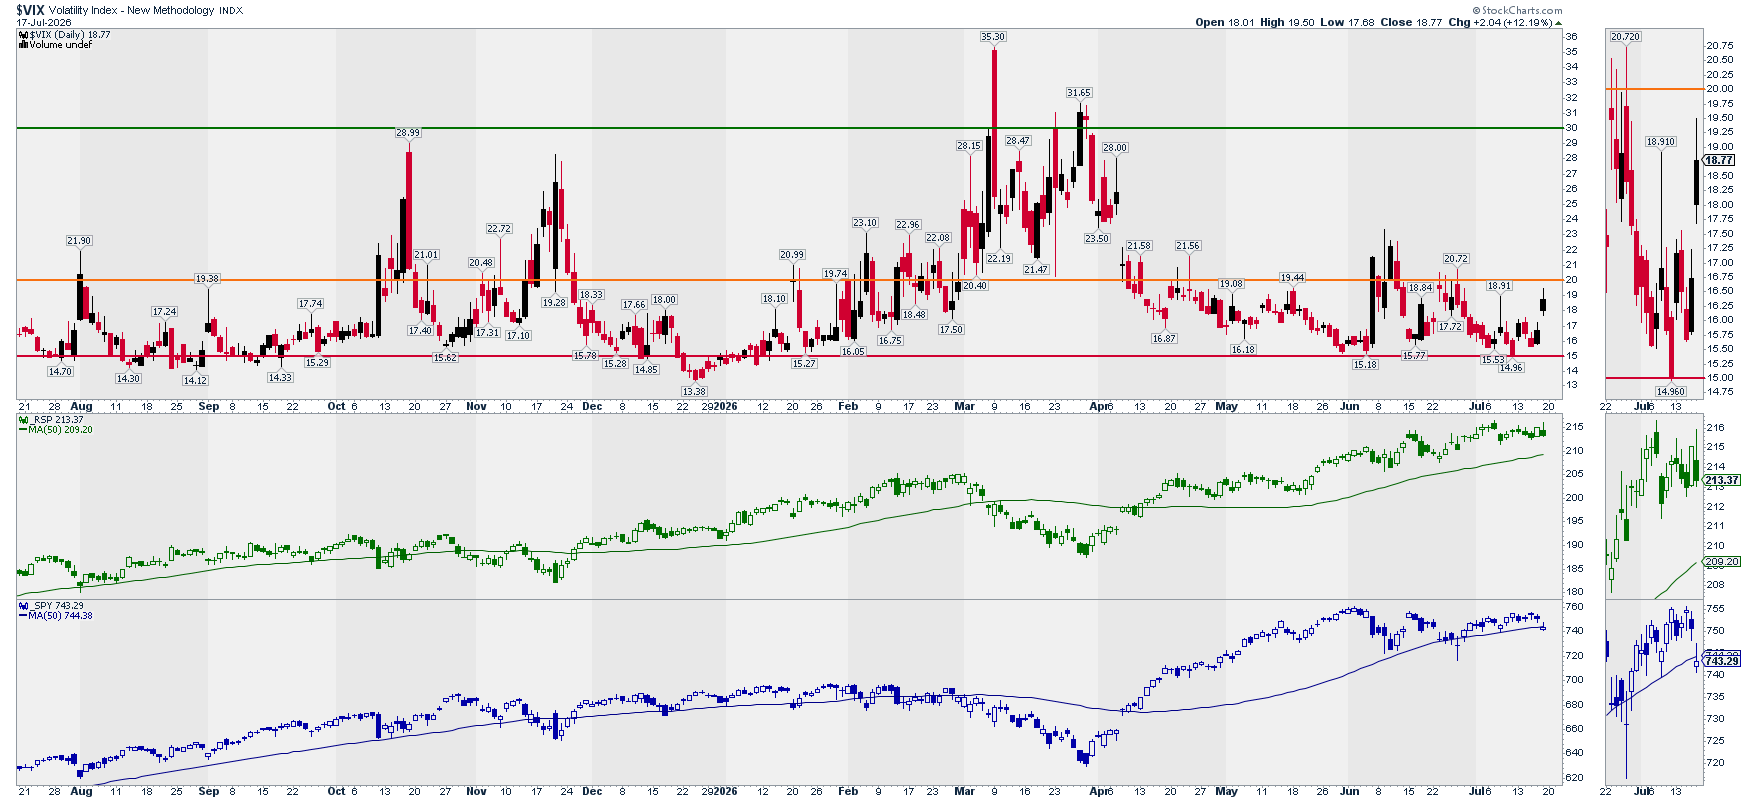
Note: This chart is mainly to detect extreme volatility situations that, once they reverse, offer great long opportunities in the market.
Analysis: VIX entering the bullish 15 level area.
Options: (Inverted) Put/Call Ratio vs. SPY
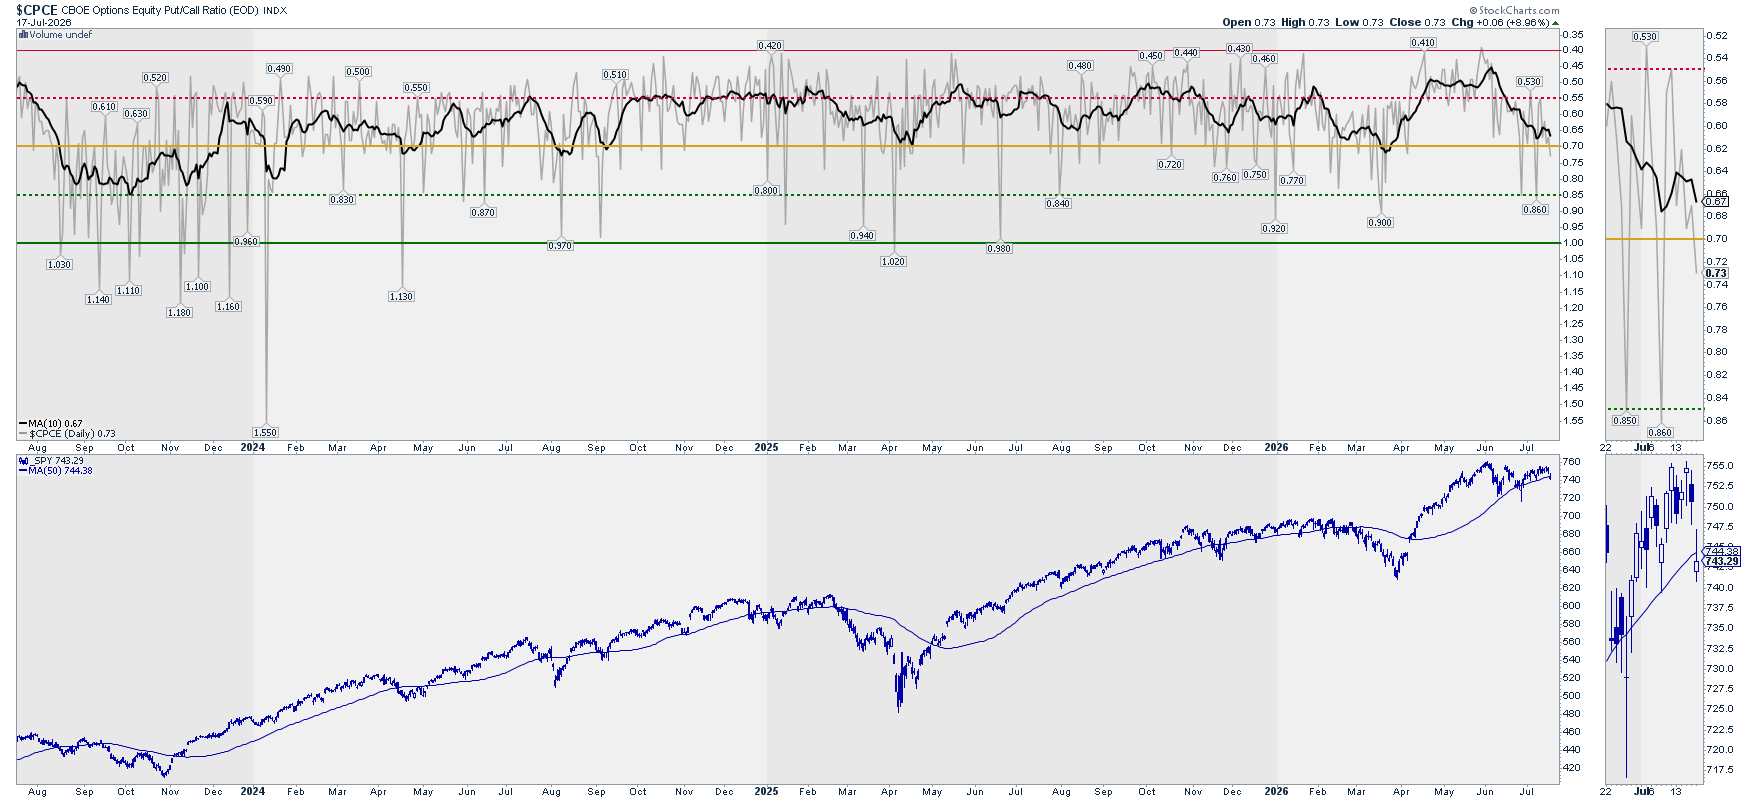
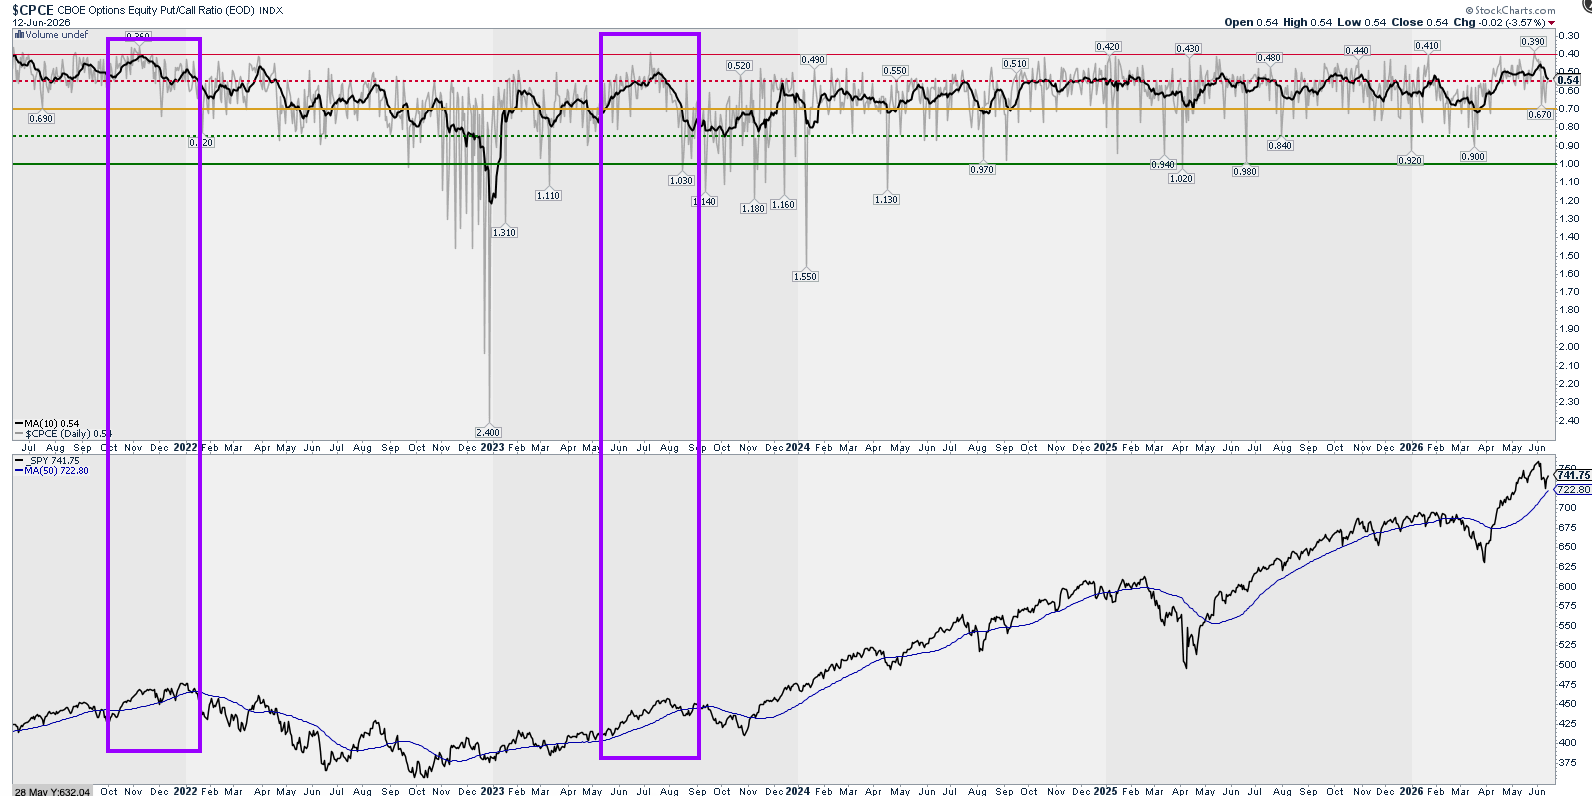
Analysis: Low spot reading (gray) which will push lower the signal (black) line, and the market with it.
Outlook: Bearish
Options: Gamma Exposure – SPY
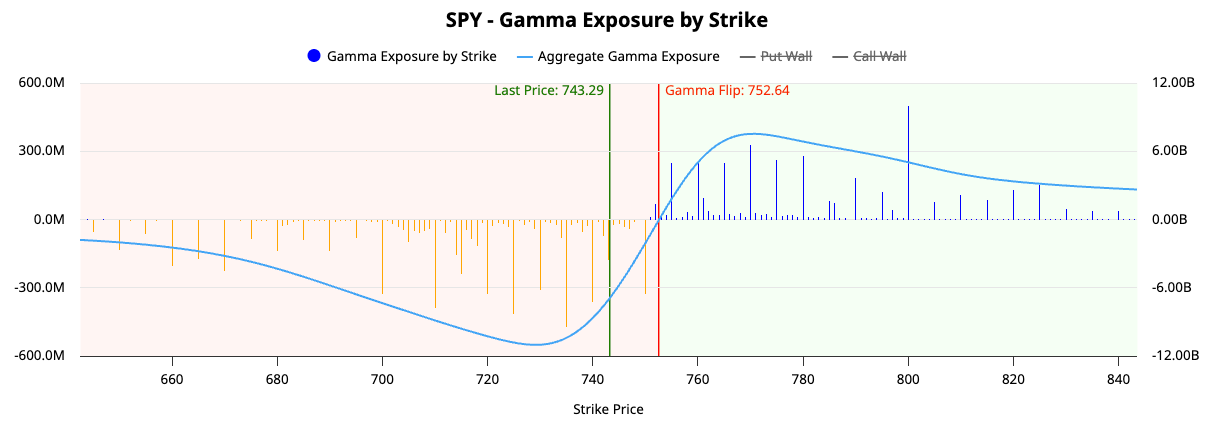
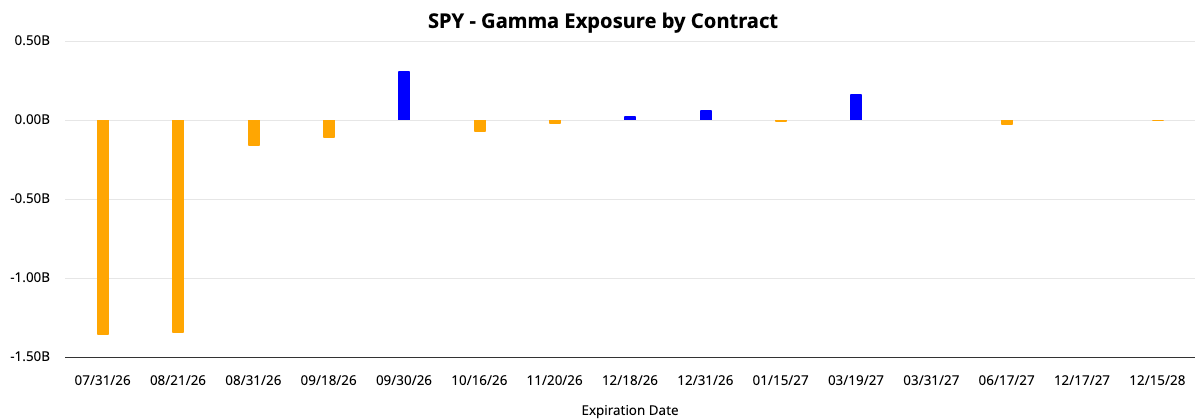
Analysis: GEX in clear negative territory with negative outlook for August.
Outlook: Bearish
Market: What is happening? Summary
Price Action: Distribution
Momentum: Bearish
Breadth: Bullish
Volatility: Bearish
Options: Bearish
Sectors: Where is it happening?
Sectors Rotation
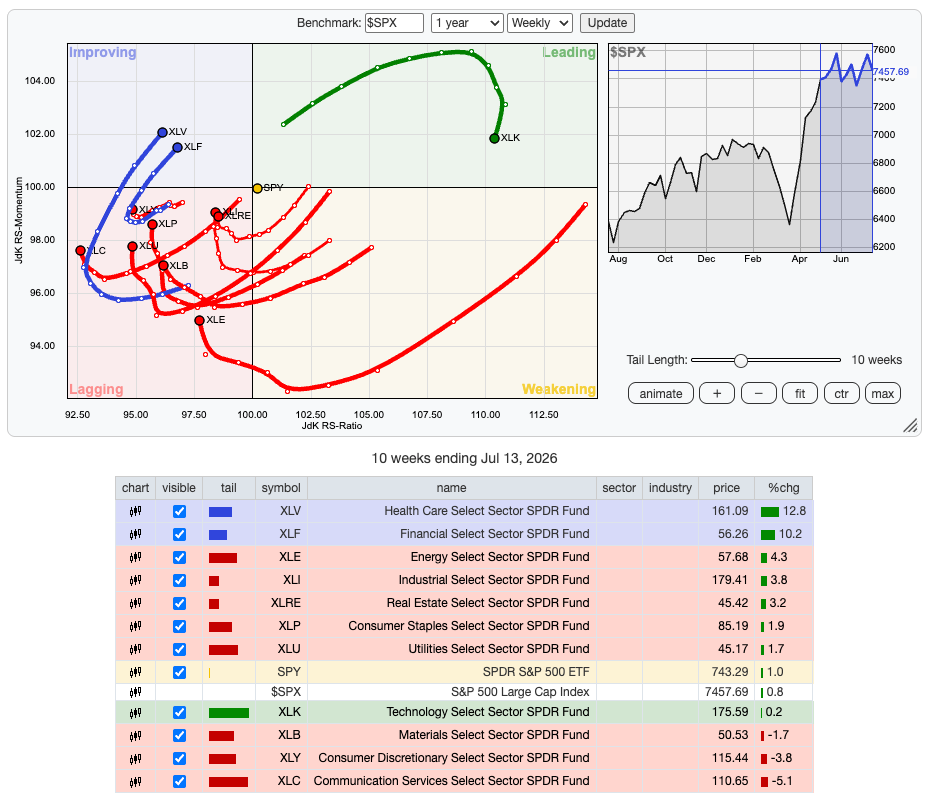
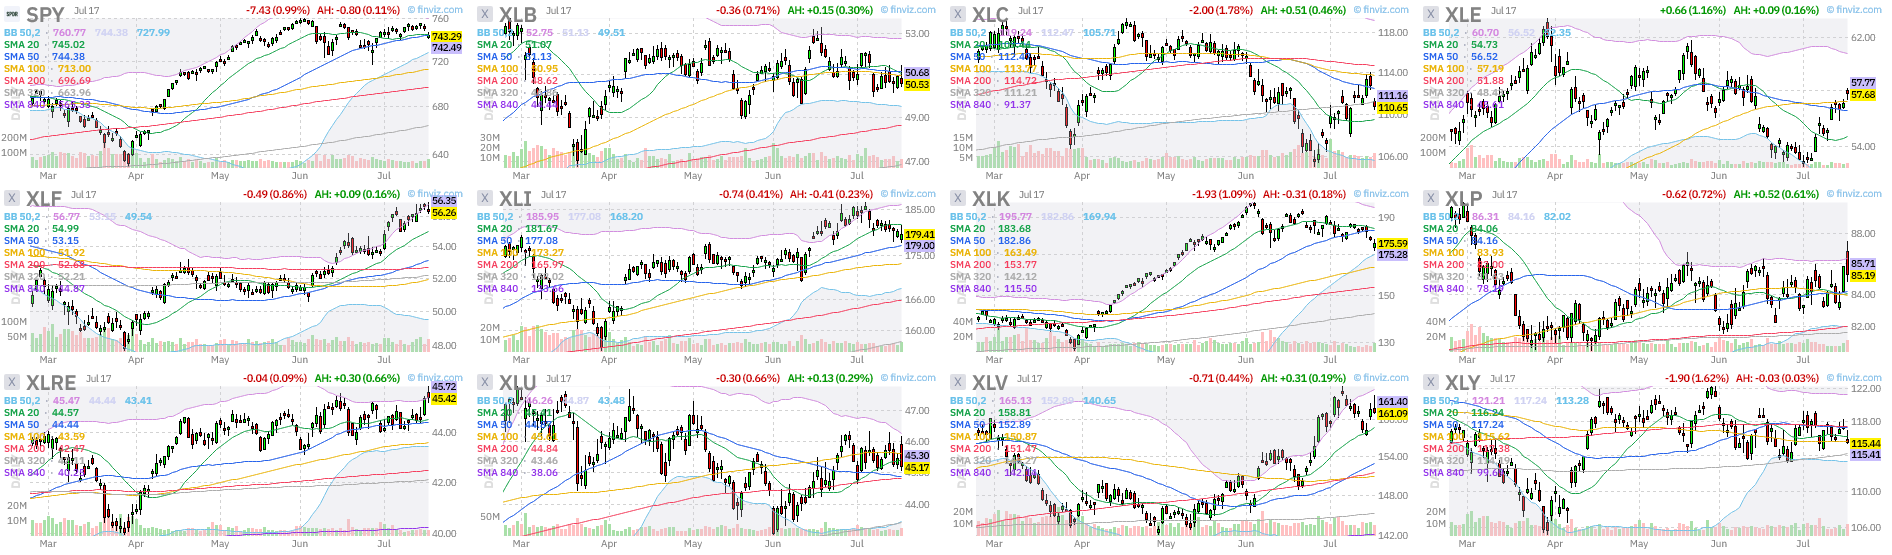
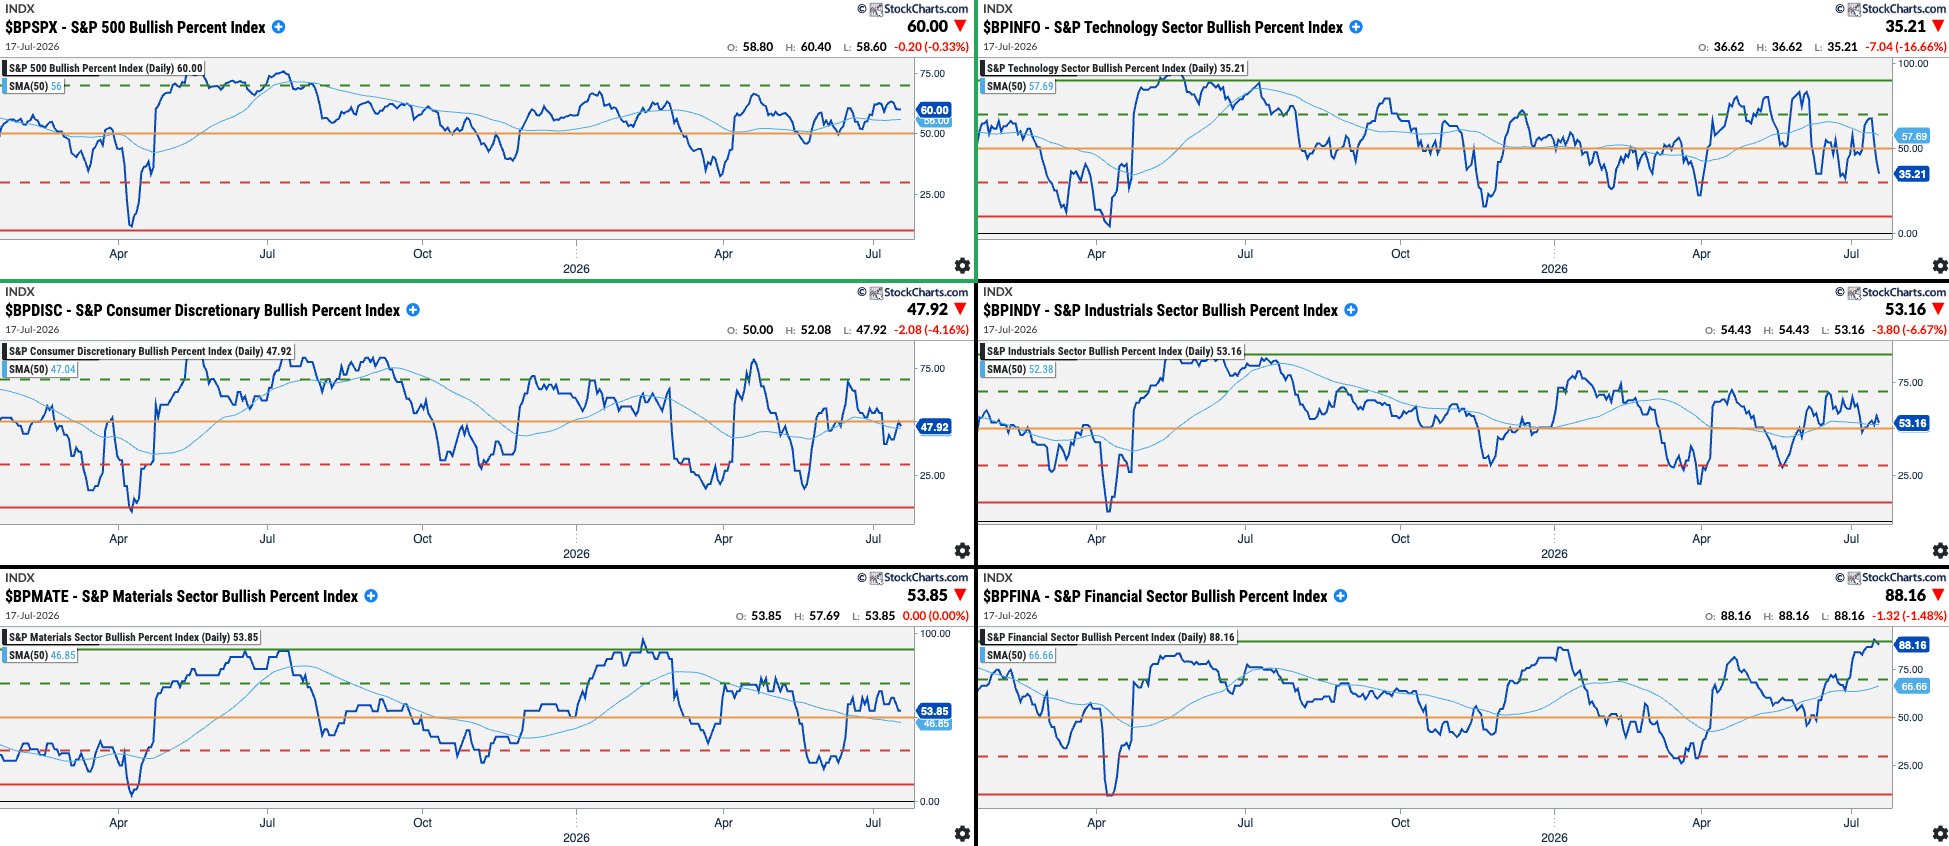
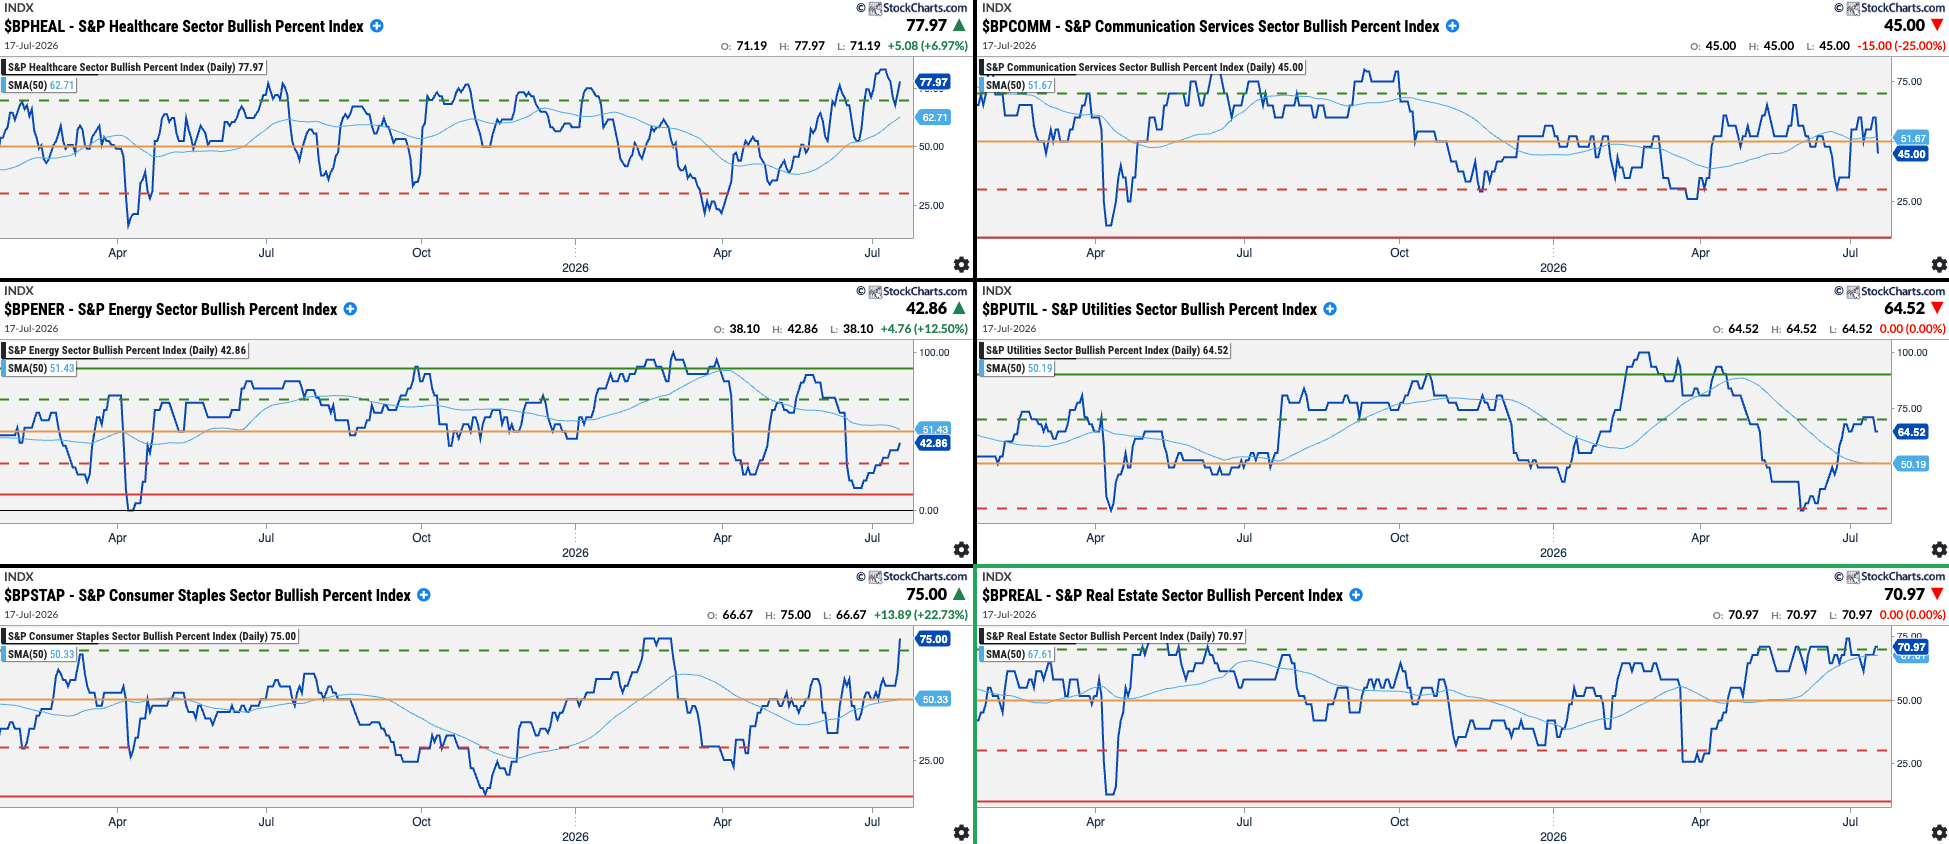
Analysis: Focus on XLV and XLF for mid- to long-term opportunities. XLE is heavily influenced by Iran’s war and oil’s price.
SPX Pct. Bullish Indicator shows us Bullish Outlook.
Scanners: Scanning for opportunities
S&P500 and Nasdaq New Highs in Leading Sectors
Descriptive
Index: S&P 500 and Nasdaq | Market Cap.: +Mid (+$2B) | Option/Short: Yes/Yes
Avg. Volume: >1M | Price: >$10
(order by Market Cap desc.)
Technical
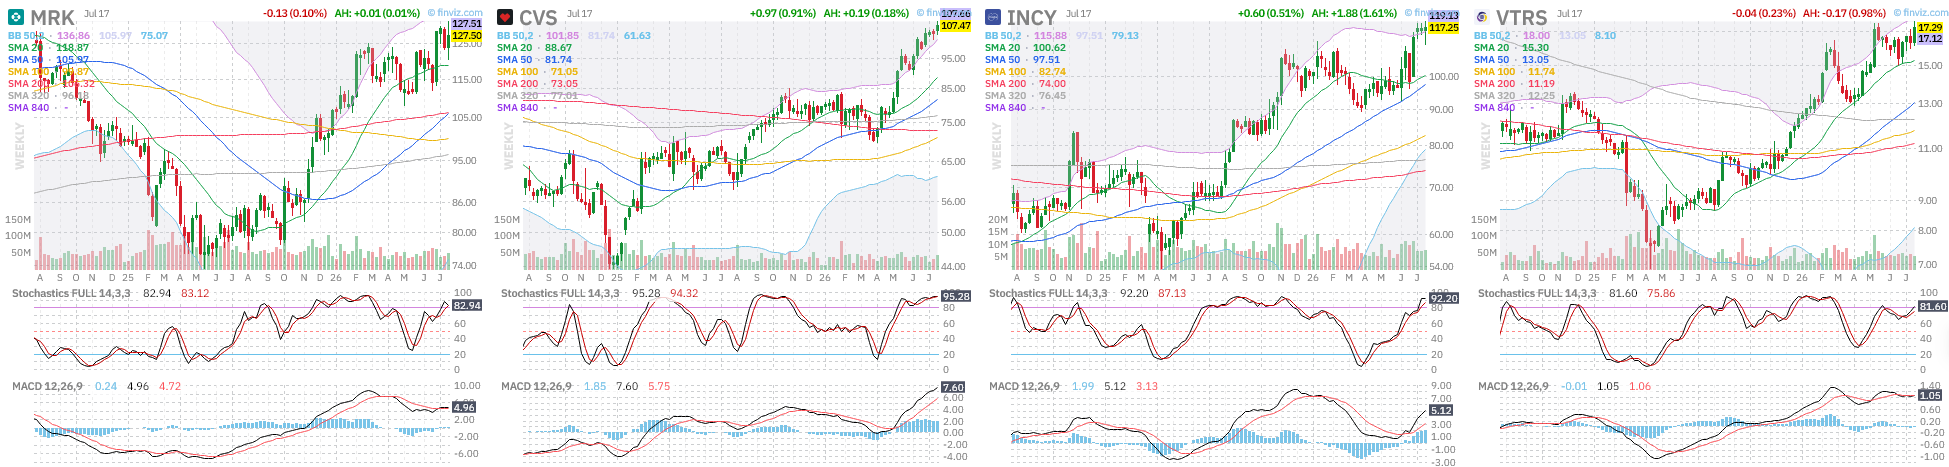
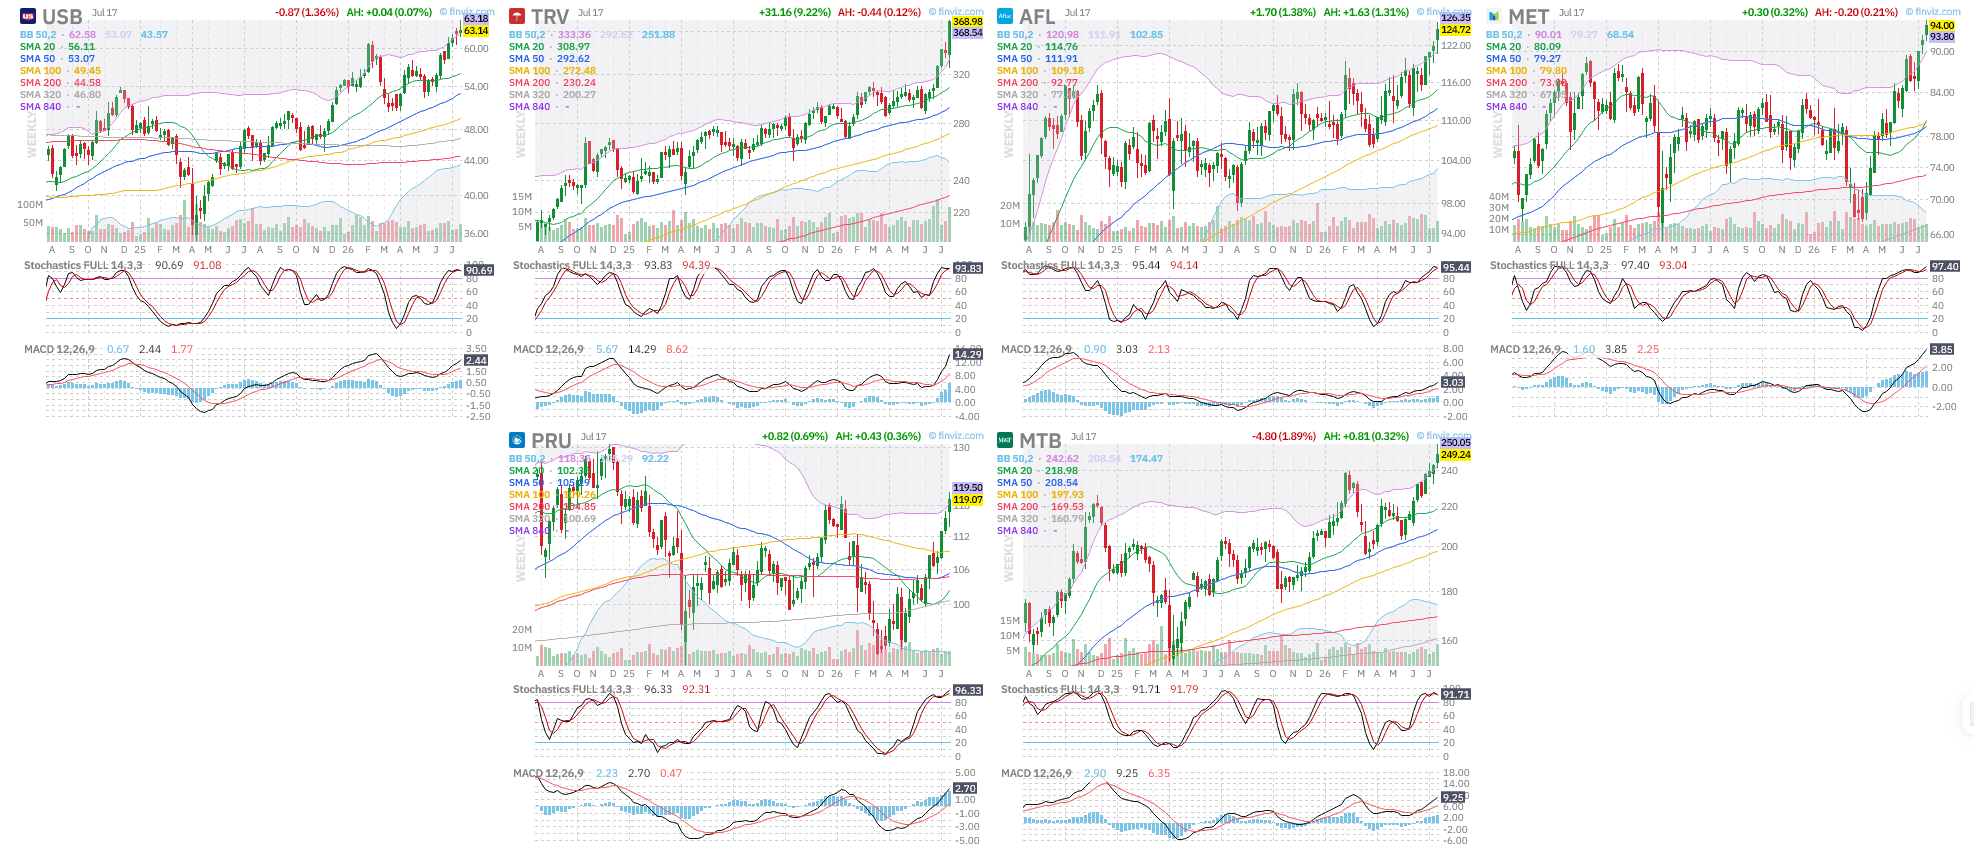
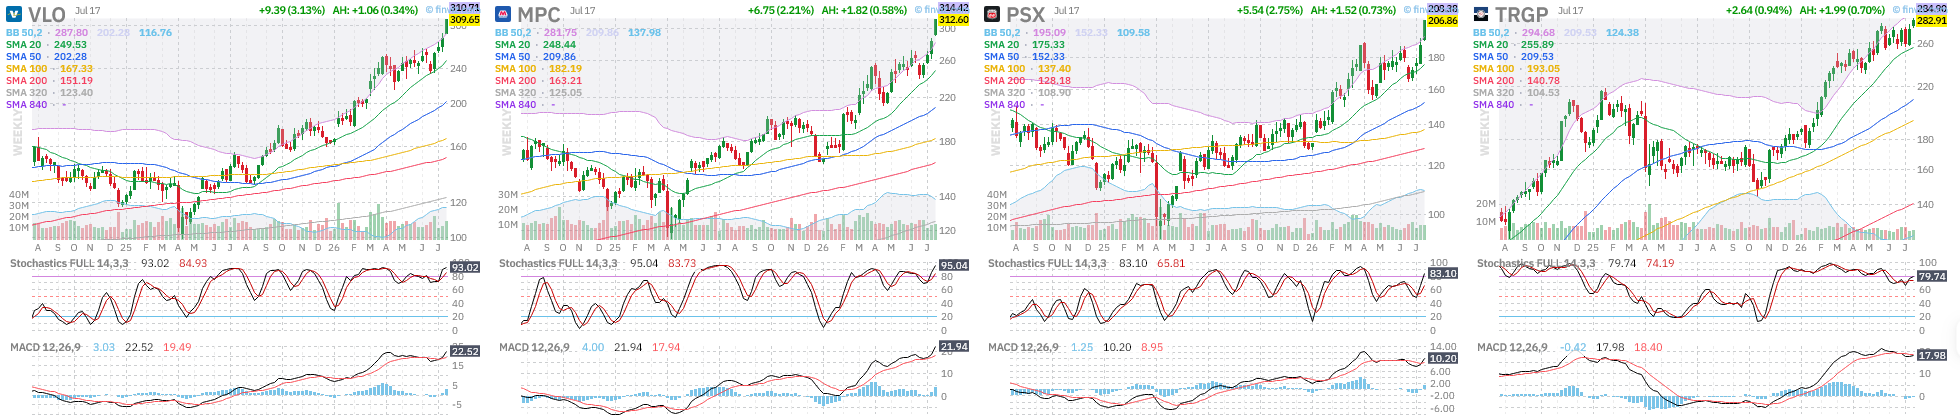
50-Day New High
XLV: Healthcare:
XLF: Financials:
XLE: Energy
Disclaimer: The content on AMAT Investing is strictly for educational and learning purposes. The author is not a licensed financial advisor and holds no formal financial education. This post does not constitute professional financial advice. All investing involves risk of loss. Always conduct your own research and consult a licensed professional before making any investment decisions.