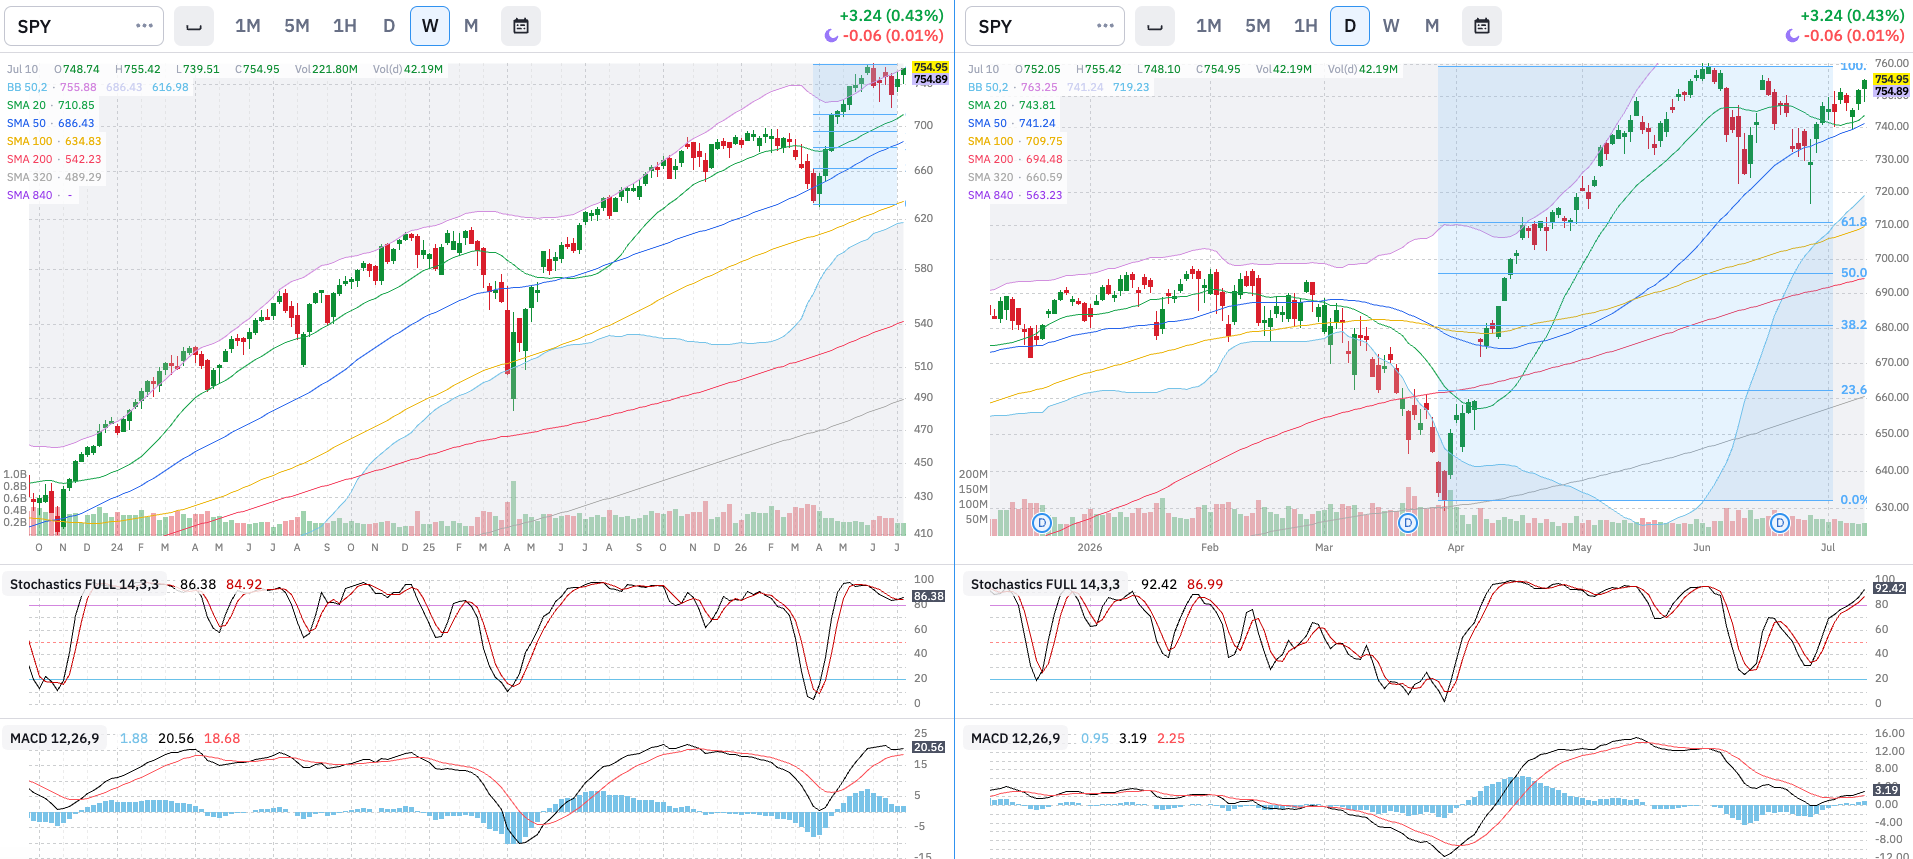
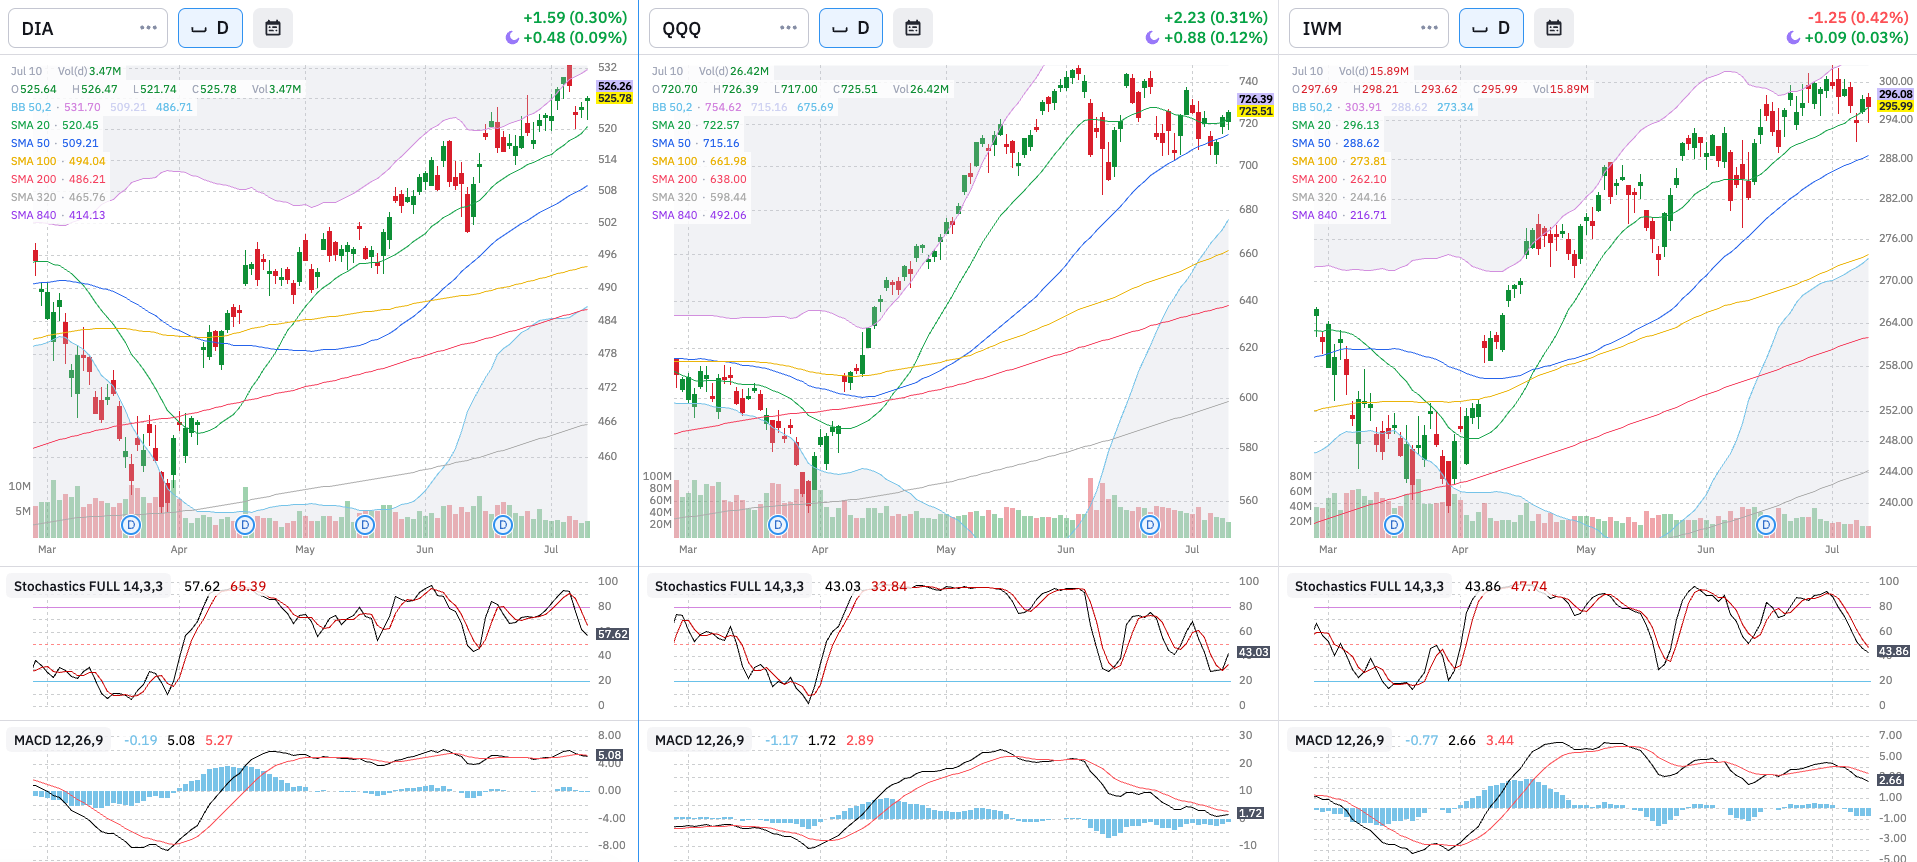
Comment: SPY found support in both 20D and 50D SMAs and seems ready to tackle new highs again soon. Interestingly, neither DIA, QQQ, nor IWM are in the same pattern. These 3 indexes have found support on their shorter SMAs but they are not in the position to take out previous highs. Just be looking at these correlations we could think that breadth is expanding as something else than technology and the big names is supporting the SPY.
Level 1: Why is it happening?
Economic Data: Production: ISM PMI vs. SPX
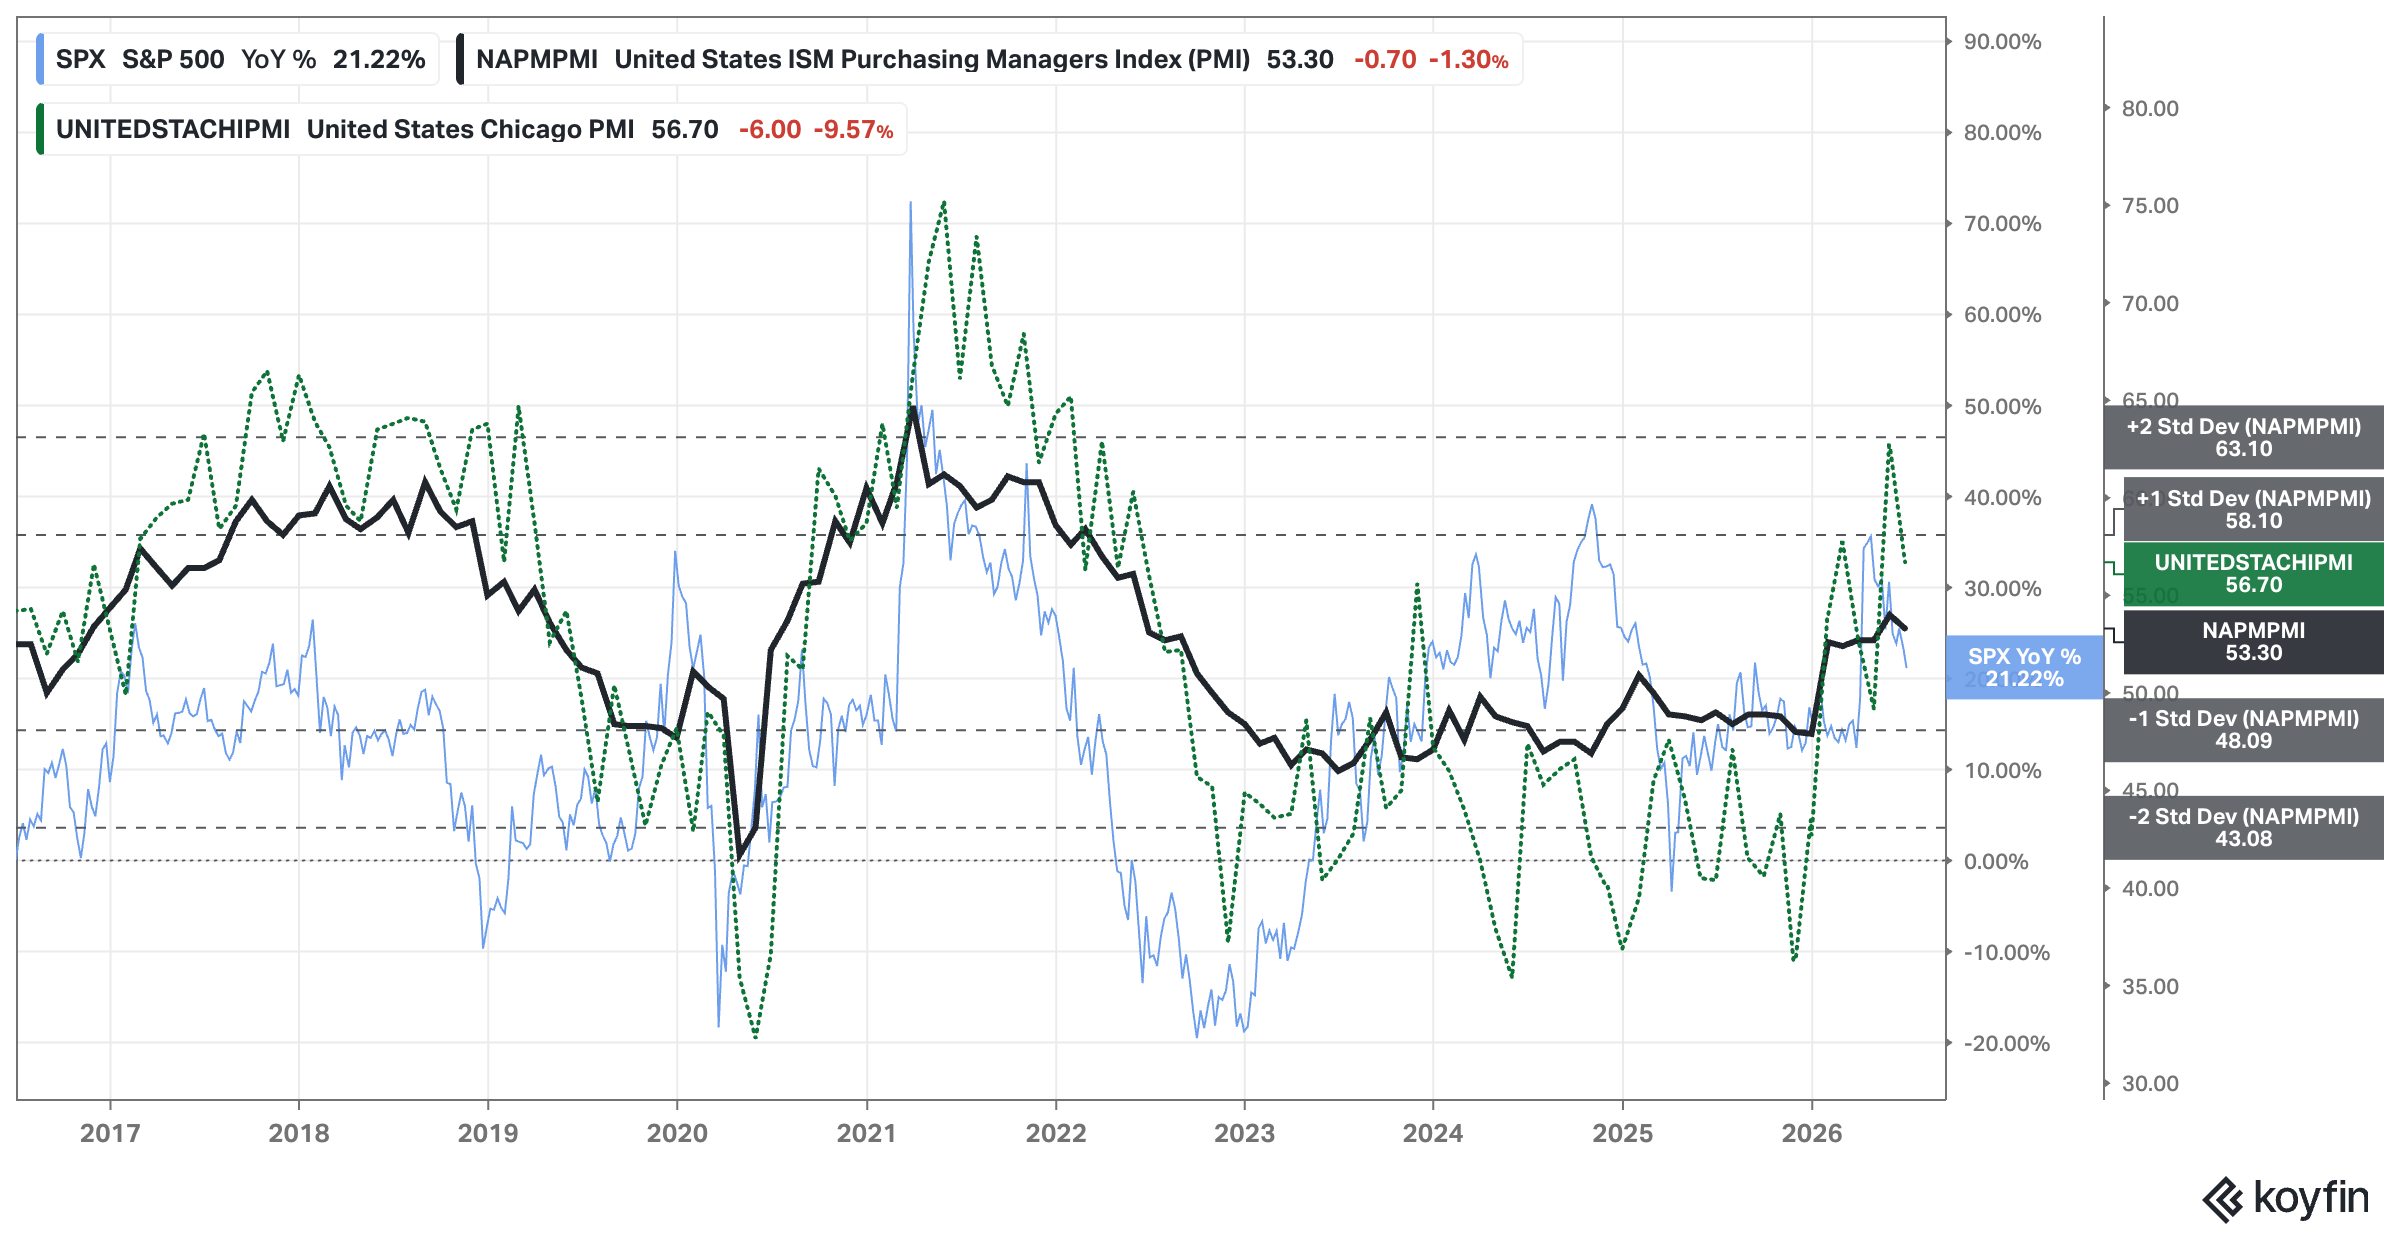
Analysis: No changes since last week.
Current Situation: Bullish
Future Outlook: Bullish
Economic Data: Activity: Regional Banks Performance
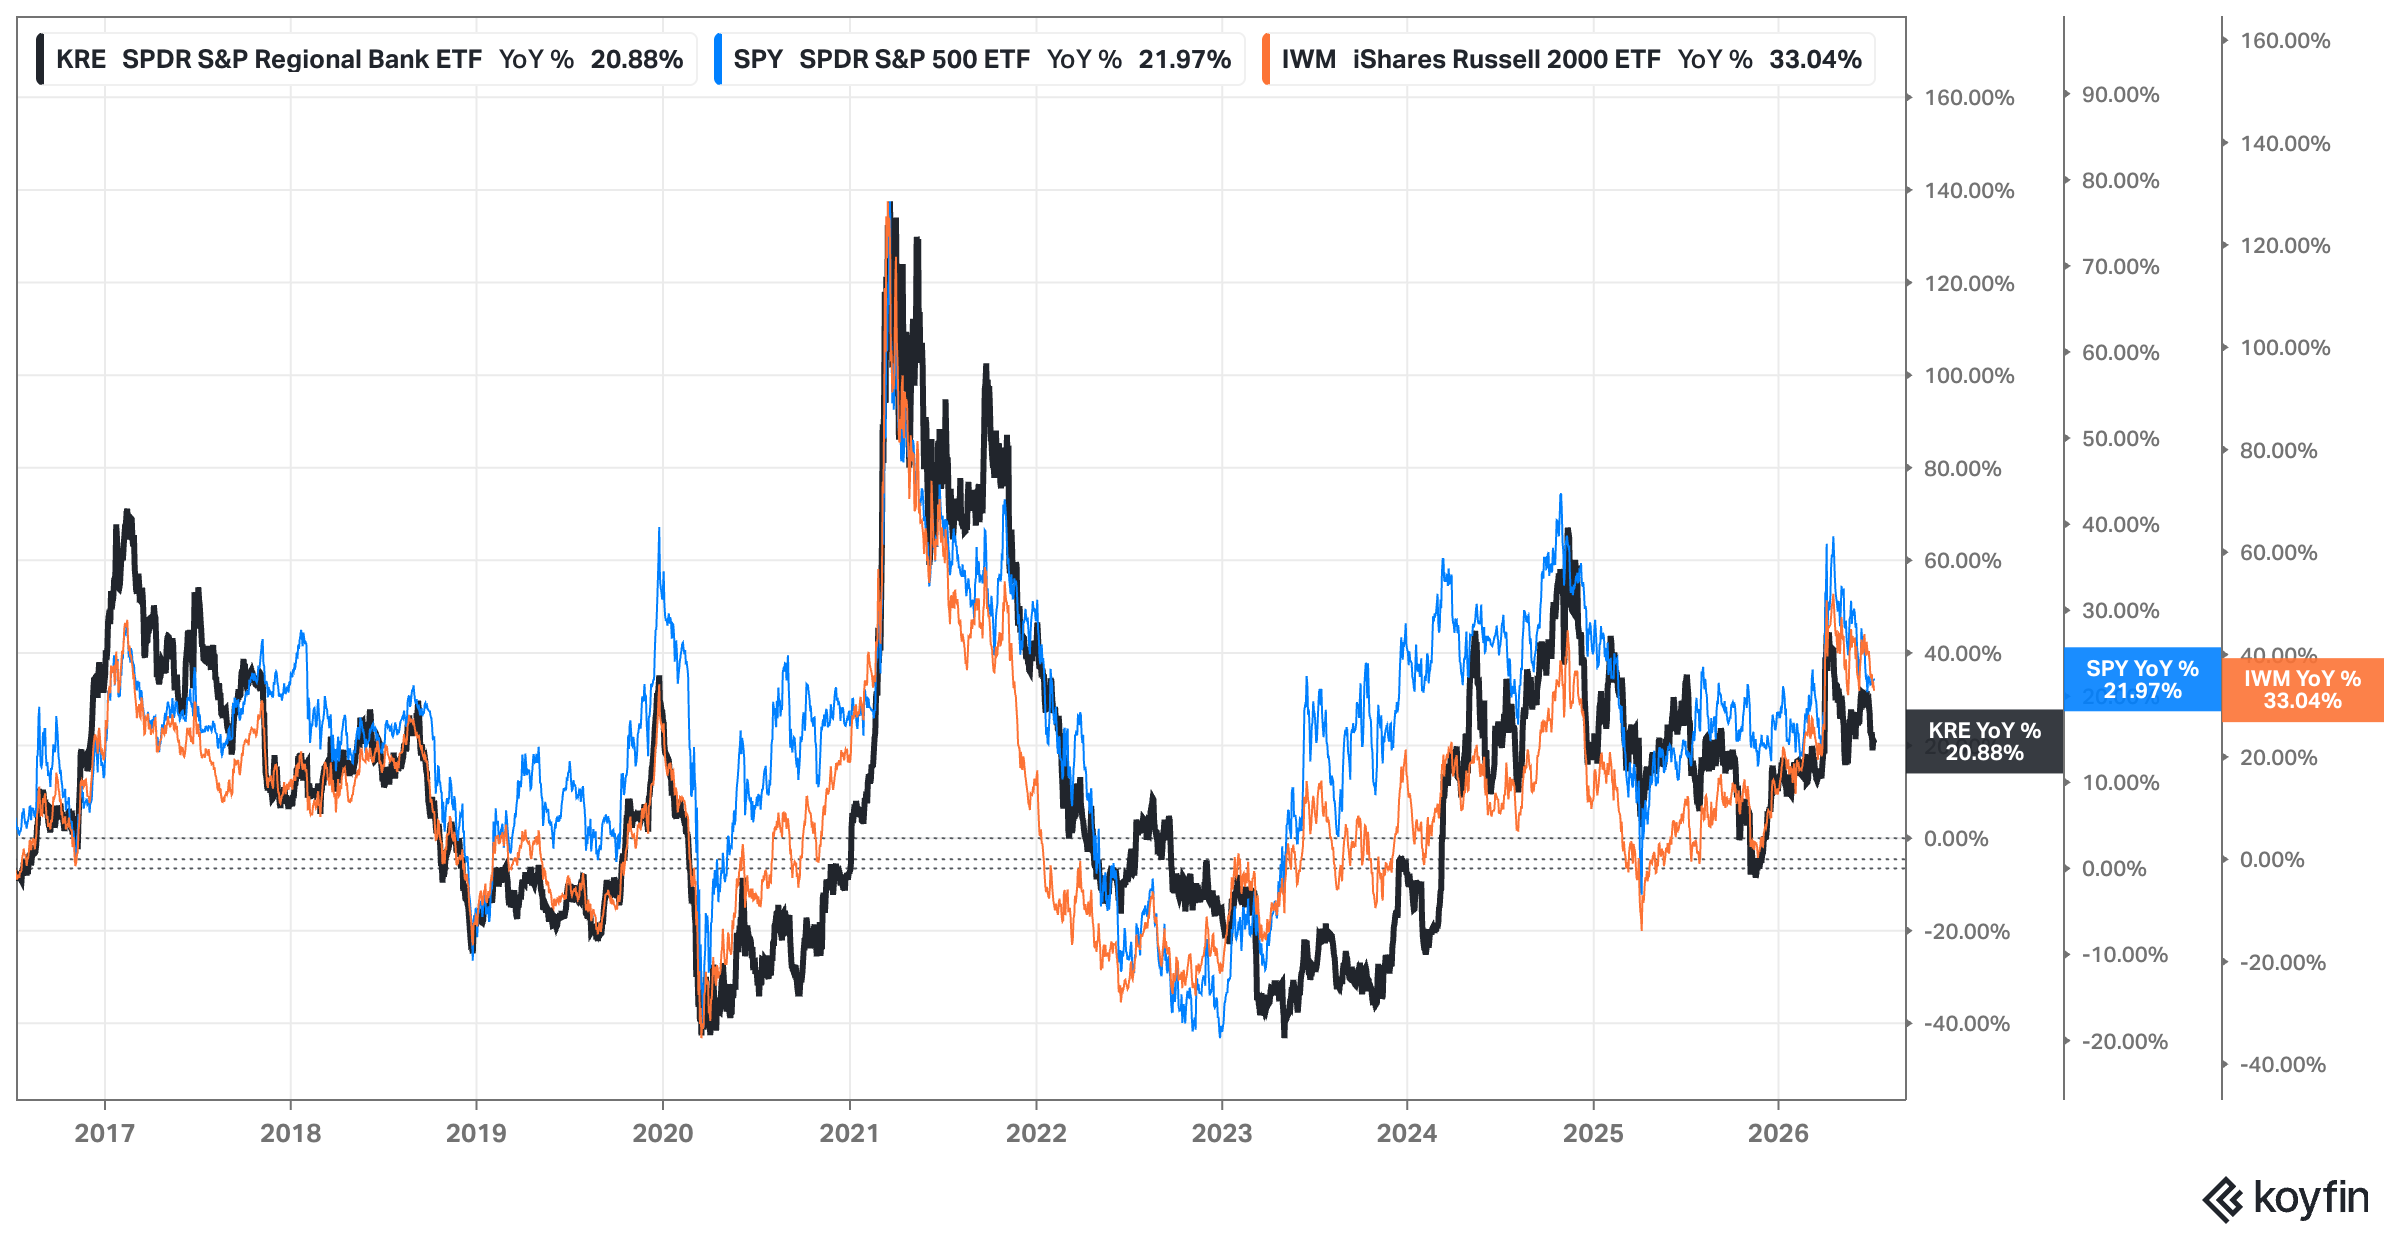
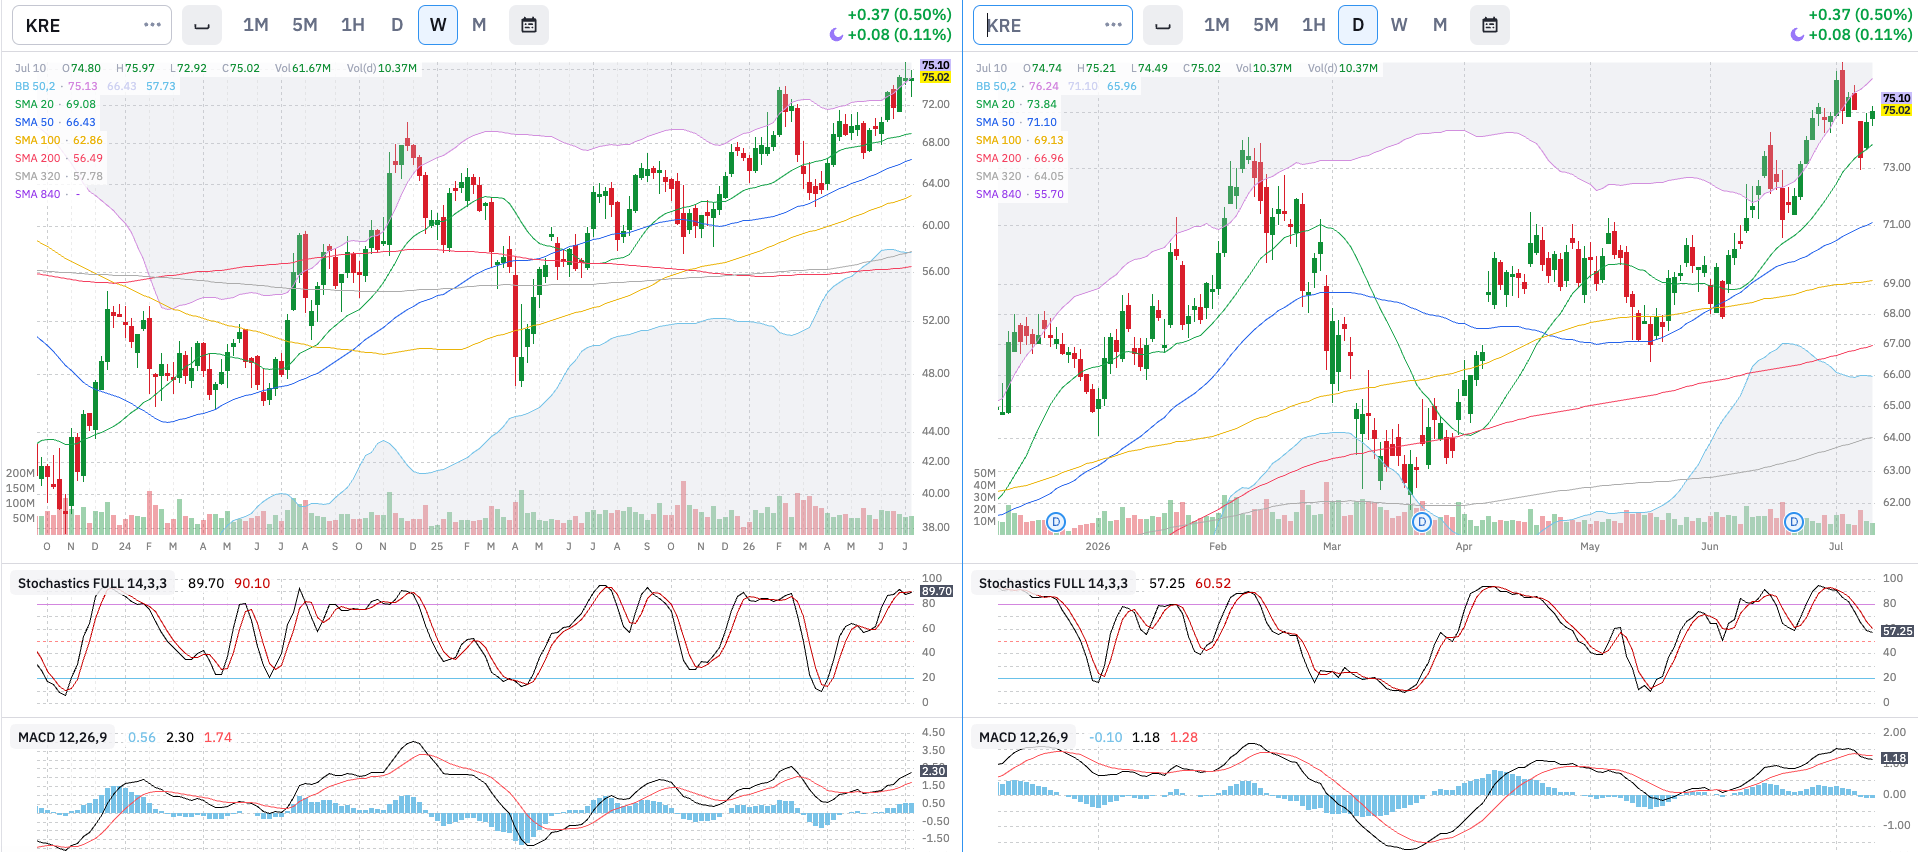
Analysis: KRE weekly stochastics and BB indicate that price is overbought. We had some correction last week but nothing major. Still the uptrend is clear.
Current Situation: Bullish
Future Outlook: Bullish
Interest Rates: FED, 2yr, 10yr, and 30yr Rates
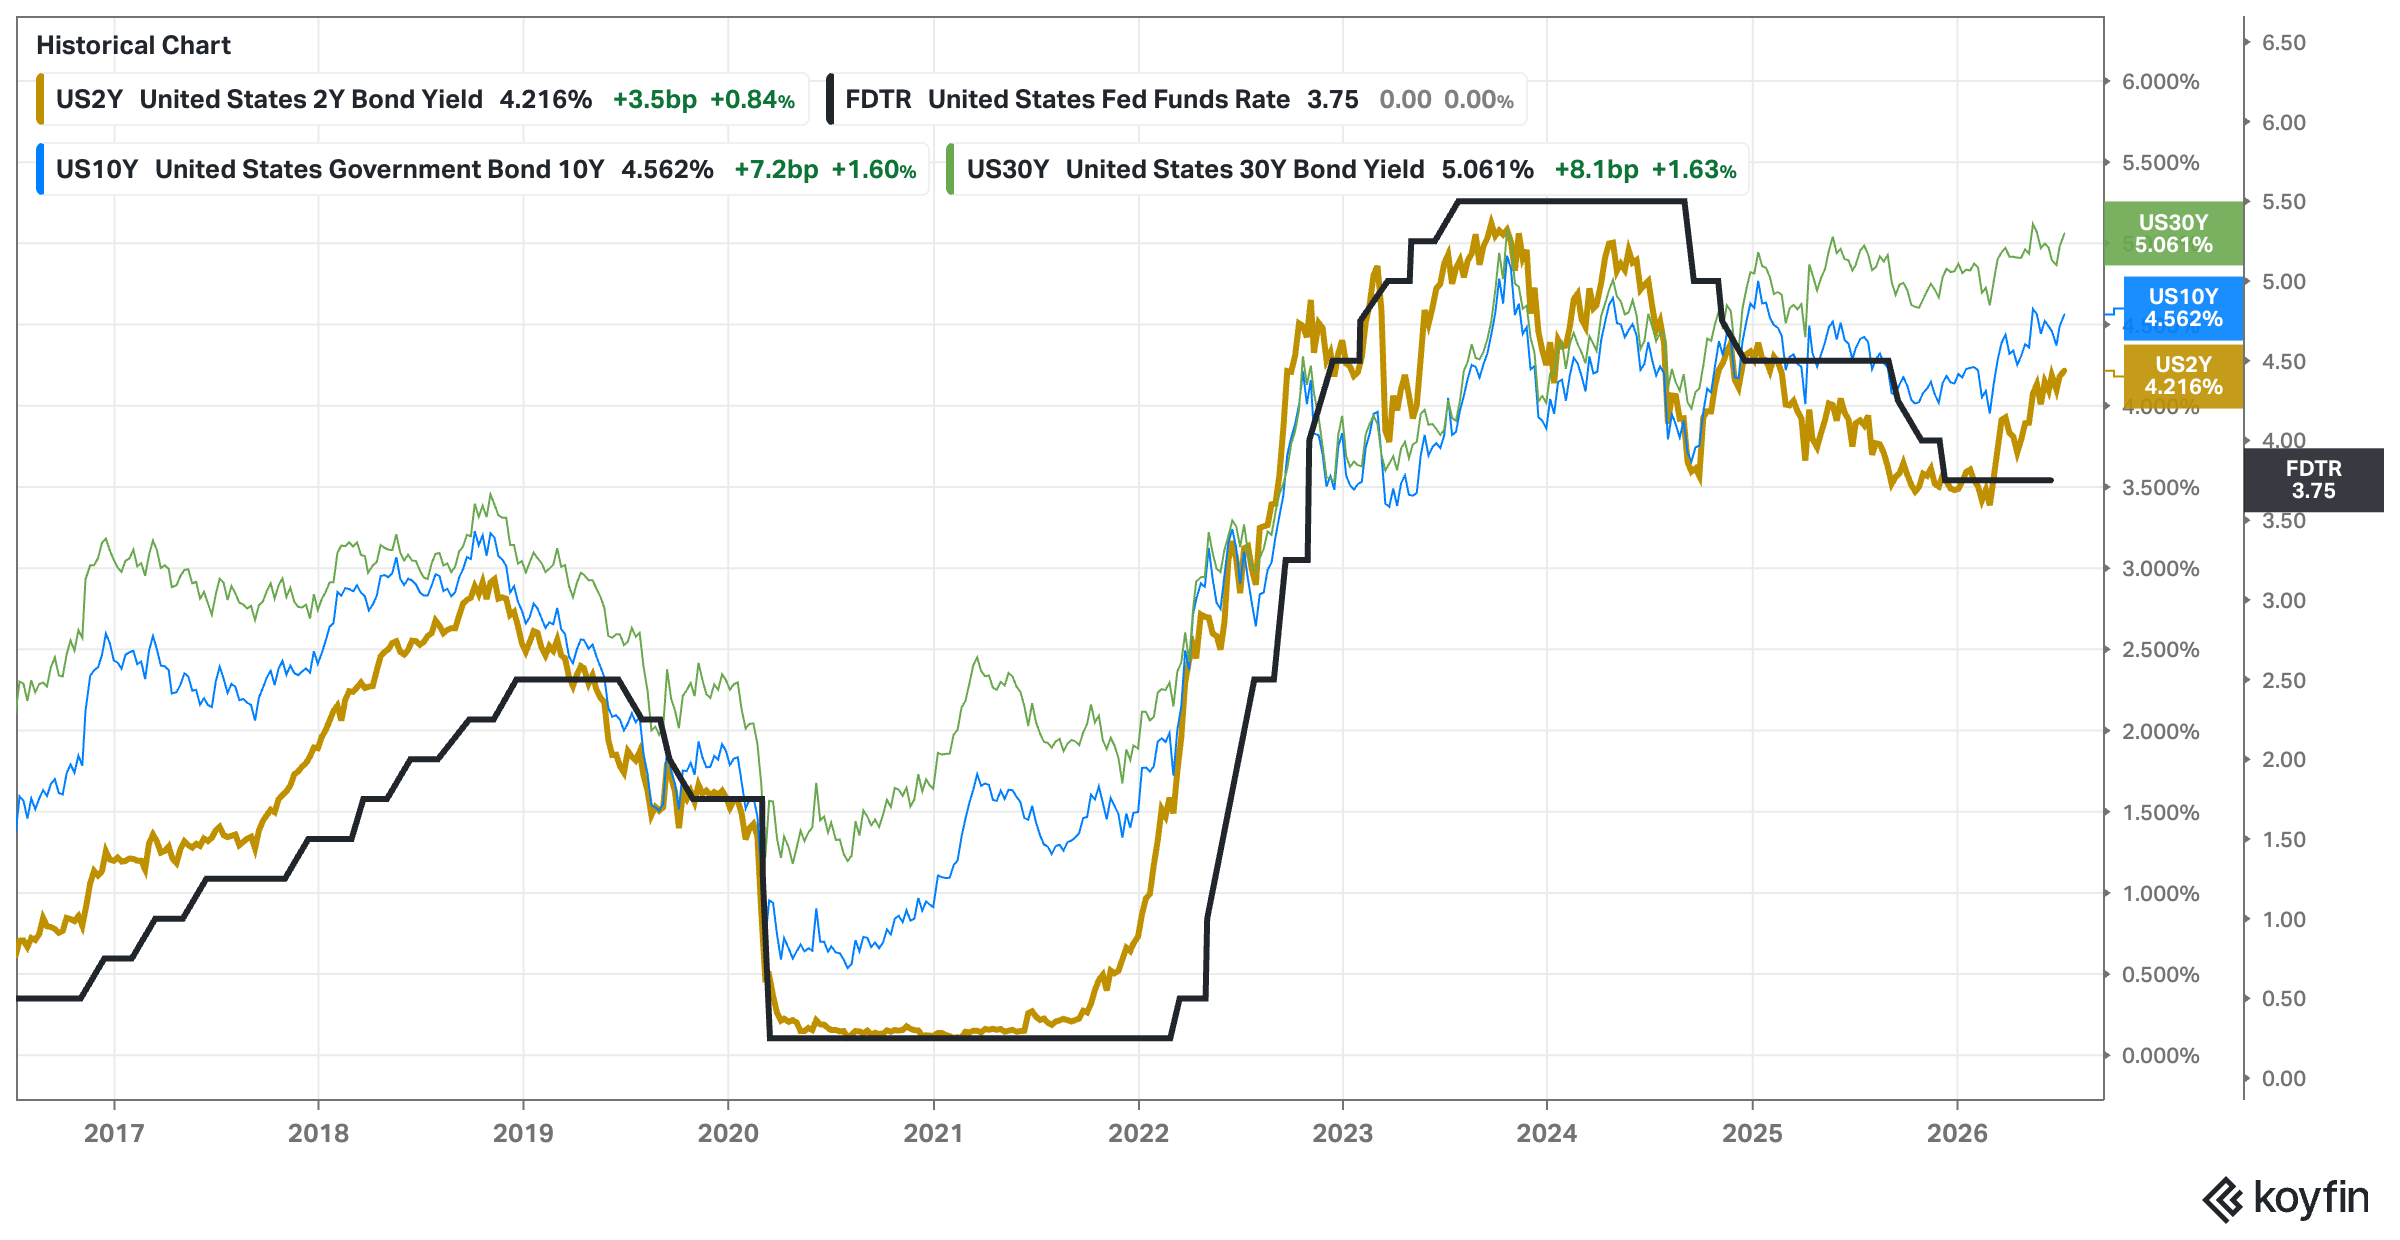
Analysis: Terms refuse to drop. The Fed may be forced to raise, which will certainly cool down the market. We prefer seeing those long and mid-term rates drop quickly.
Current Situation: Bearish
Future Outlook: Neutral
Context Investors Sentiment: Credit Spreads
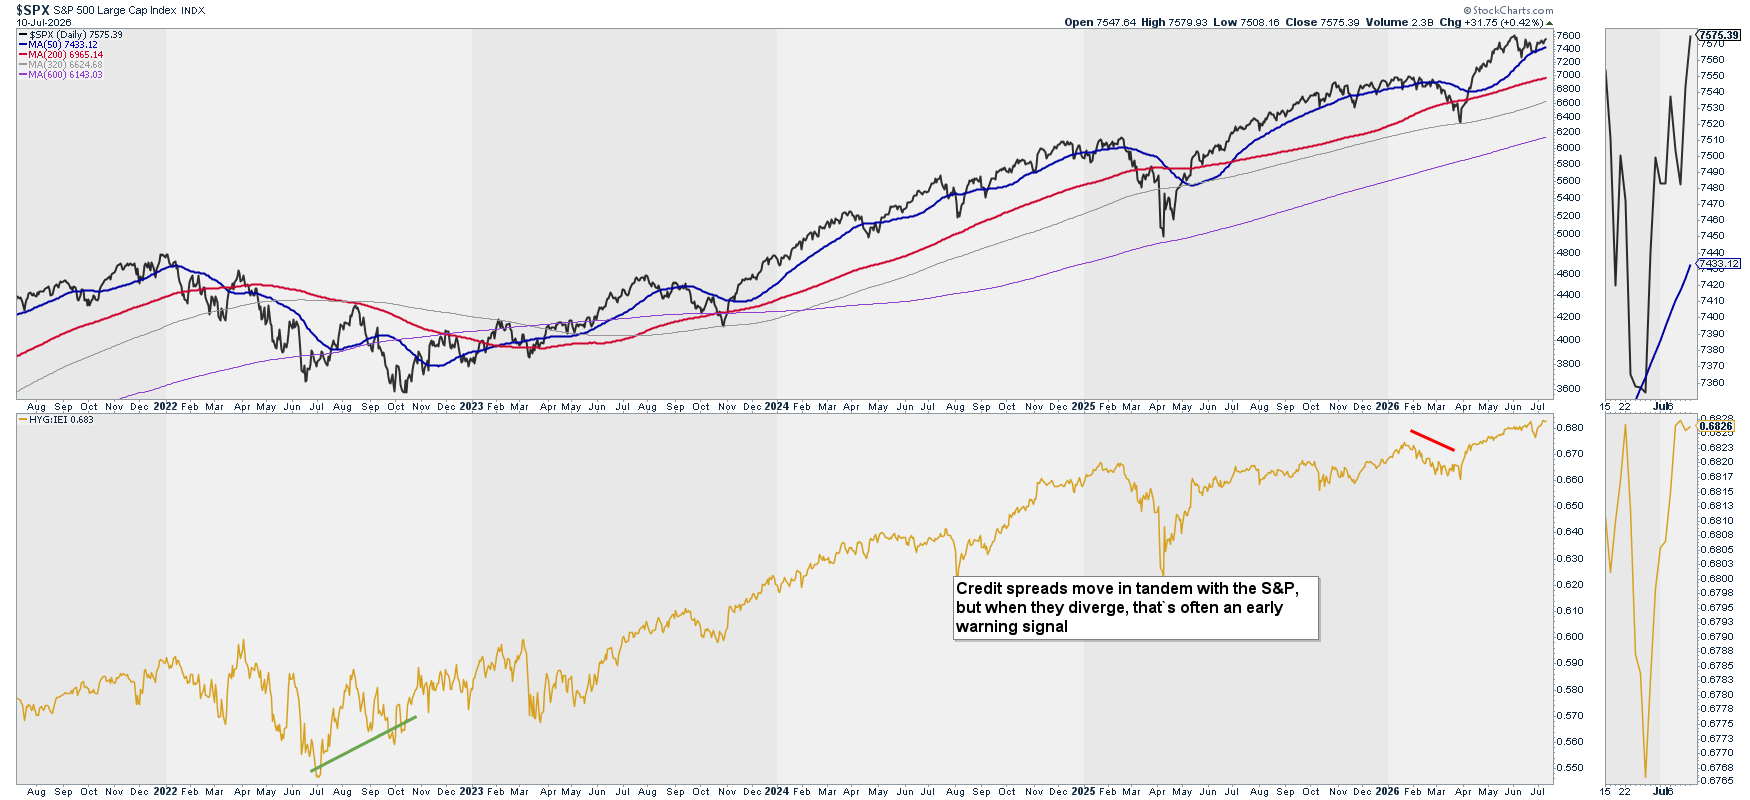
Note: Credit spreads move in tandem with the S&P, but when they diverge, that’s often an early warning signal.
Analysis: Spreads continue their uptrend after a bit of correction during June.
Current Situation: Bullish
Outlook: Bullish
Level 1: Why is it happening? Summary
Economic Data: Bullish/Bullish
Interest Rates: Bearish/Neutral
Investors Sentiment: Bullish/Bullish
Level 2: What is happening?
Price Action: SPX – Long Trend – 20 & 10 years
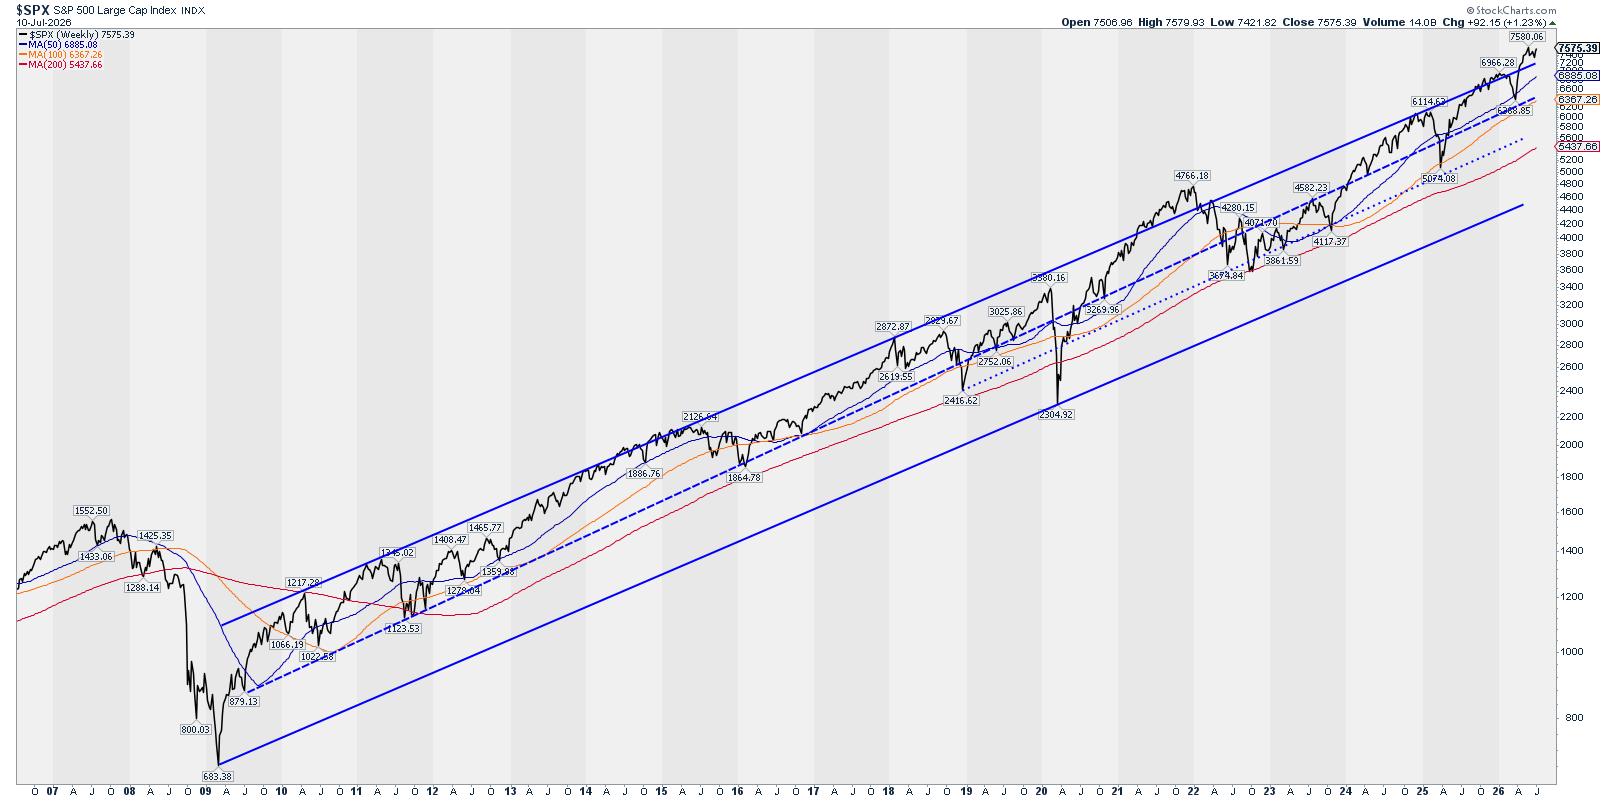
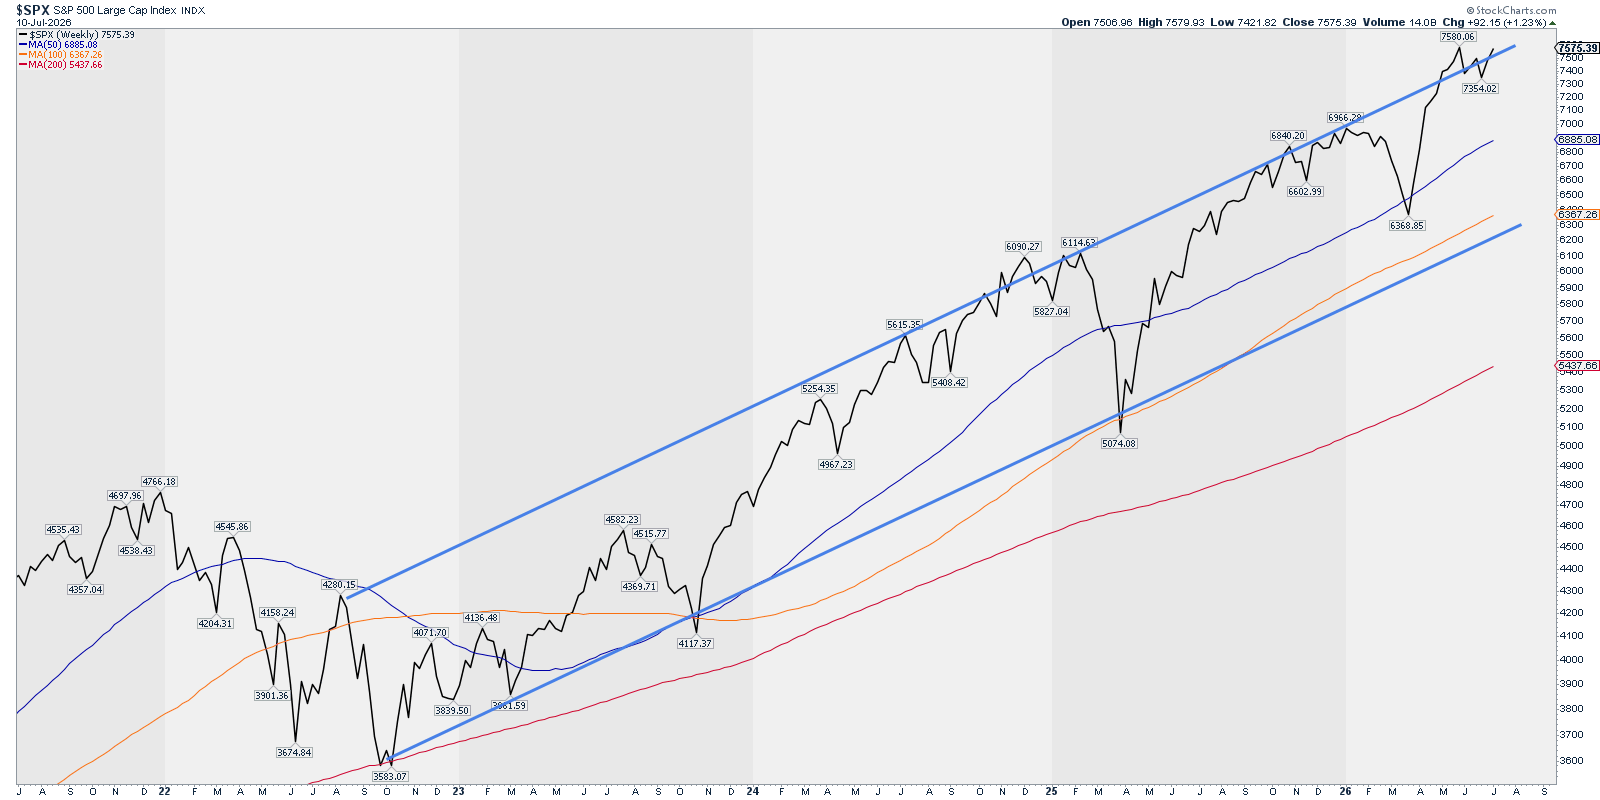
Analysis: Price continues the ascend above both 20Y and 10Y channels, which historically precedes a downturn at some point. Despite the current situation is bullish, our future outlook must remain bearish
Current Situation: Bullish
Future Outlook: Bearish
Price Action: RSP – Trend – Weekly & Daily
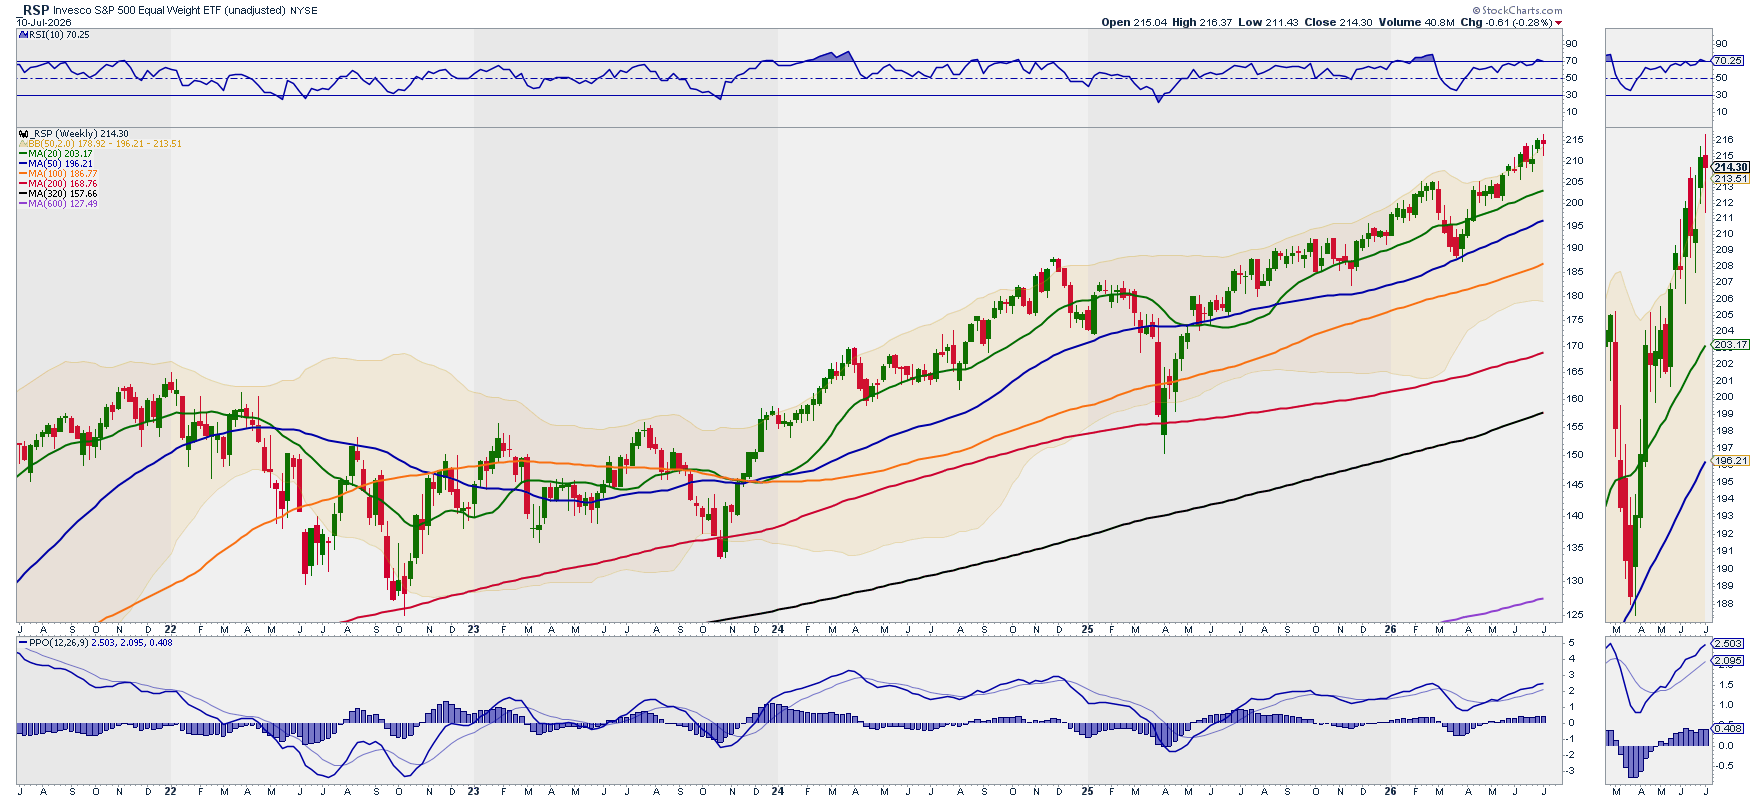
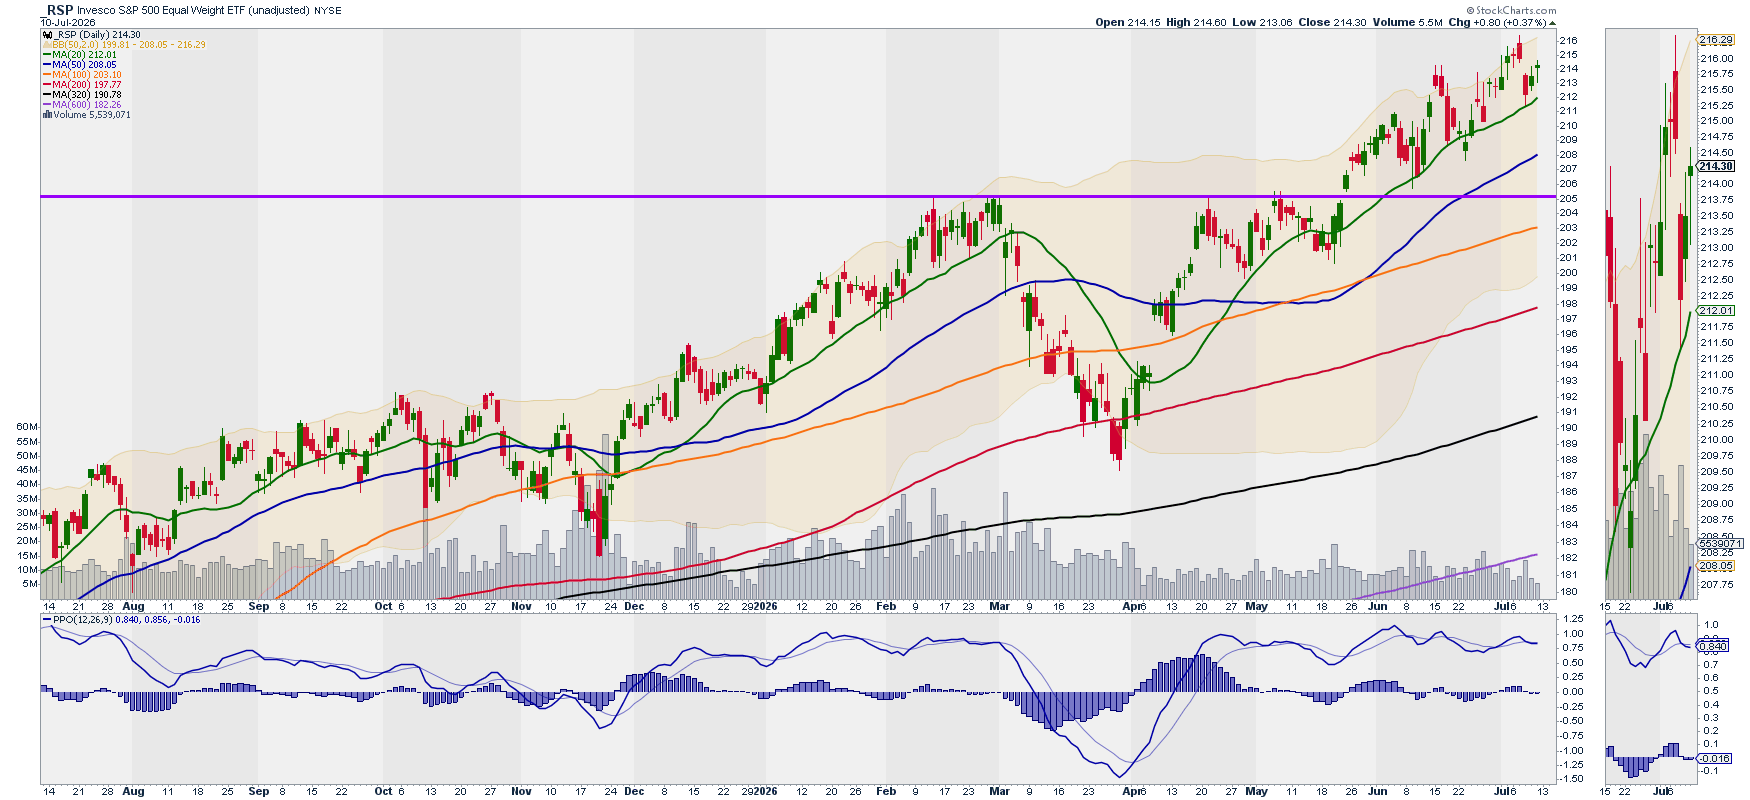
Analysis: Daily prices found support in the 20D SMA and the bullish trends continues. Indicators still show overbought conditions, so we keep our bullish current situation and bearish future outlook ratings.
Current Situation: Bullish
Future Outlook: Bearish
Breadth: RSP vs. SPY relative performance
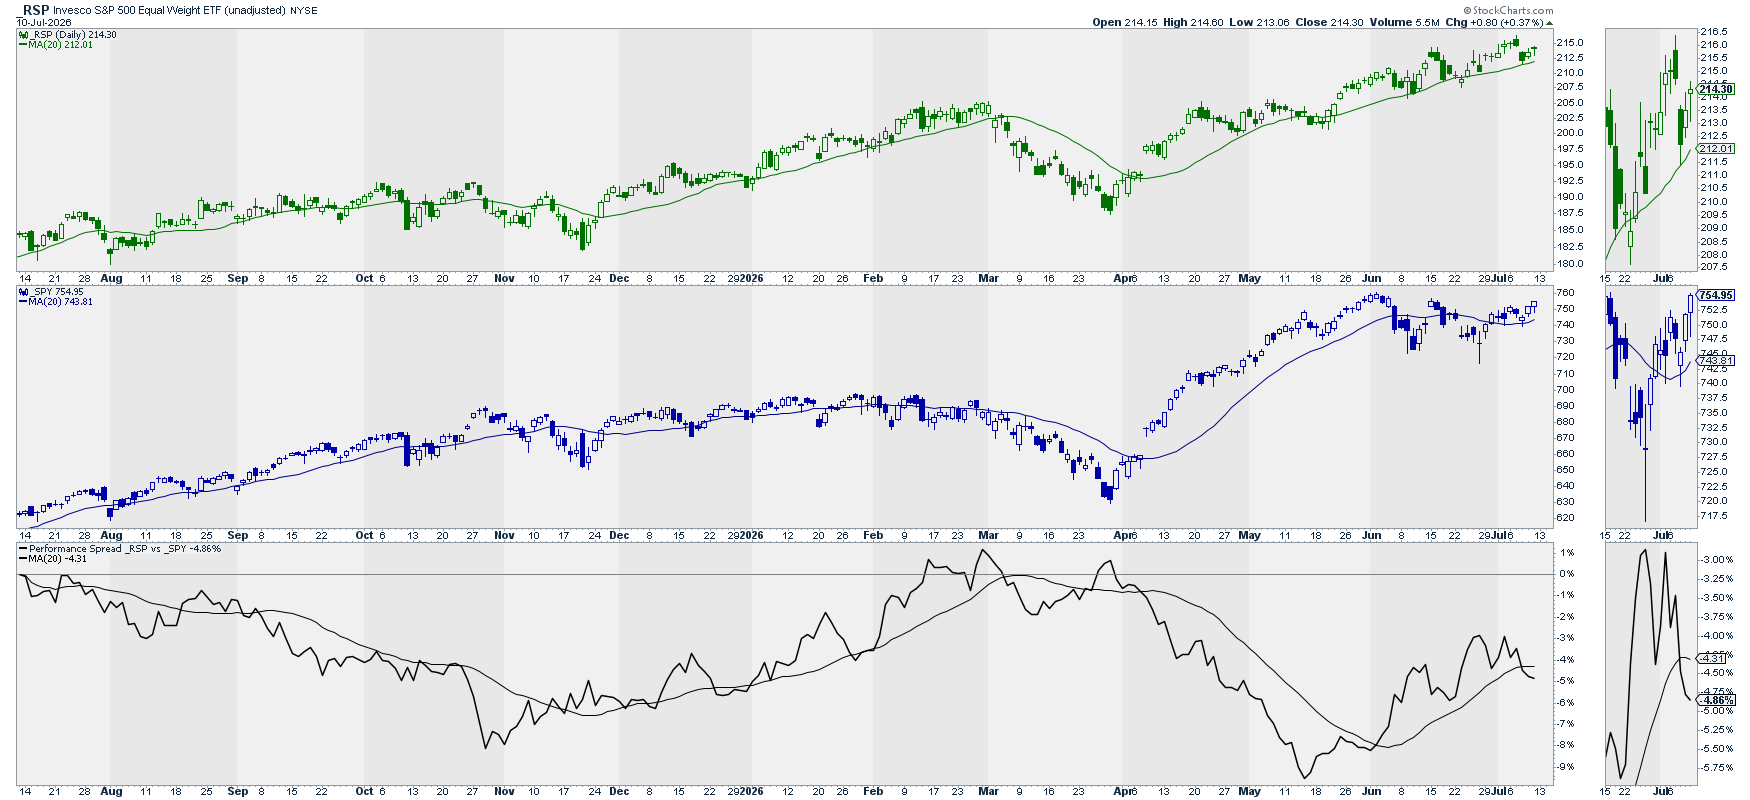
Analysis: Ratio (black) decreased and seemed have formed a local top. This could mean the return of breadth contraction with the big market cap stocks taking the lead again.
Current Situation: Expansion to Contraction
Future Outlook: Contraction
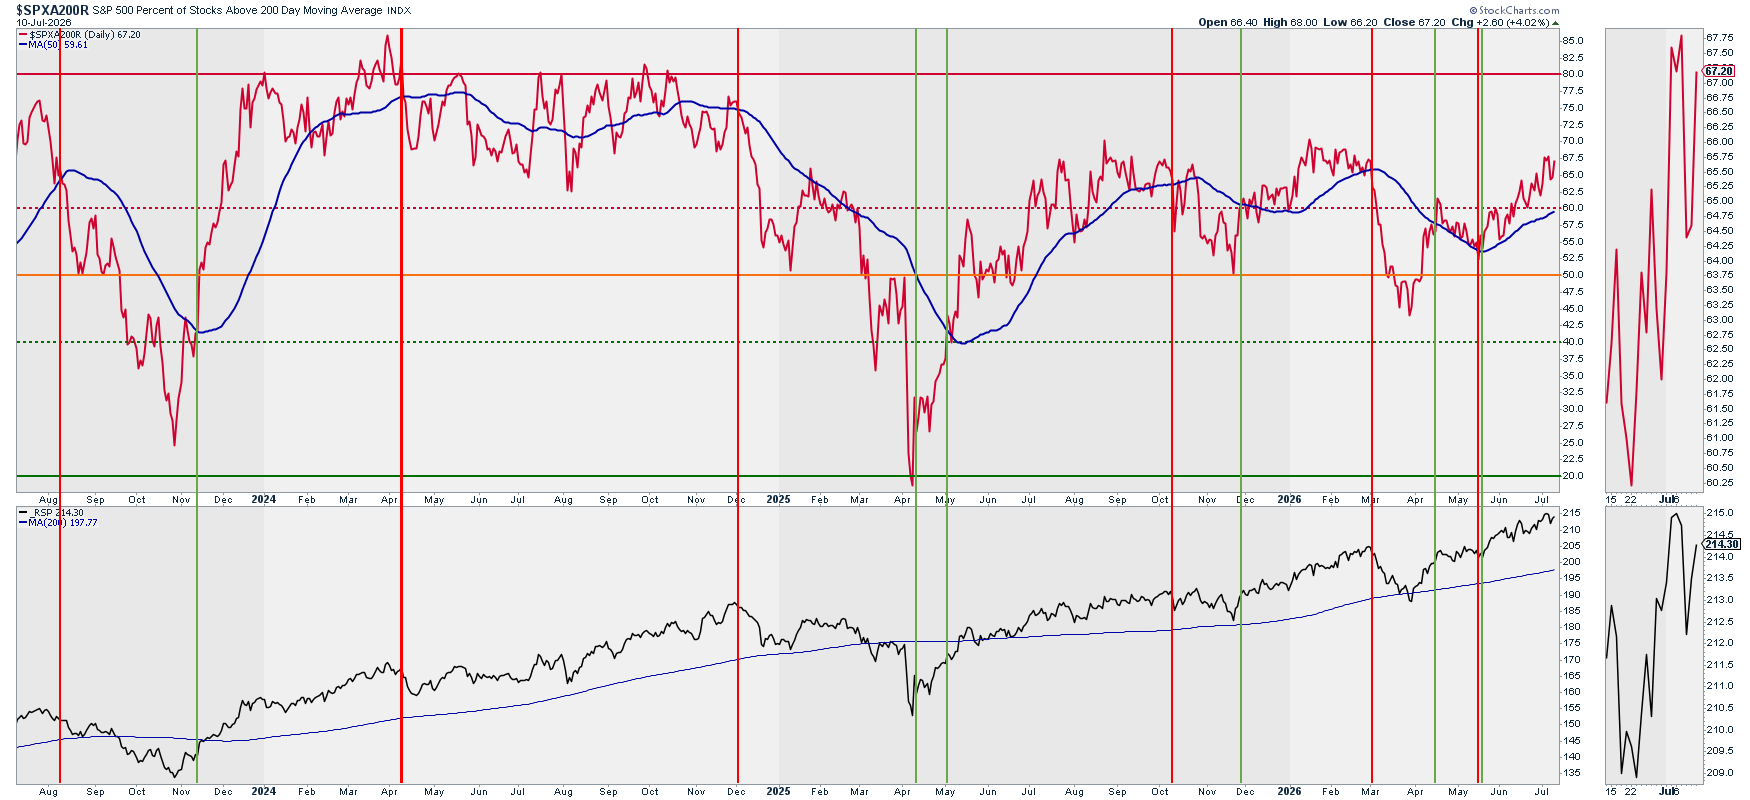
Breadth: % Stocks above SMAs vs. RSP
Above 200 Daily SMA
Above 20, 50, and 200 Daily SMAs
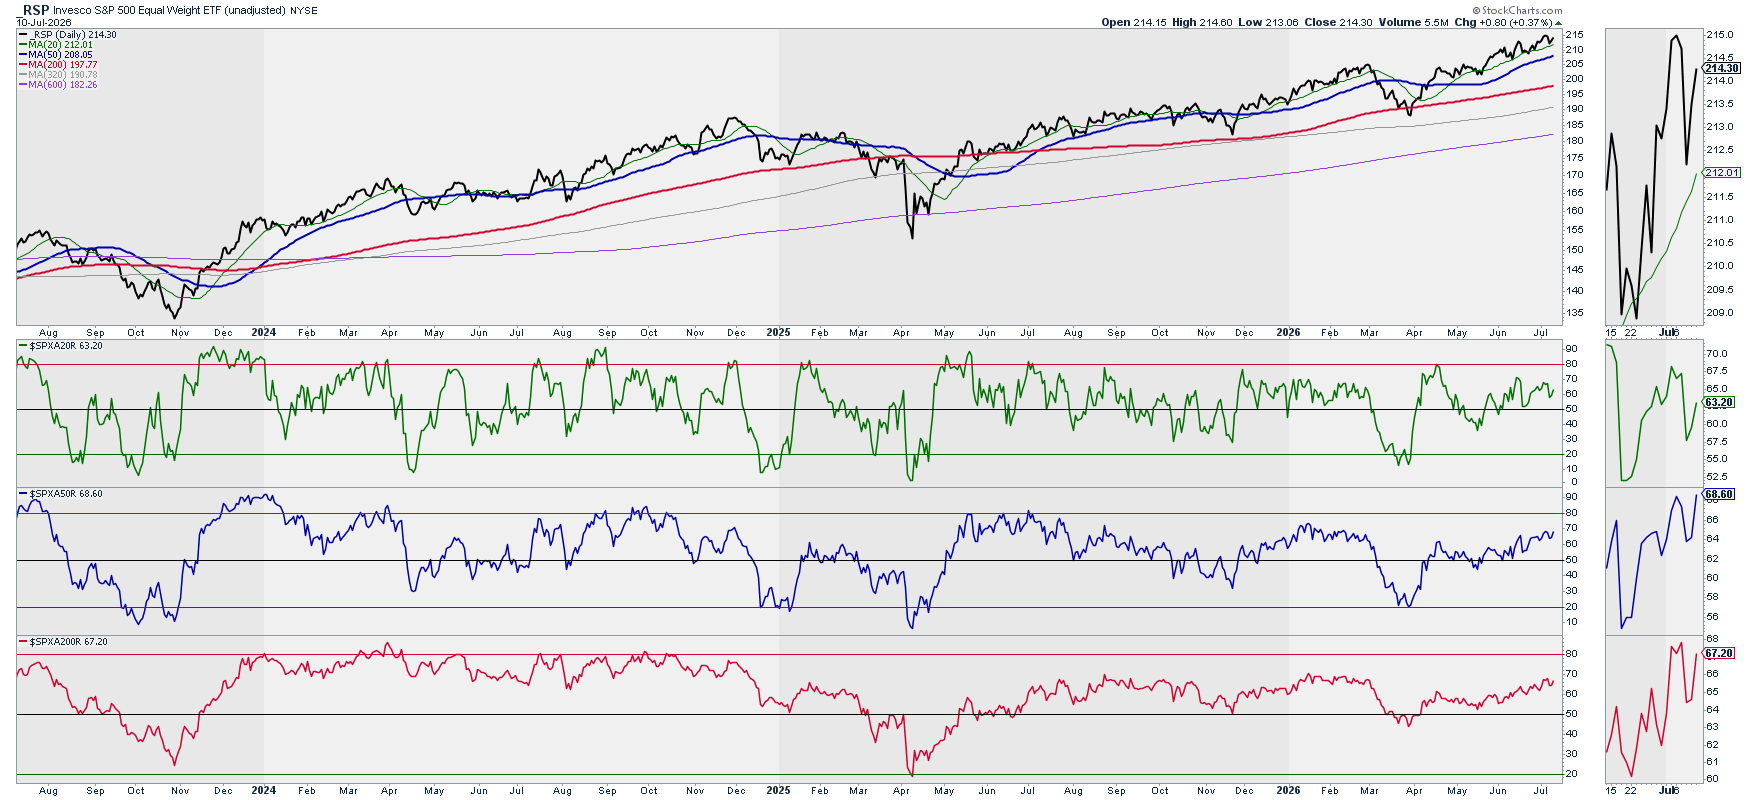
Analysis: Breadth is expanding and we have room to run. We remain on bullish territory.
Current Situation: Bullish
Future Outlook: Bullish
Breadth: New Highs vs. RSP & SPY
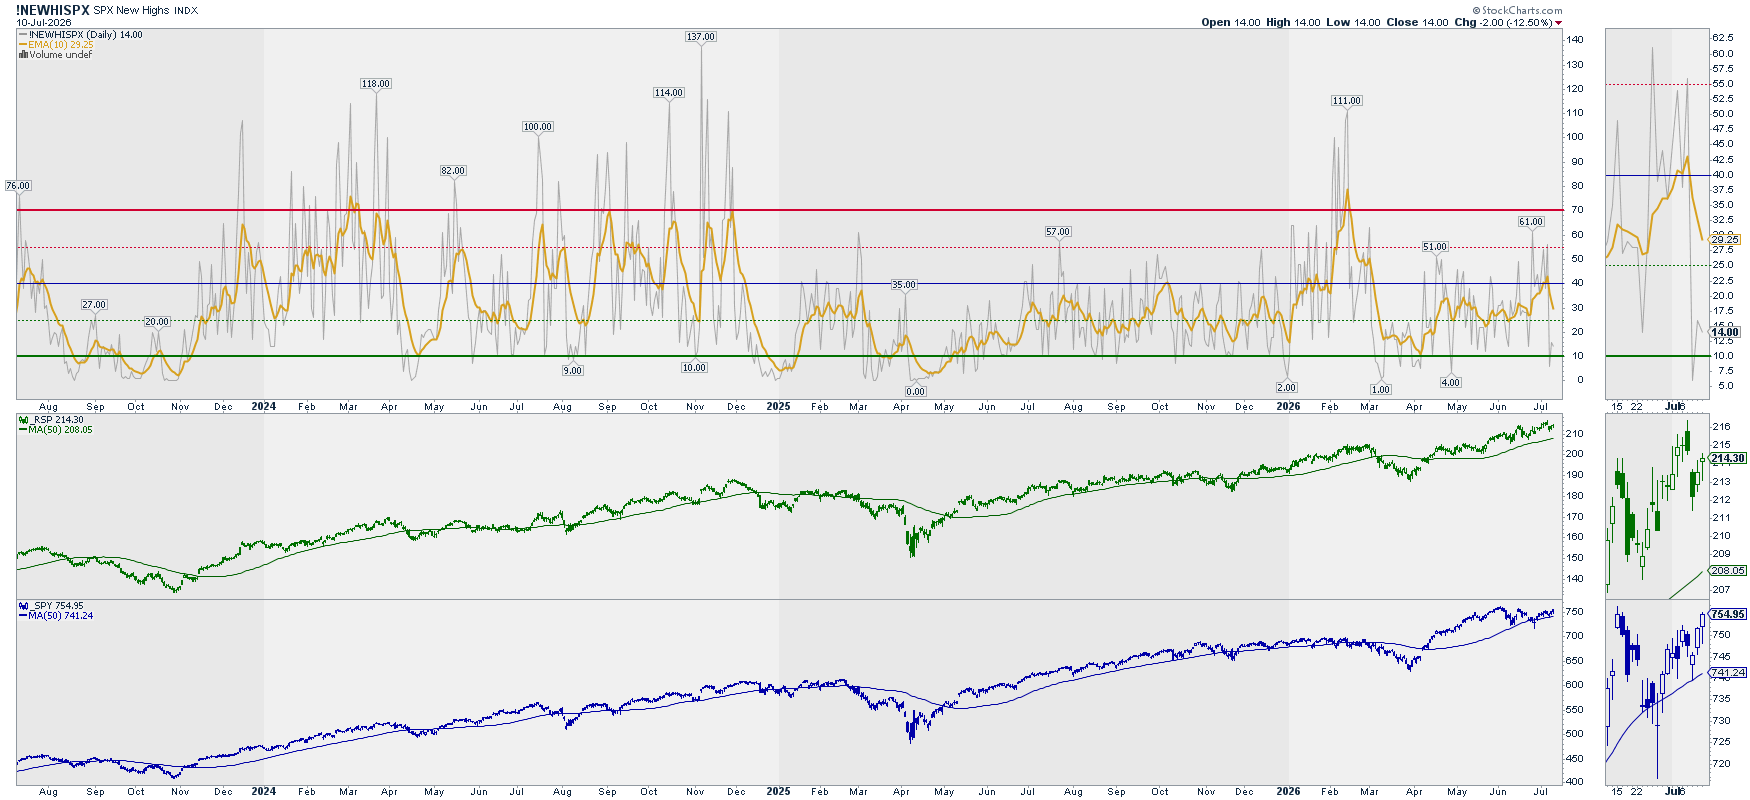
Analysis: Lower new highs yet far away from any extreme.
Current Situation: Bullish
Future Outlook: Bullish
Volatility: Ratio Low Vol. Stocks / SPY vs. RSP & SPY
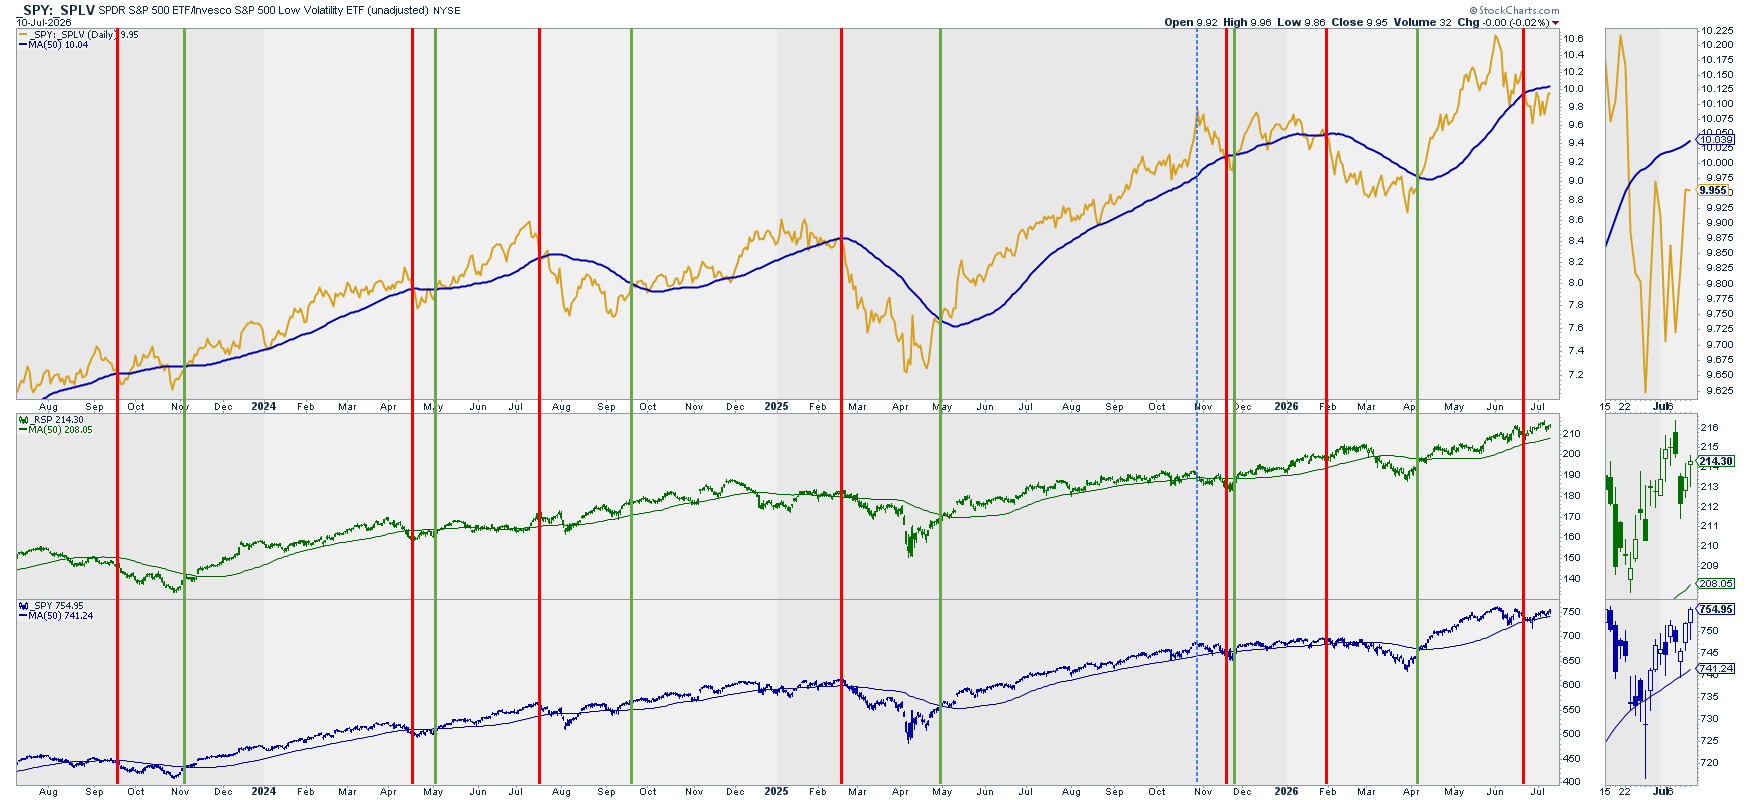
Analysis: This very reliable ratio seems bound to reverse the bearish signal into a bullish one.
Current Situation: Bearish
Future Outlook: Bearish-to-Bullish
Volatility: VIX vs. RSP & SPY
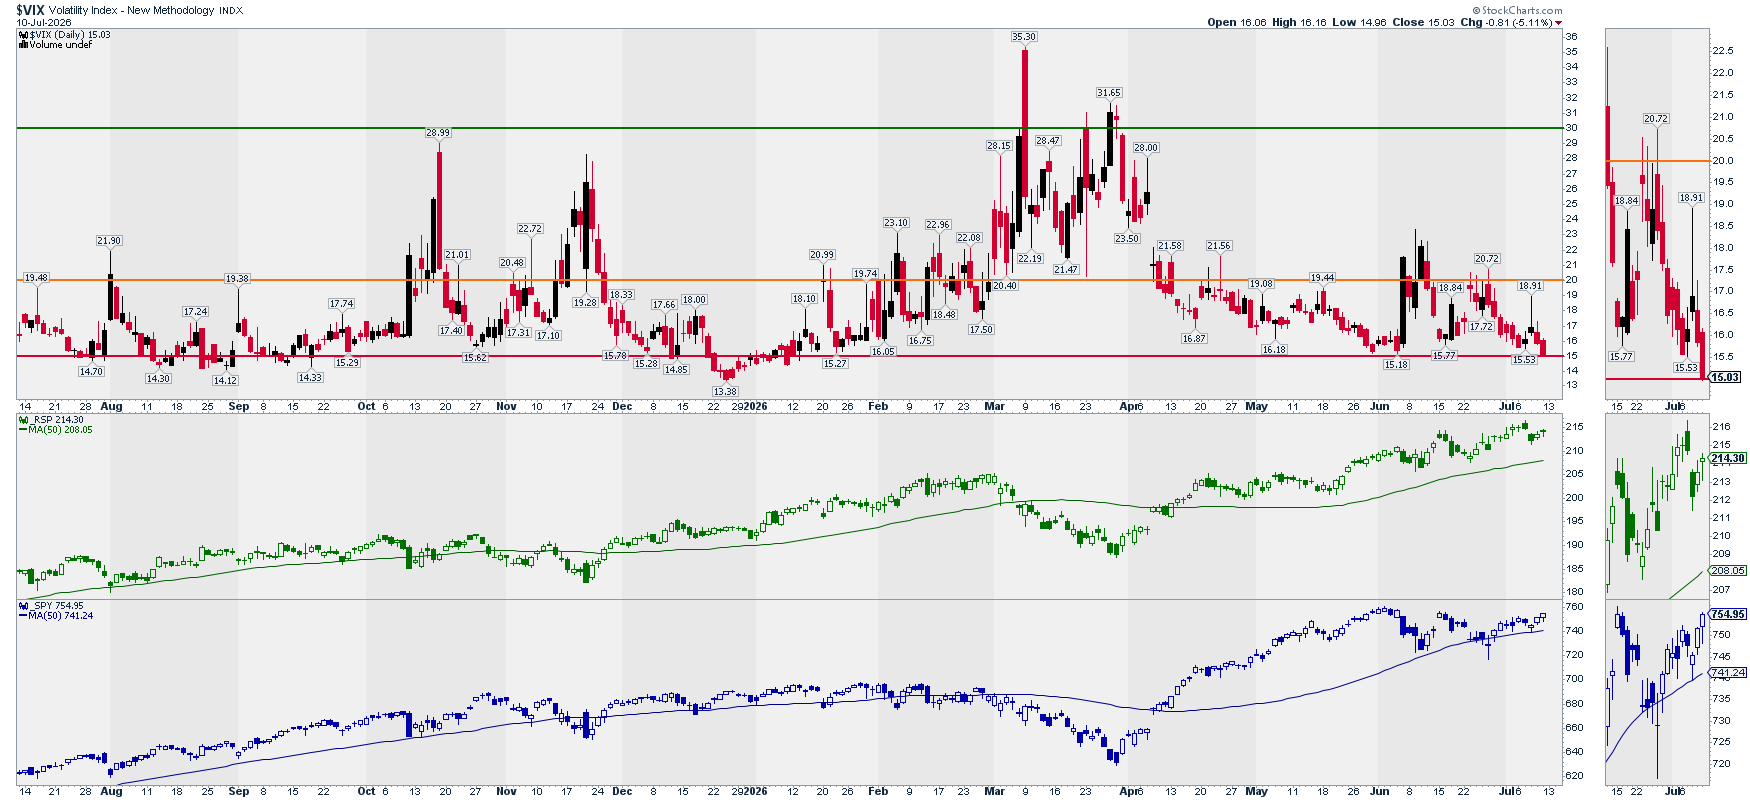
Note: This chart is mainly to detect market bottoms.
Analysis: VIX entering the bullish 15 level area.
Current Situation: Bullish
Future Outlook: Neutral
Options: (Inverted) Put/Call Ratio vs. SPY
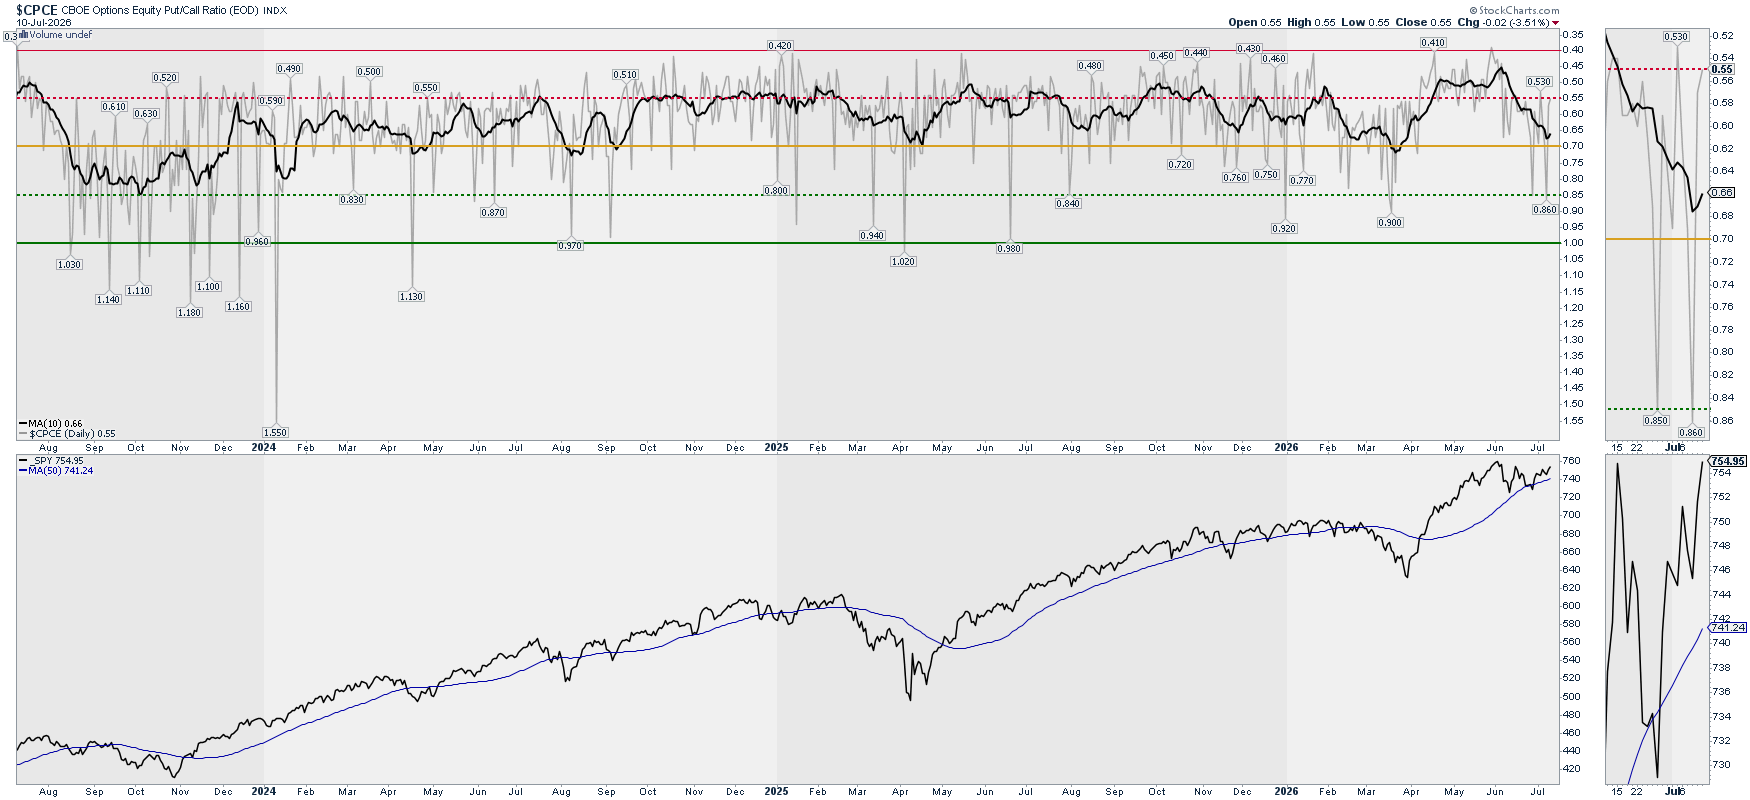
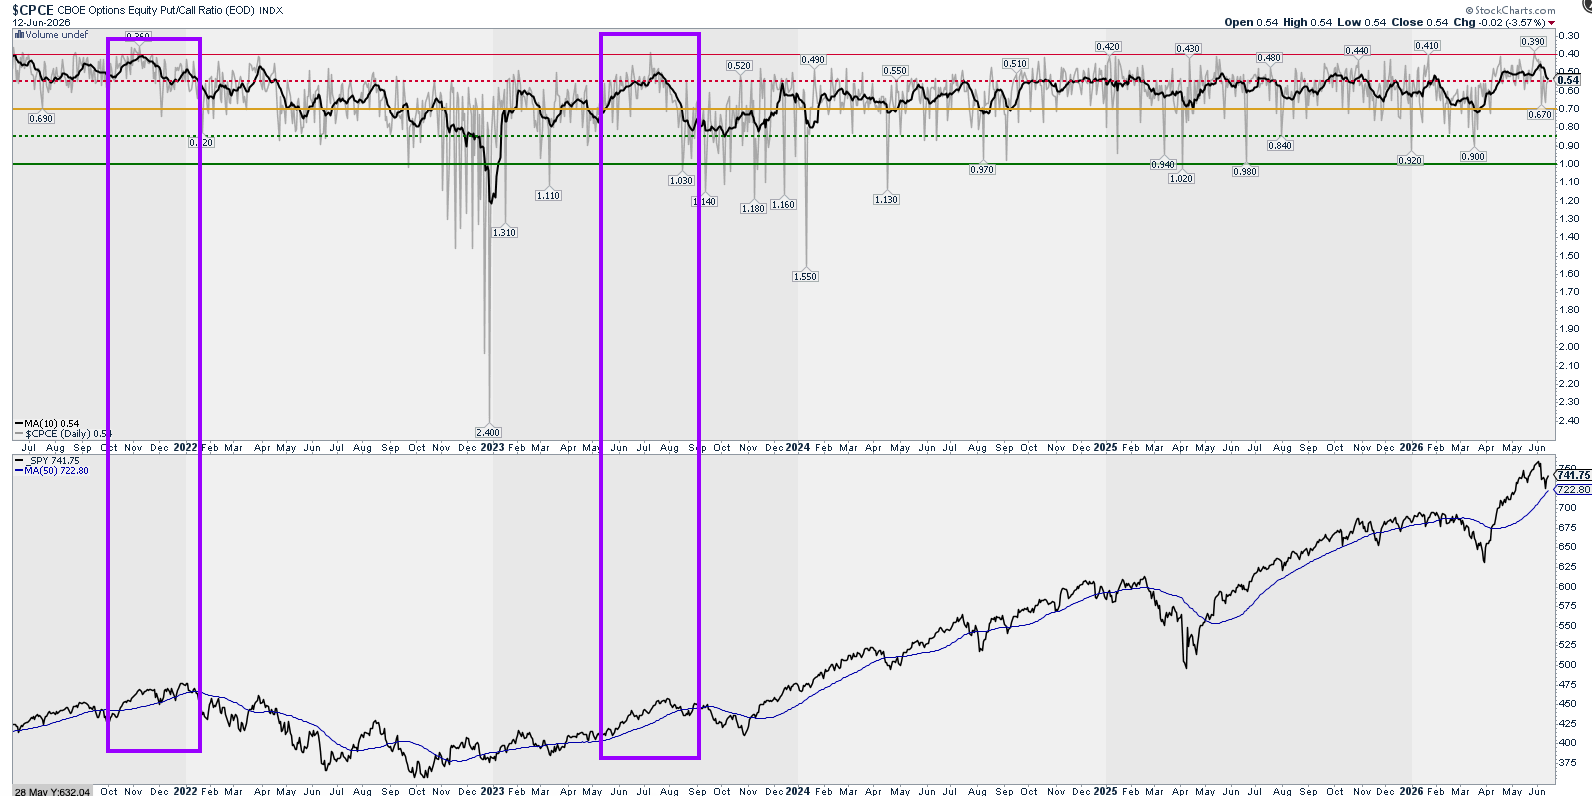
Analysis: Low spot reading (gray) which will push lower the signal (black) line, and the market with it.
Current Situation: Bearish
Future Outlook: Bearish
Options: Gamma Exposure – SPY
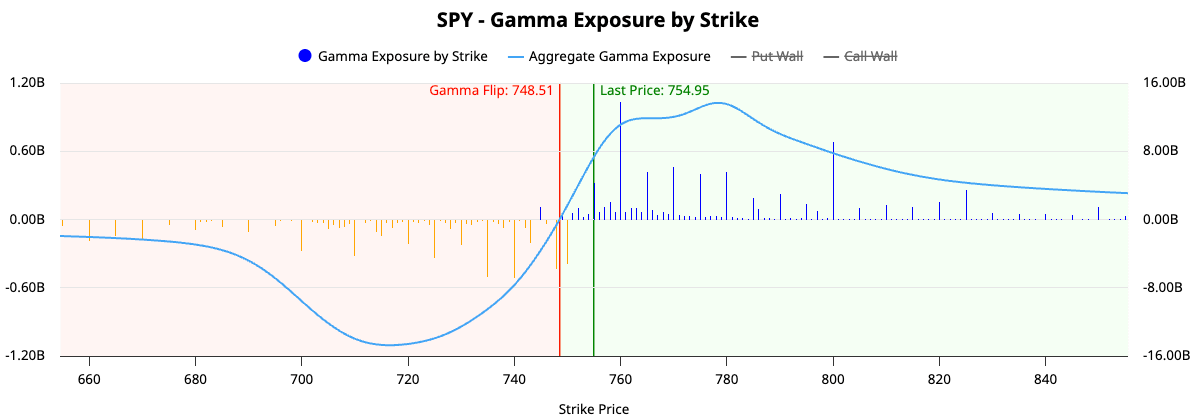
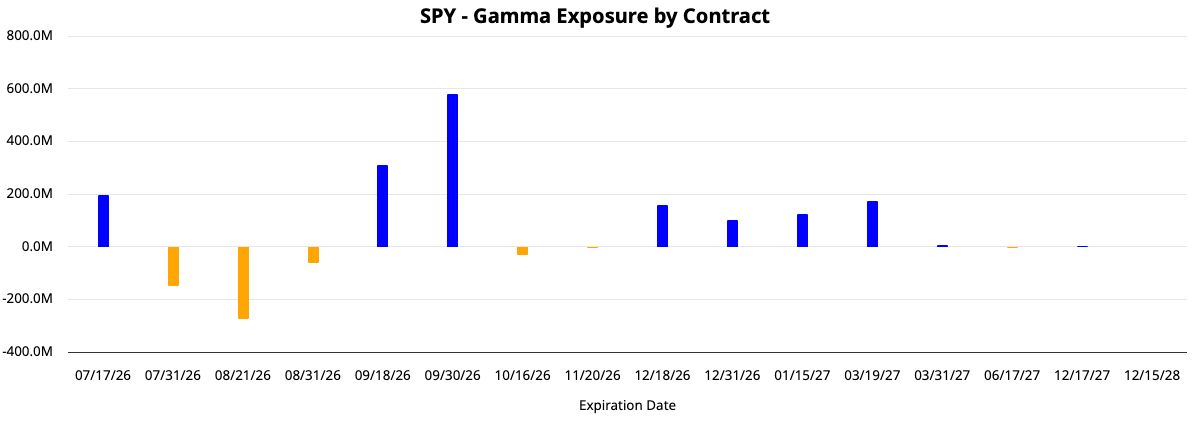
Analysis: GEX has flipped from negative to positive for 17th of July with the negative GEX moving to mid-August. Surprises late-September high positive readings.
Current Situation: Bullish
Future Outlook: Bullish (looking at September)
Level 2: What is happening? Summary
Price Action: Bearish/Bearish
Breadth: Bullish/Bullish
Volatility: Bullish/Bearish
Options: Neutral/Neutral
Level 3: Where is it happening?
Bulls vs. Bears: RSP vs. RSPD (Cons. Disc. – Bulls) and RSPS (Cons. Sta. – Bears)
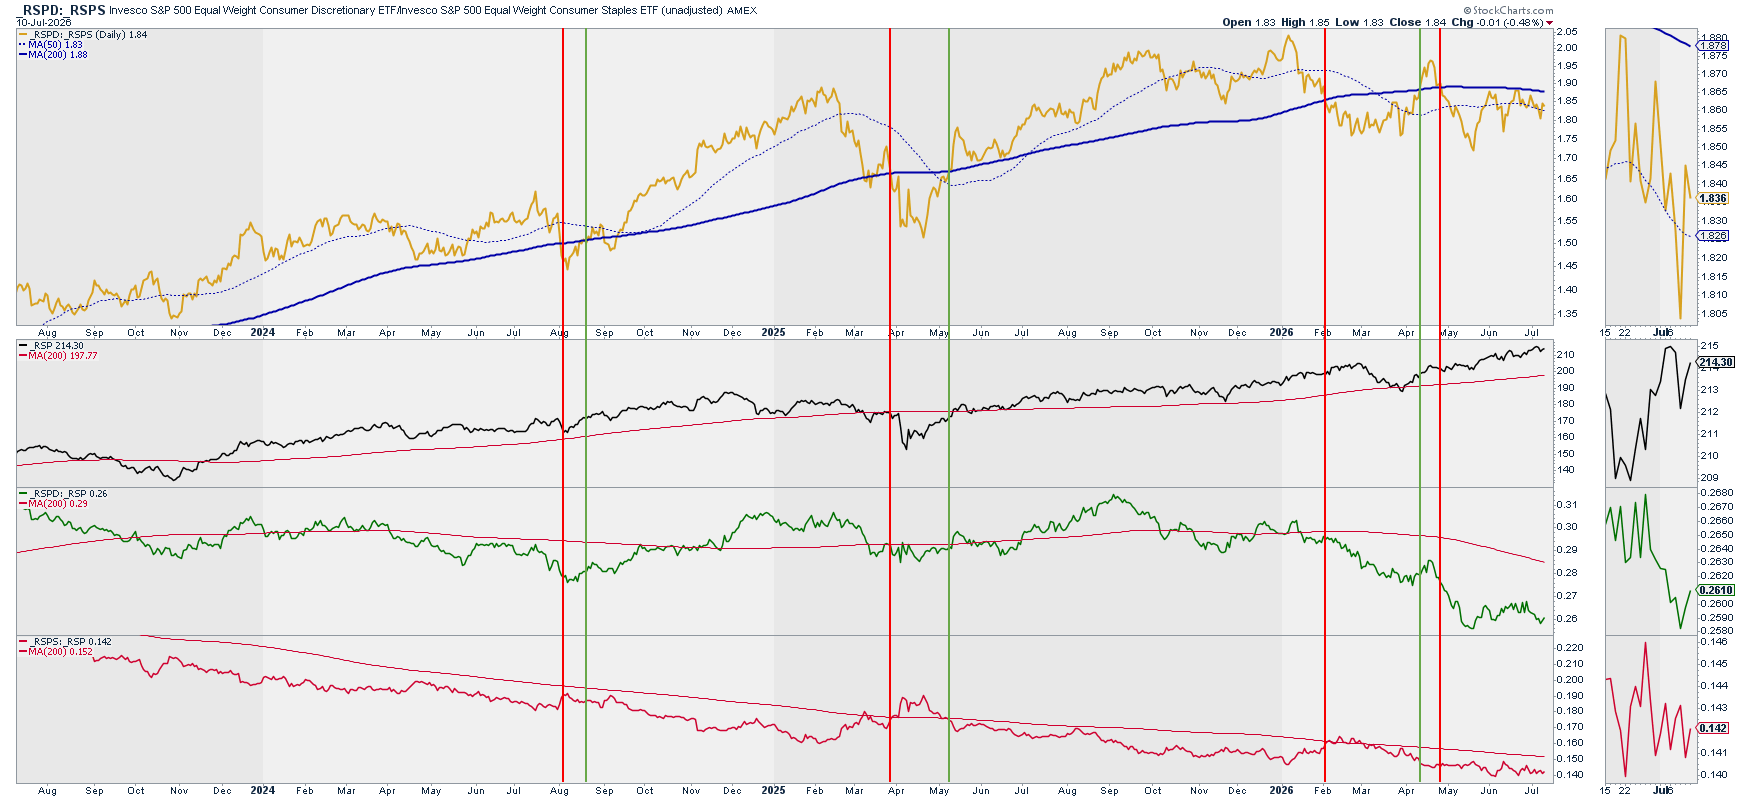
Analysis: Ratio (yellow) failed to break above the 200D SMA and also broke below the 50D SMA.
Current Situation: Bearish
Future Outlook: Bearish
Sectors Rotation
Sectors Performance
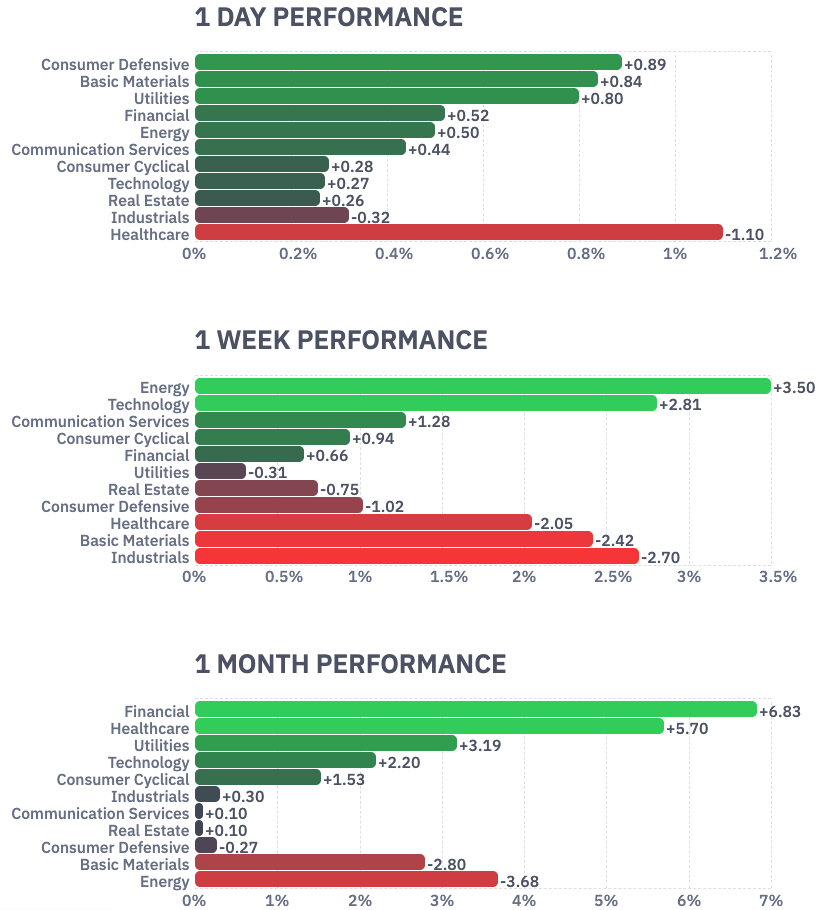
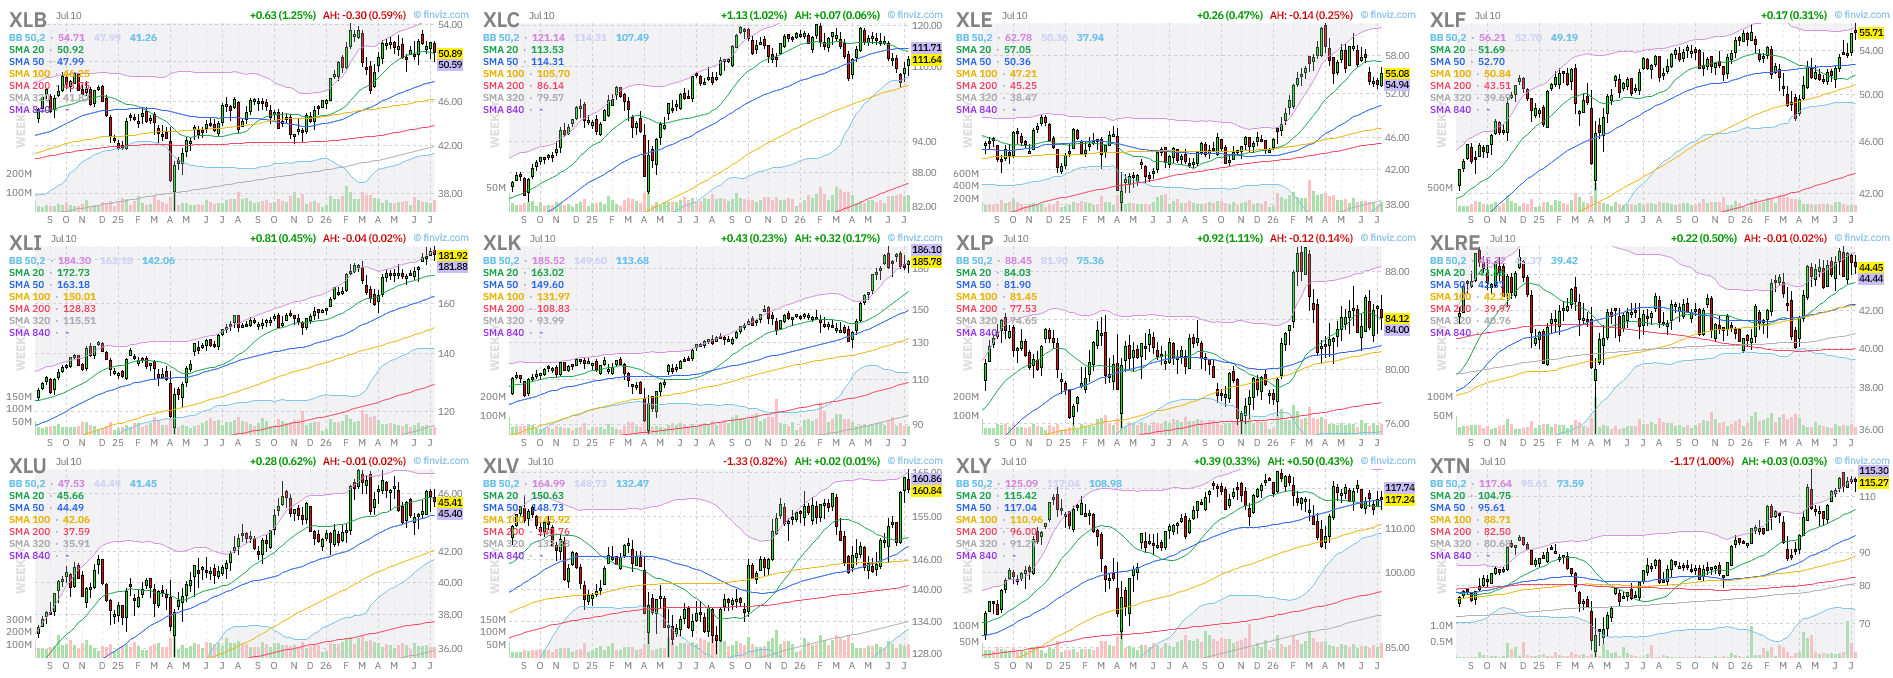
Forget XLE where everything is about Iran’s war. The true star is XLI. If only we could see XLF breaking to new highs, that could be the final confirmation of a healthy market diversification and bull market.
Transportation (XTN) is breaking to ATH. Old time technicians used this sector to tell the overall health of the economy. Is still a good indicator in the digital era? We’ll see…
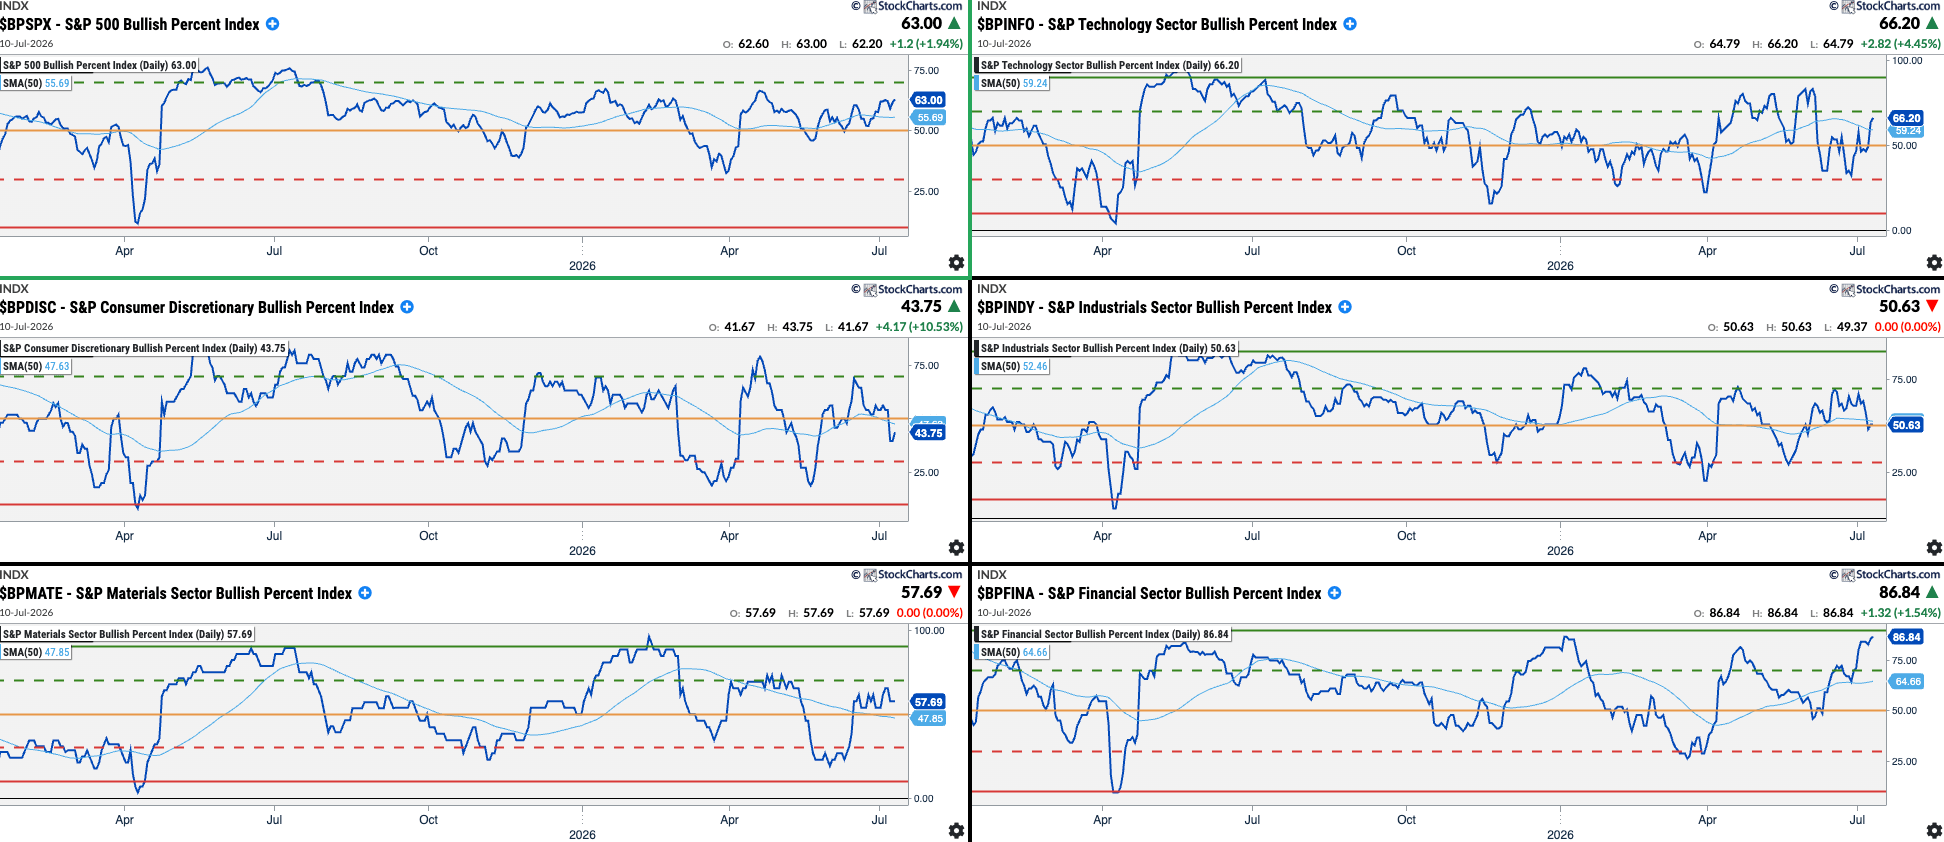
Sectors Bullish Percent Index
Growth Sectors
Value Sectors
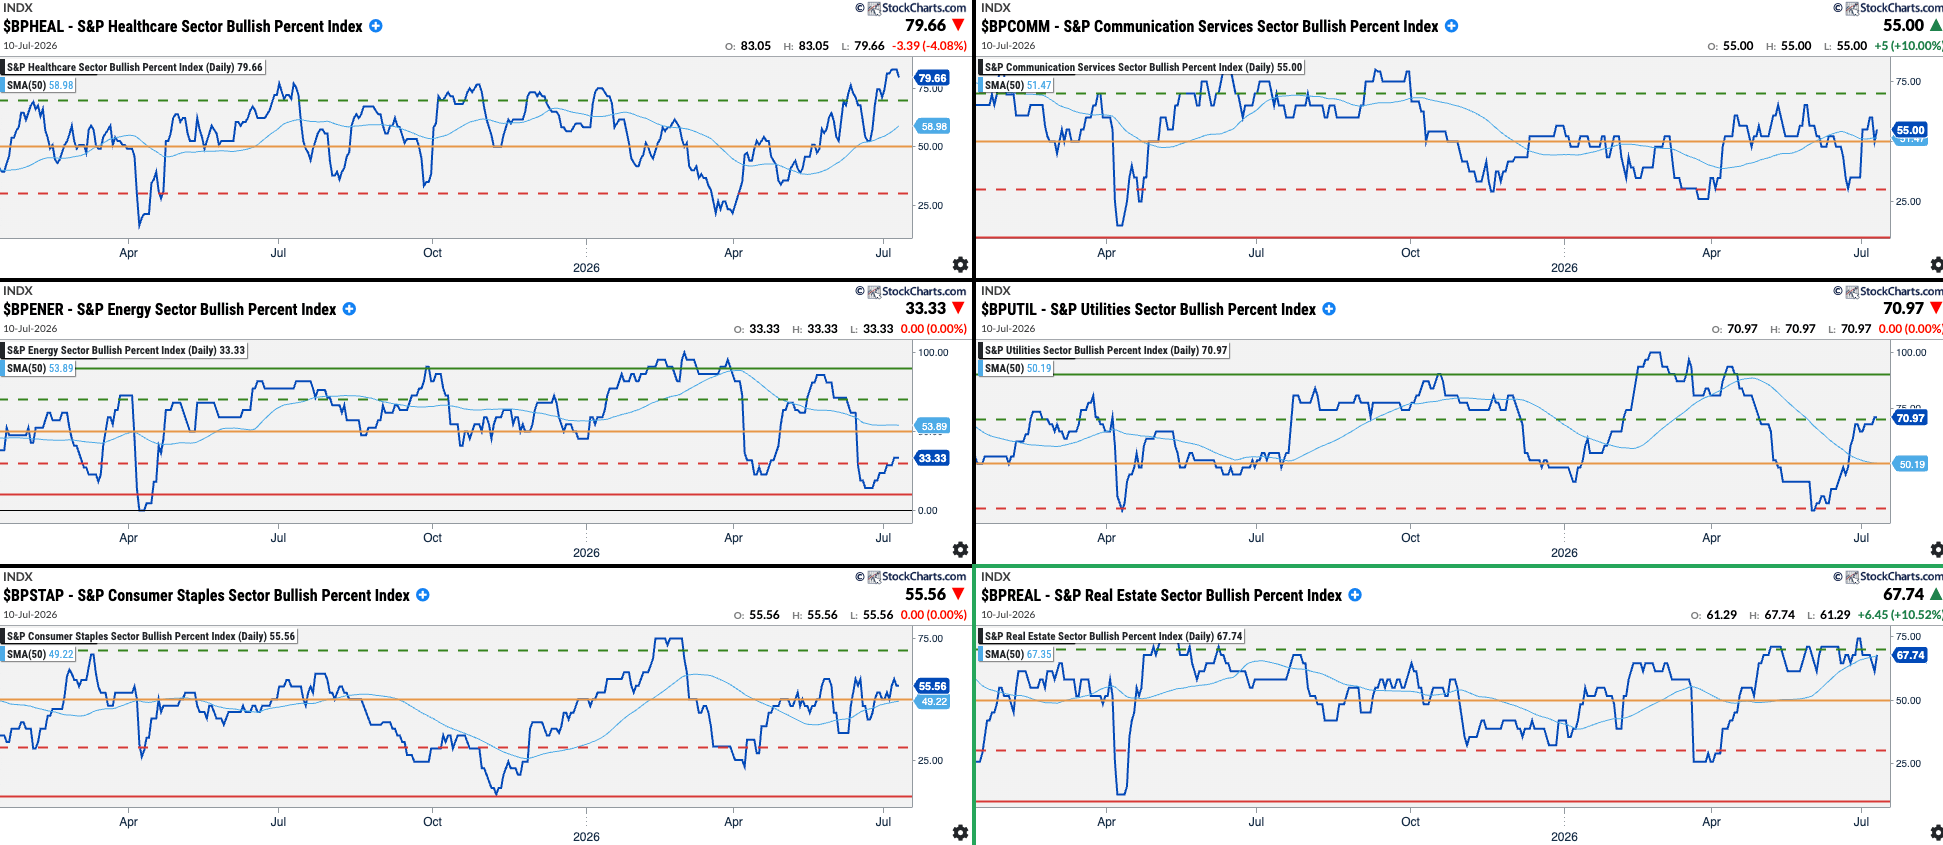
Note: Any sectors below their red levels are good opportunities to find great companies at good valuations or buy sector ETFs (buy cheap). Those sectors above their Green levels are candidates to be sold (sell expensive).
Current Situation: Bullish - & - Future Outlook: Bullish:
Industrials, Materials, Financials, Utilities, Technology
Current Situation: Bullish - & - Future Outlook: Bearish:
Healthcare, C. Disc., Real Estate
Current Situation: Bearish - & - Future Outlook: Bullish:
C.Staples, Energy
Current Situation: Bearish - & - Future Outlook: Bearish:
Communications
SPX has a Bullish Current Situation and a Bullish Future Outlook.
Note: XLK moved to have both bullish current conditions and future outlook.
Level 3: Where is it happening? Summary
Bulls vs. Bears: Bearish
All Levels Summary and Final Thoughts
Level 1 Summary - The Why
Economic Data: Bullish/Bullish
Interest Rates: Bearish/Neutral
Investors Sentiment: Bullish/Bullish
Level 2 Summary - The What
Price Action: Bearish/Bearish
Breadth: Bullish/Bullish
Volatility: Bullish/Bearish
Options: Neutral/Neutral
Level 3 Summary - The Where
Bulls vs. Bears: Bearish
Level 4: Scanning for opportunities
Great Companies with Great Technicals
Descriptive
Index: Any | Market Cap.: +Mid (+$2B) | Option/Short: Yes/Yes
Avg. Volume: >1M | Relative Vol.: Over 1 | Price: >$10
Fundamental
EPS Growth Next Year: >15% | EPS Growth Past 3 Years: >5% | Sales Growth Past 3 Years: >5%
- Sorted by P/E
Technical
Performance: Quarter Up | Price above 20D SMA & 50D SMA | Beta: >1 | ATR: > 1
None!
S&P500 and Nasdaq New Highs
Descriptive
Index: S&P 500 and Nasdaq | Market Cap.: +Mid (+$2B) | Option/Short: Yes/Yes
Avg. Volume: >1M | Price: >$10
(order by Market Cap desc.)
Technical
50-Day New High

Chart of the week:
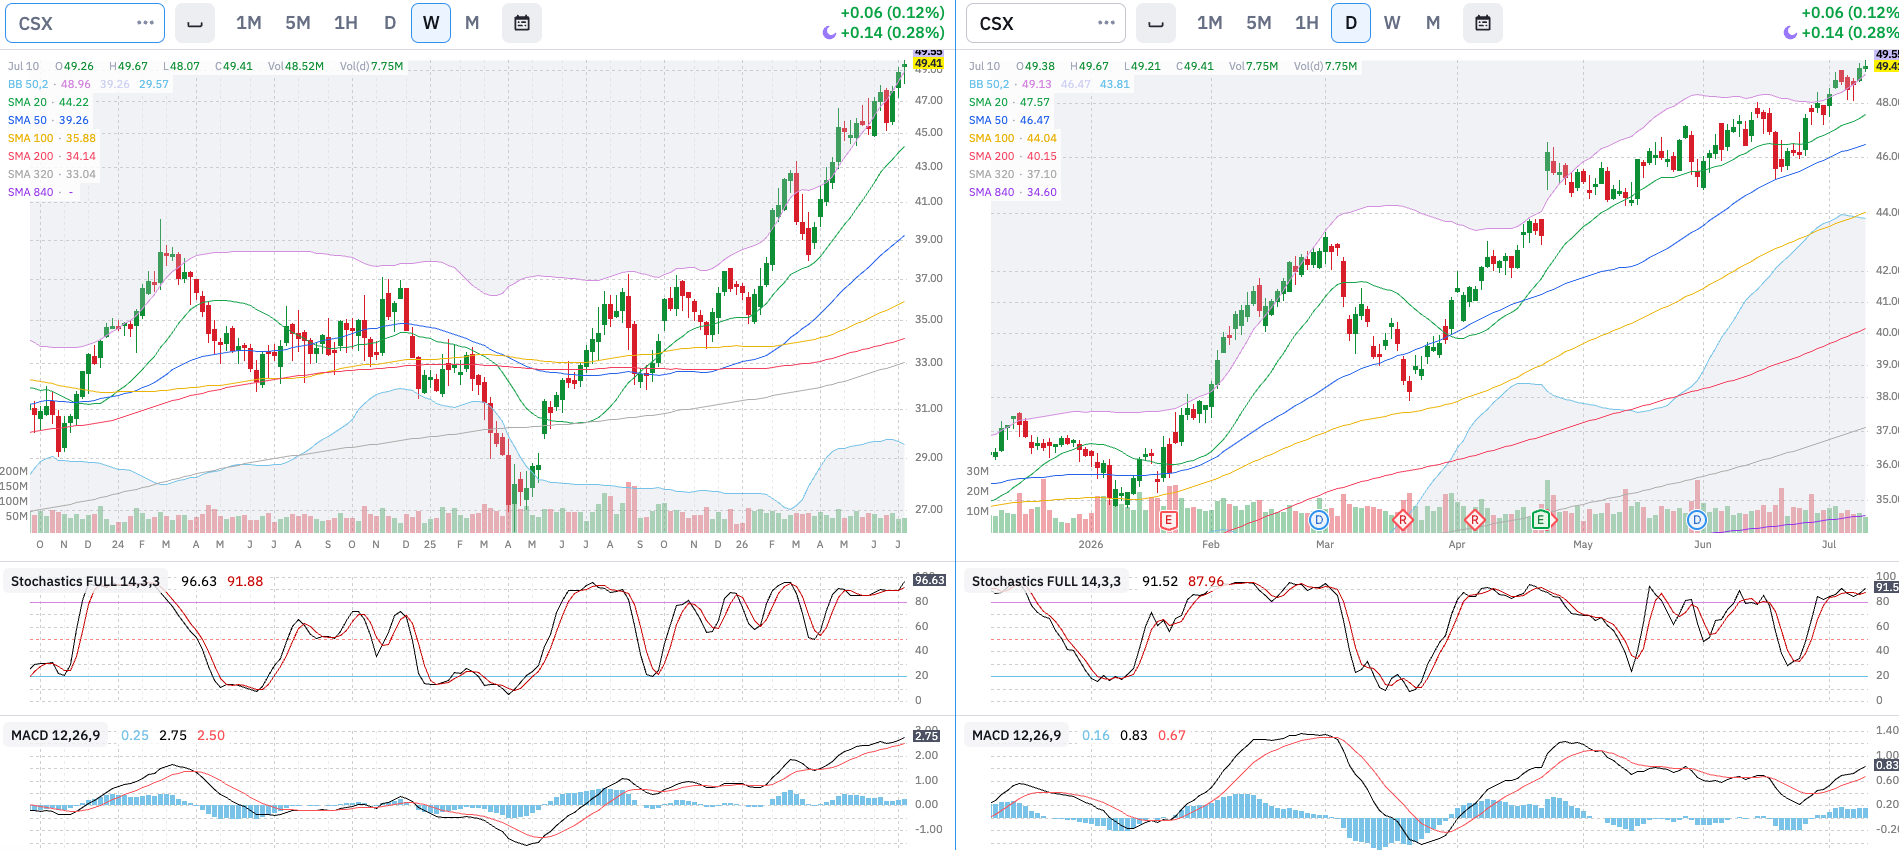
Railroads! You hear it here first. All that construction and industry production has to move somehow.
Disclaimer: The content on AMAT Investing is strictly for educational and learning purposes. The author is not a licensed financial advisor and holds no formal financial education. This post does not constitute professional financial advice. All investing involves risk of loss. Always conduct your own research and consult a licensed professional before making any investment decisions.