
Weekly Review - 2026-July-02
The market is rebalancing out from the MAG7 into a broader market.

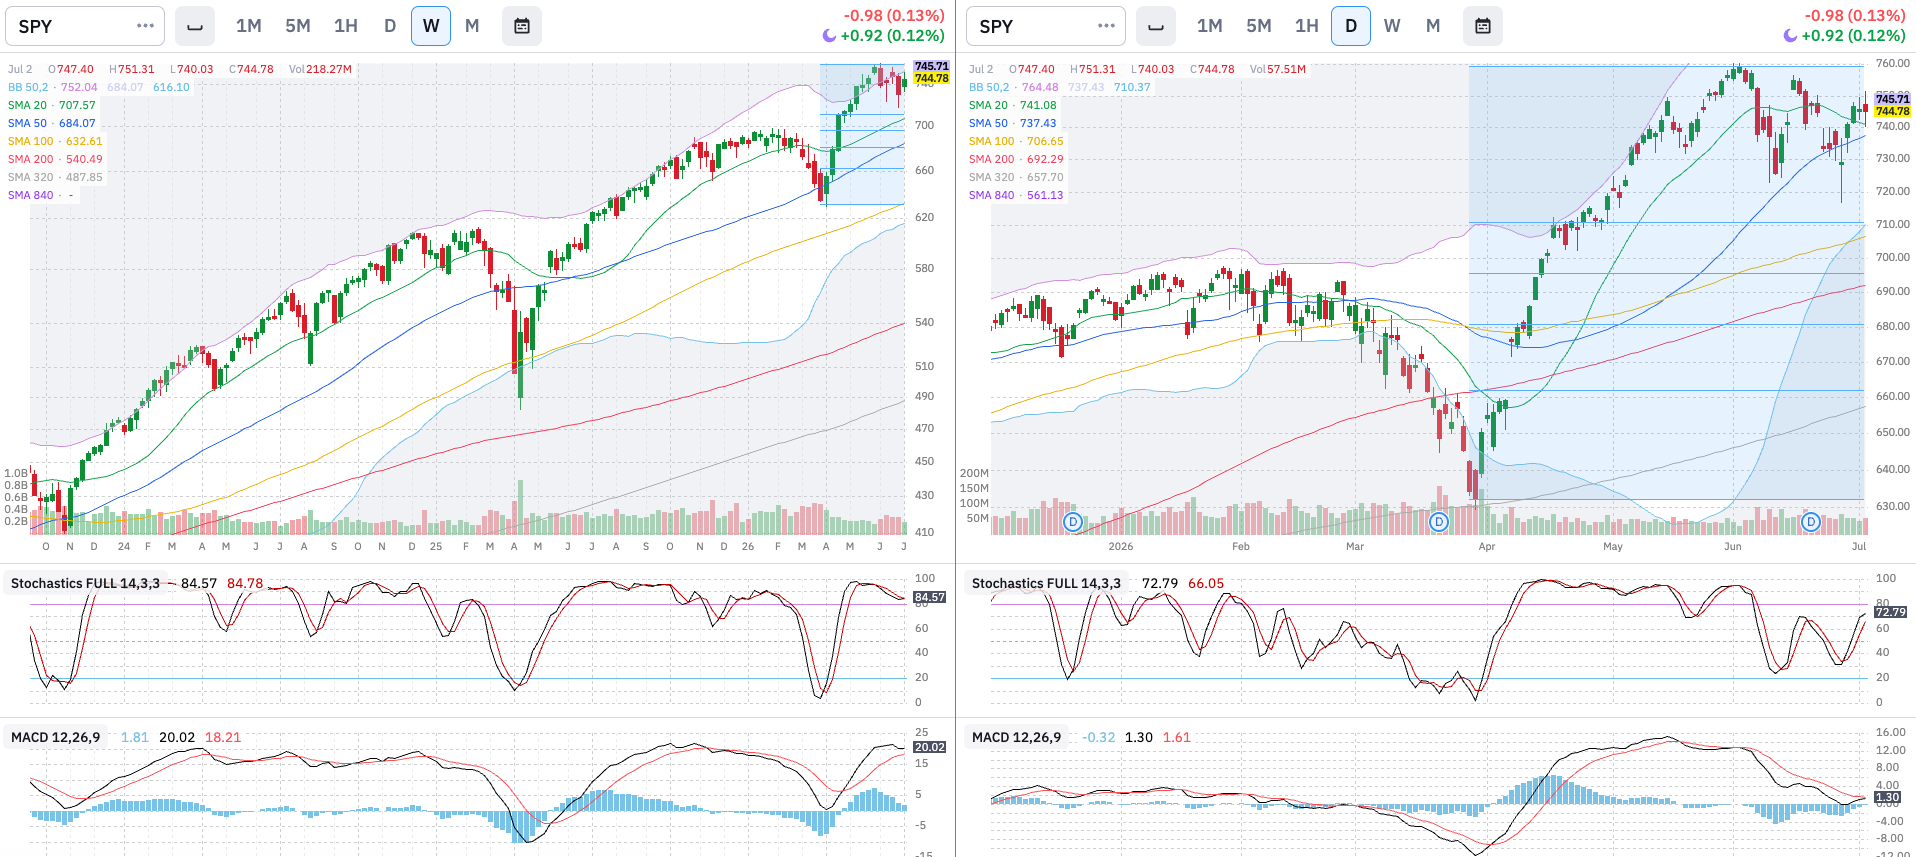
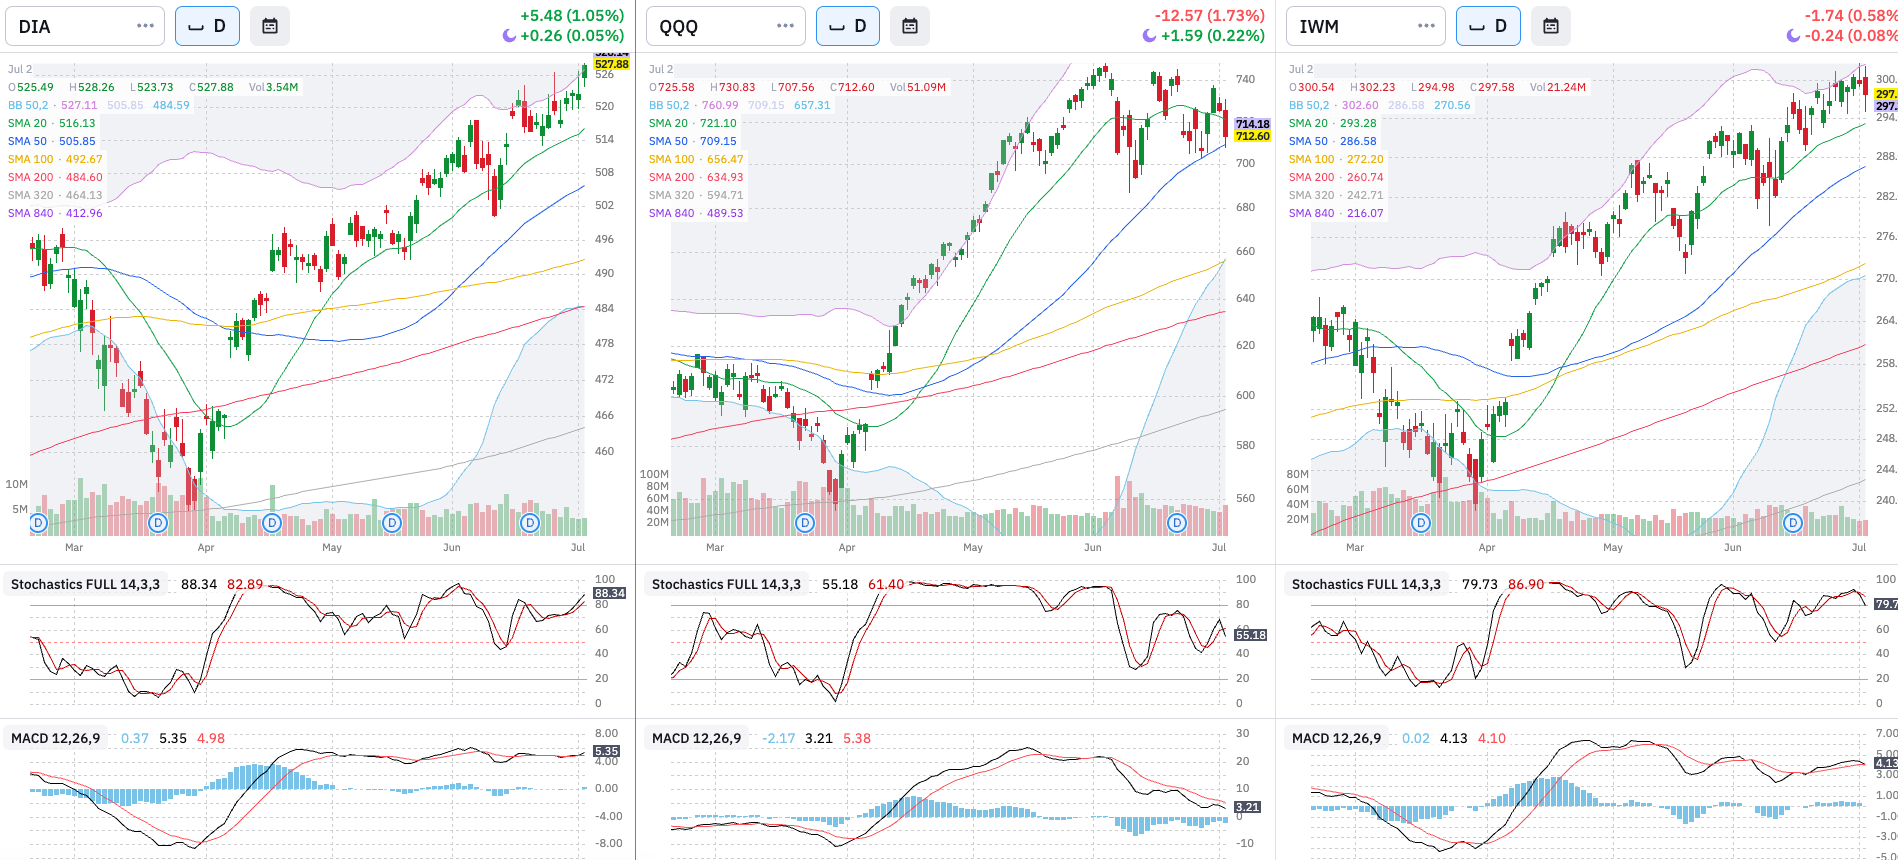
Comment: SPY rallied to rebound above the 50D and 20D SMA levels. Looking at the DIA, QQQ, and IWM charts we see that the play at hand is the rotation out from QQQ into more “traditional” assets in DIA and IWM. QQQ bounced out of the 50D SMA and broke above the 20D to fall back below it again on Thursday (last trading day). The 50D SMA supported the index, at least for now.
Level 1: Why is it happening?
Economic Data: Production: ISM PMI vs. SPX
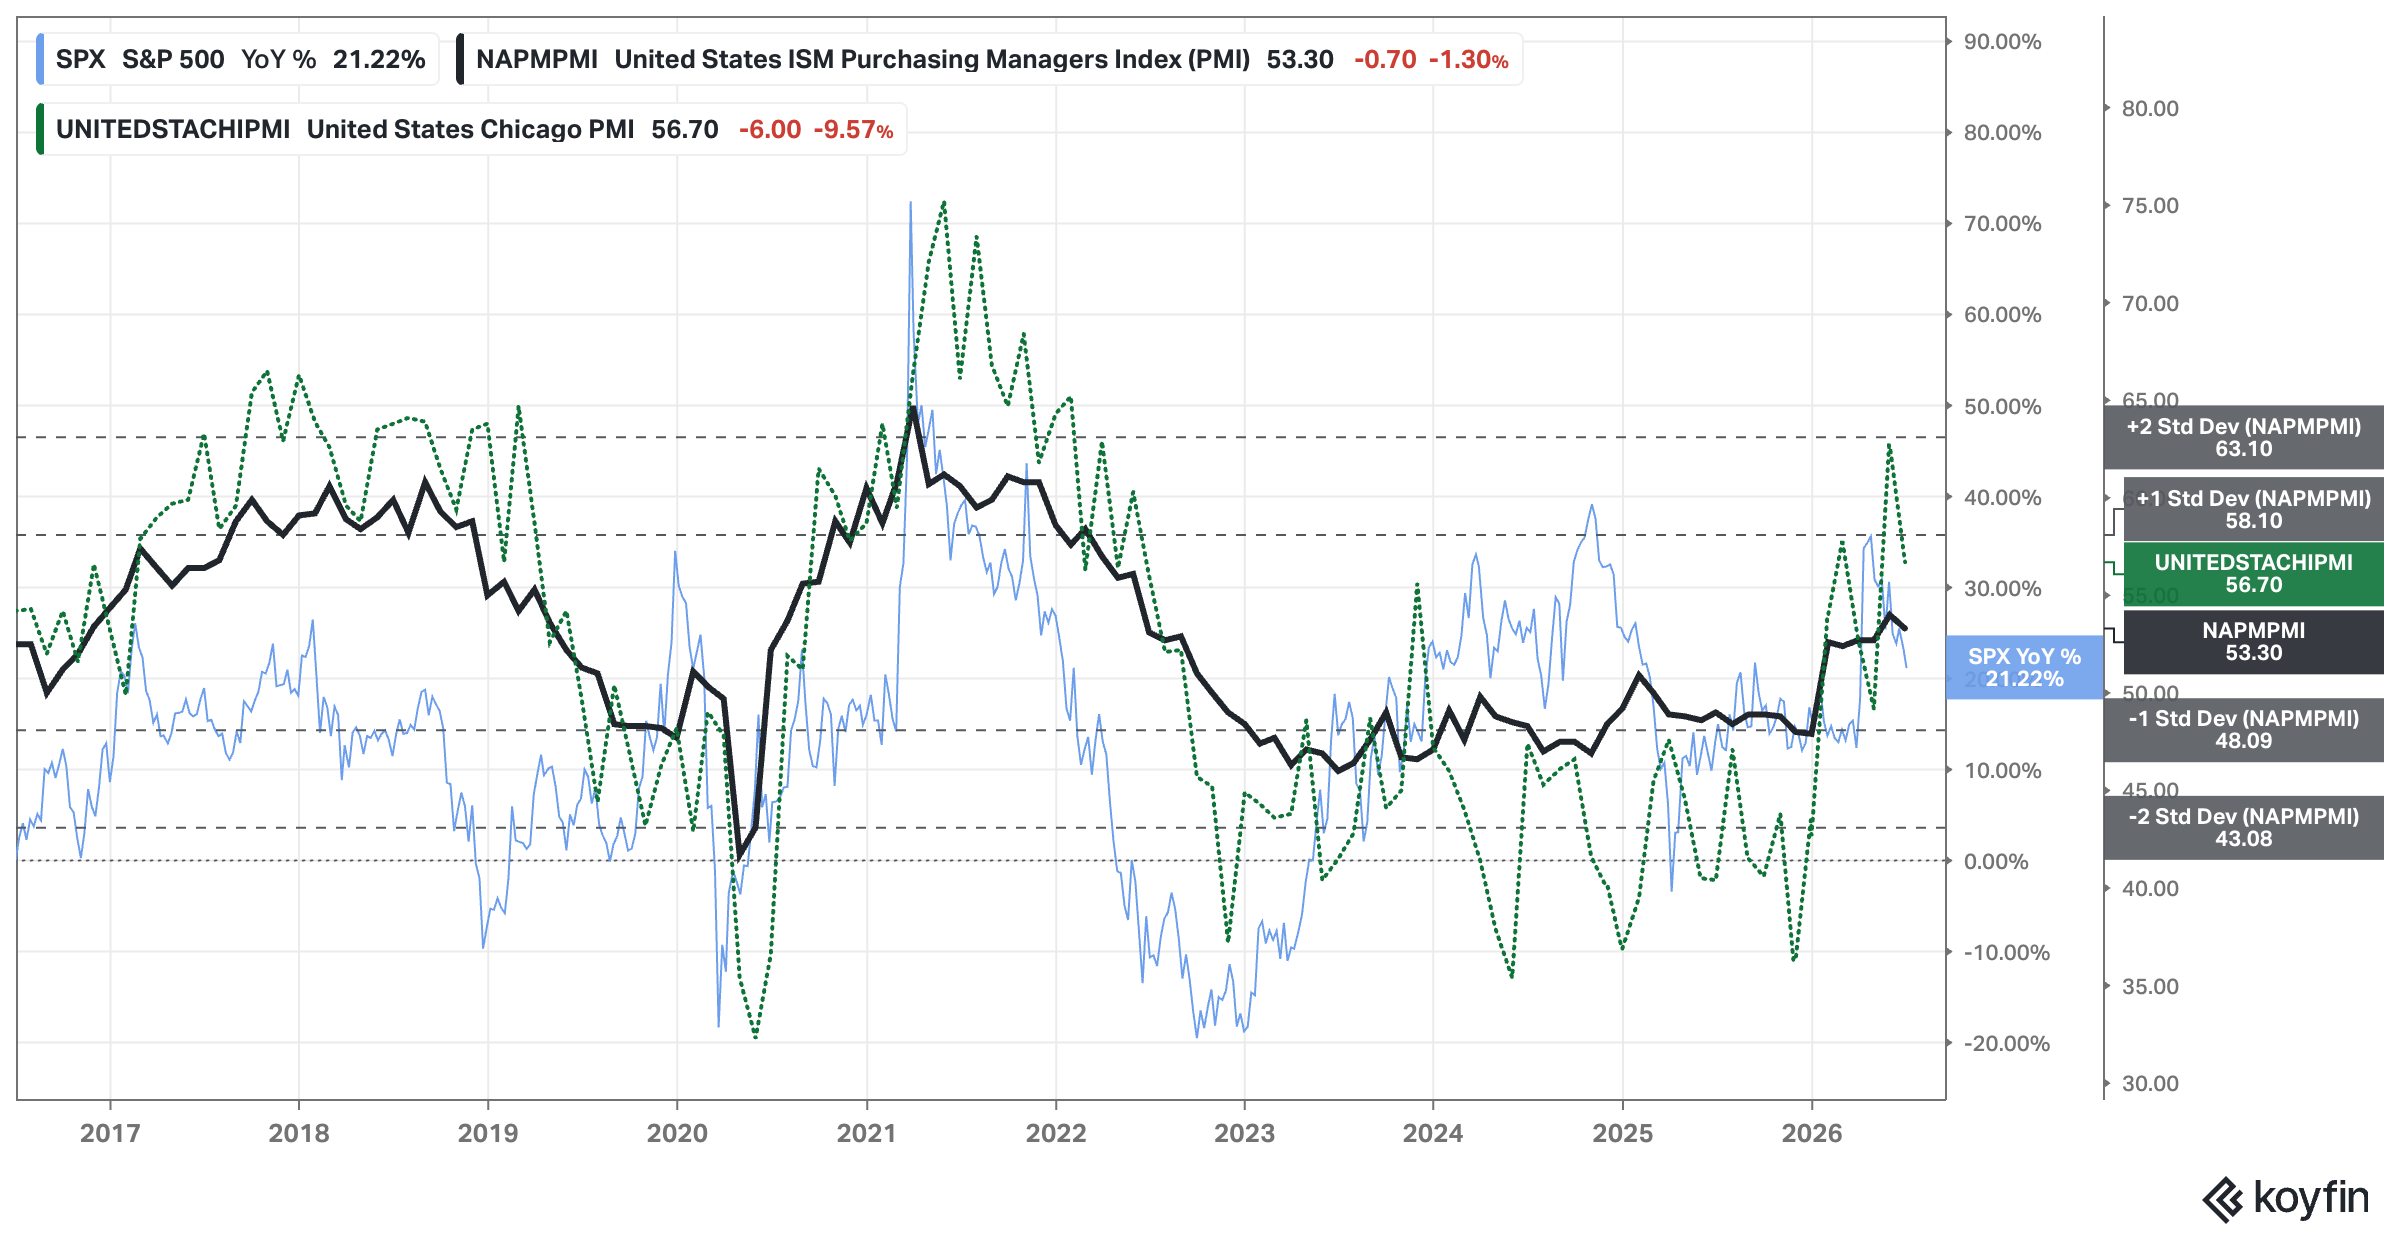
Analysis: Mute evolution of US PMI, yet on a bullish trend with room to run.
Current Situation: Bullish
Future Outlook: Bullish
Economic Data: Production: Dallas & Philadelphia Manufacturing vs. SPX
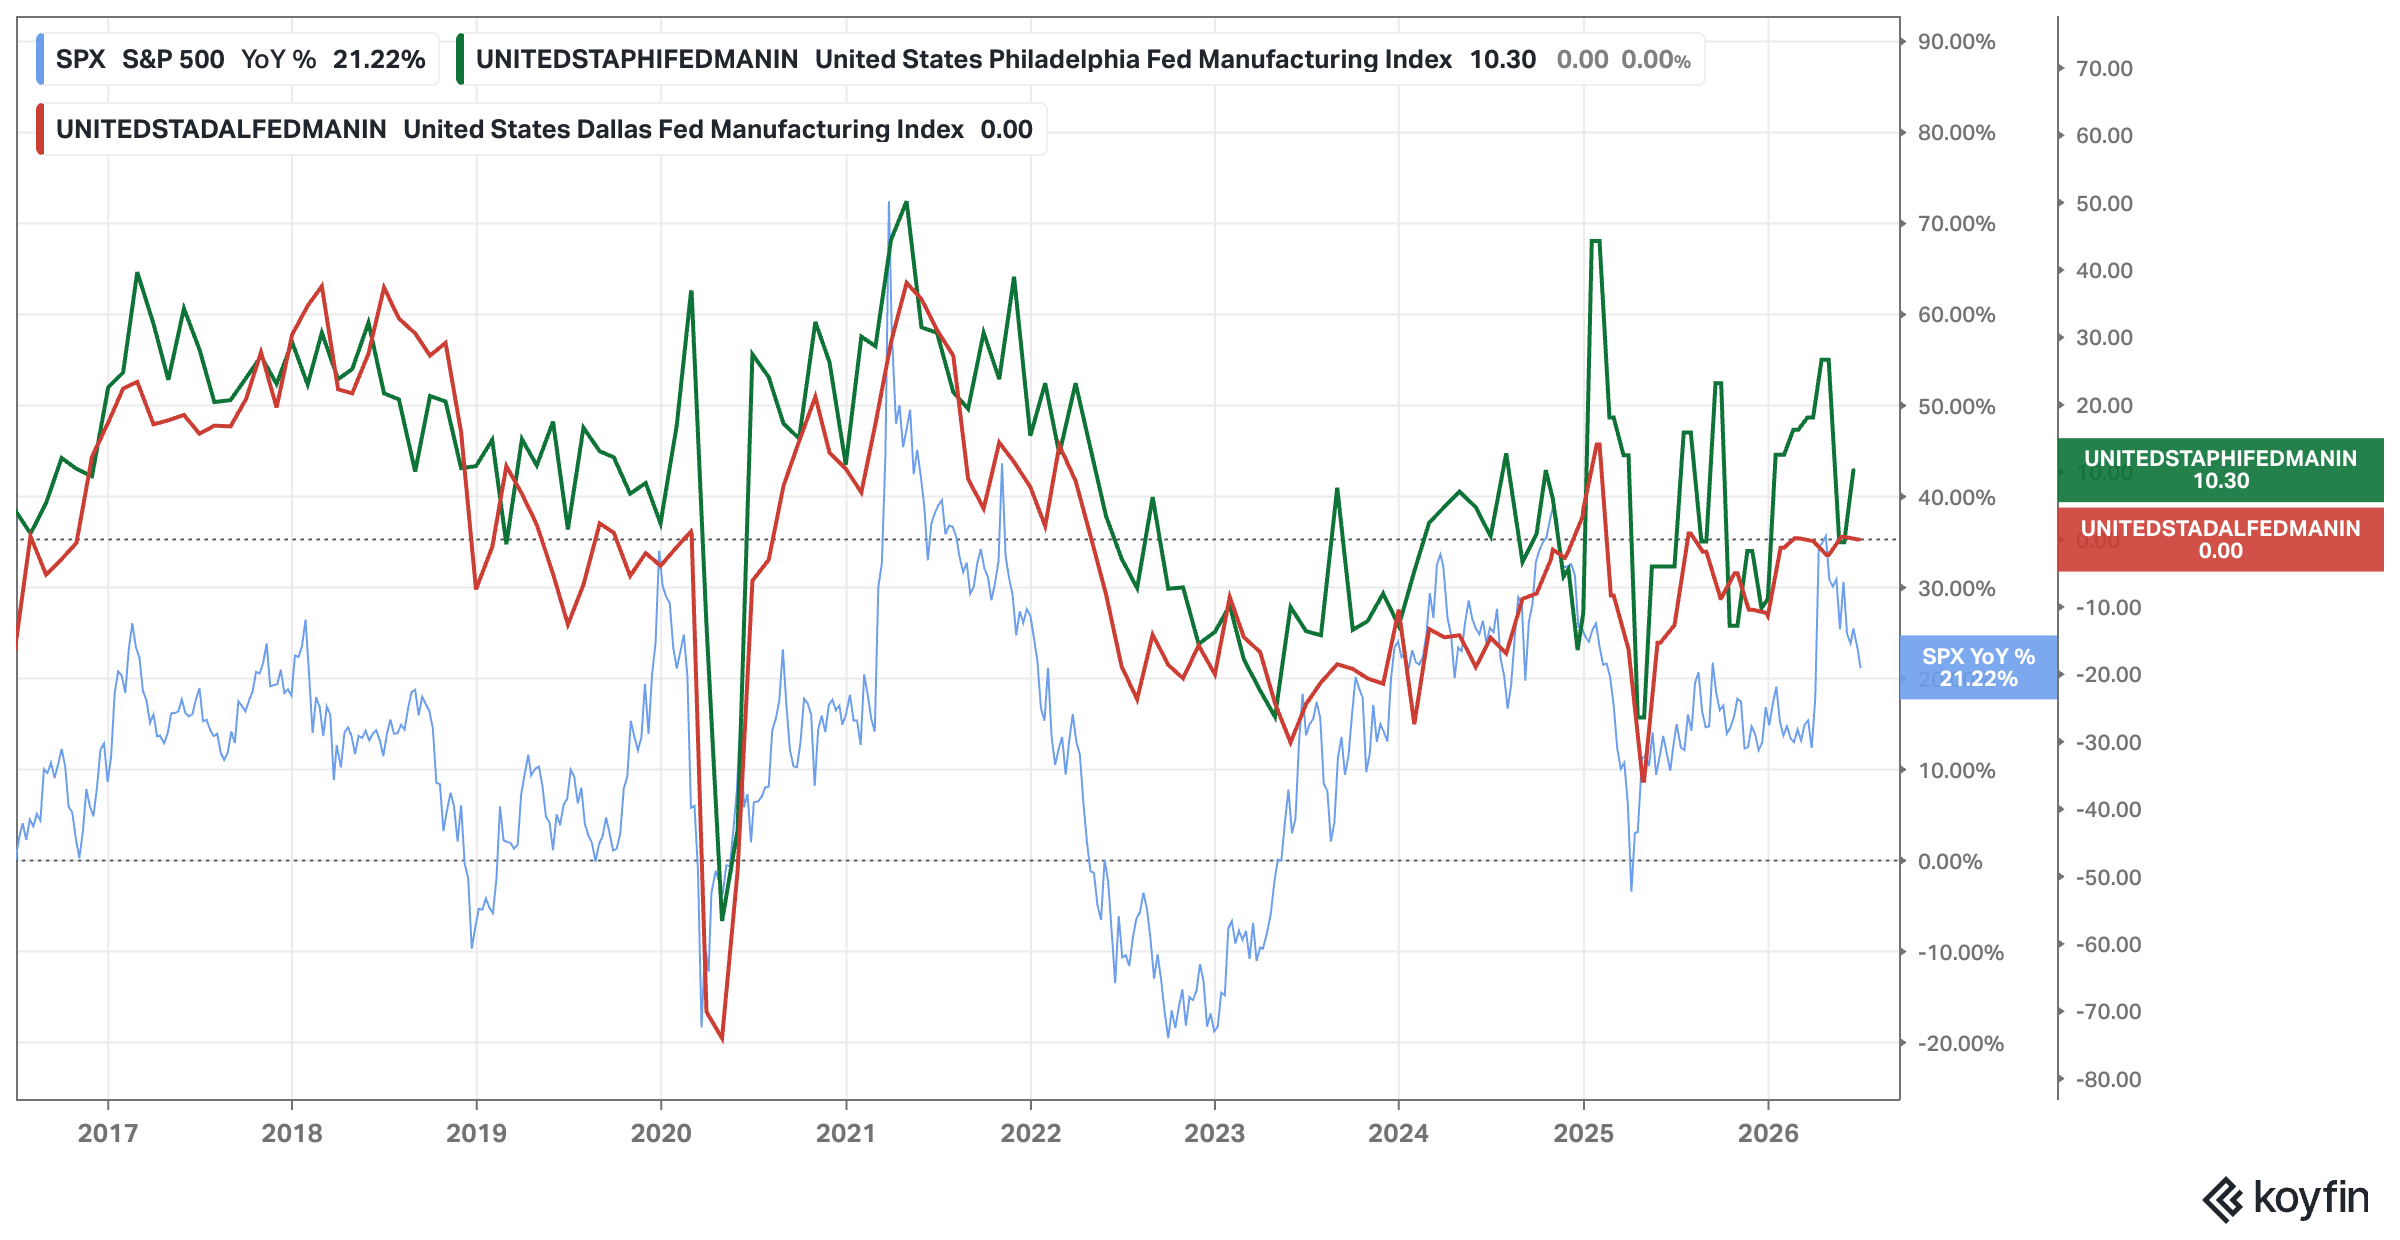
Analysis: No updates since last week.
Current Situation: Neutral
Future Outlook: Bullish
Economic Data: Activity: Regional Banks Performance
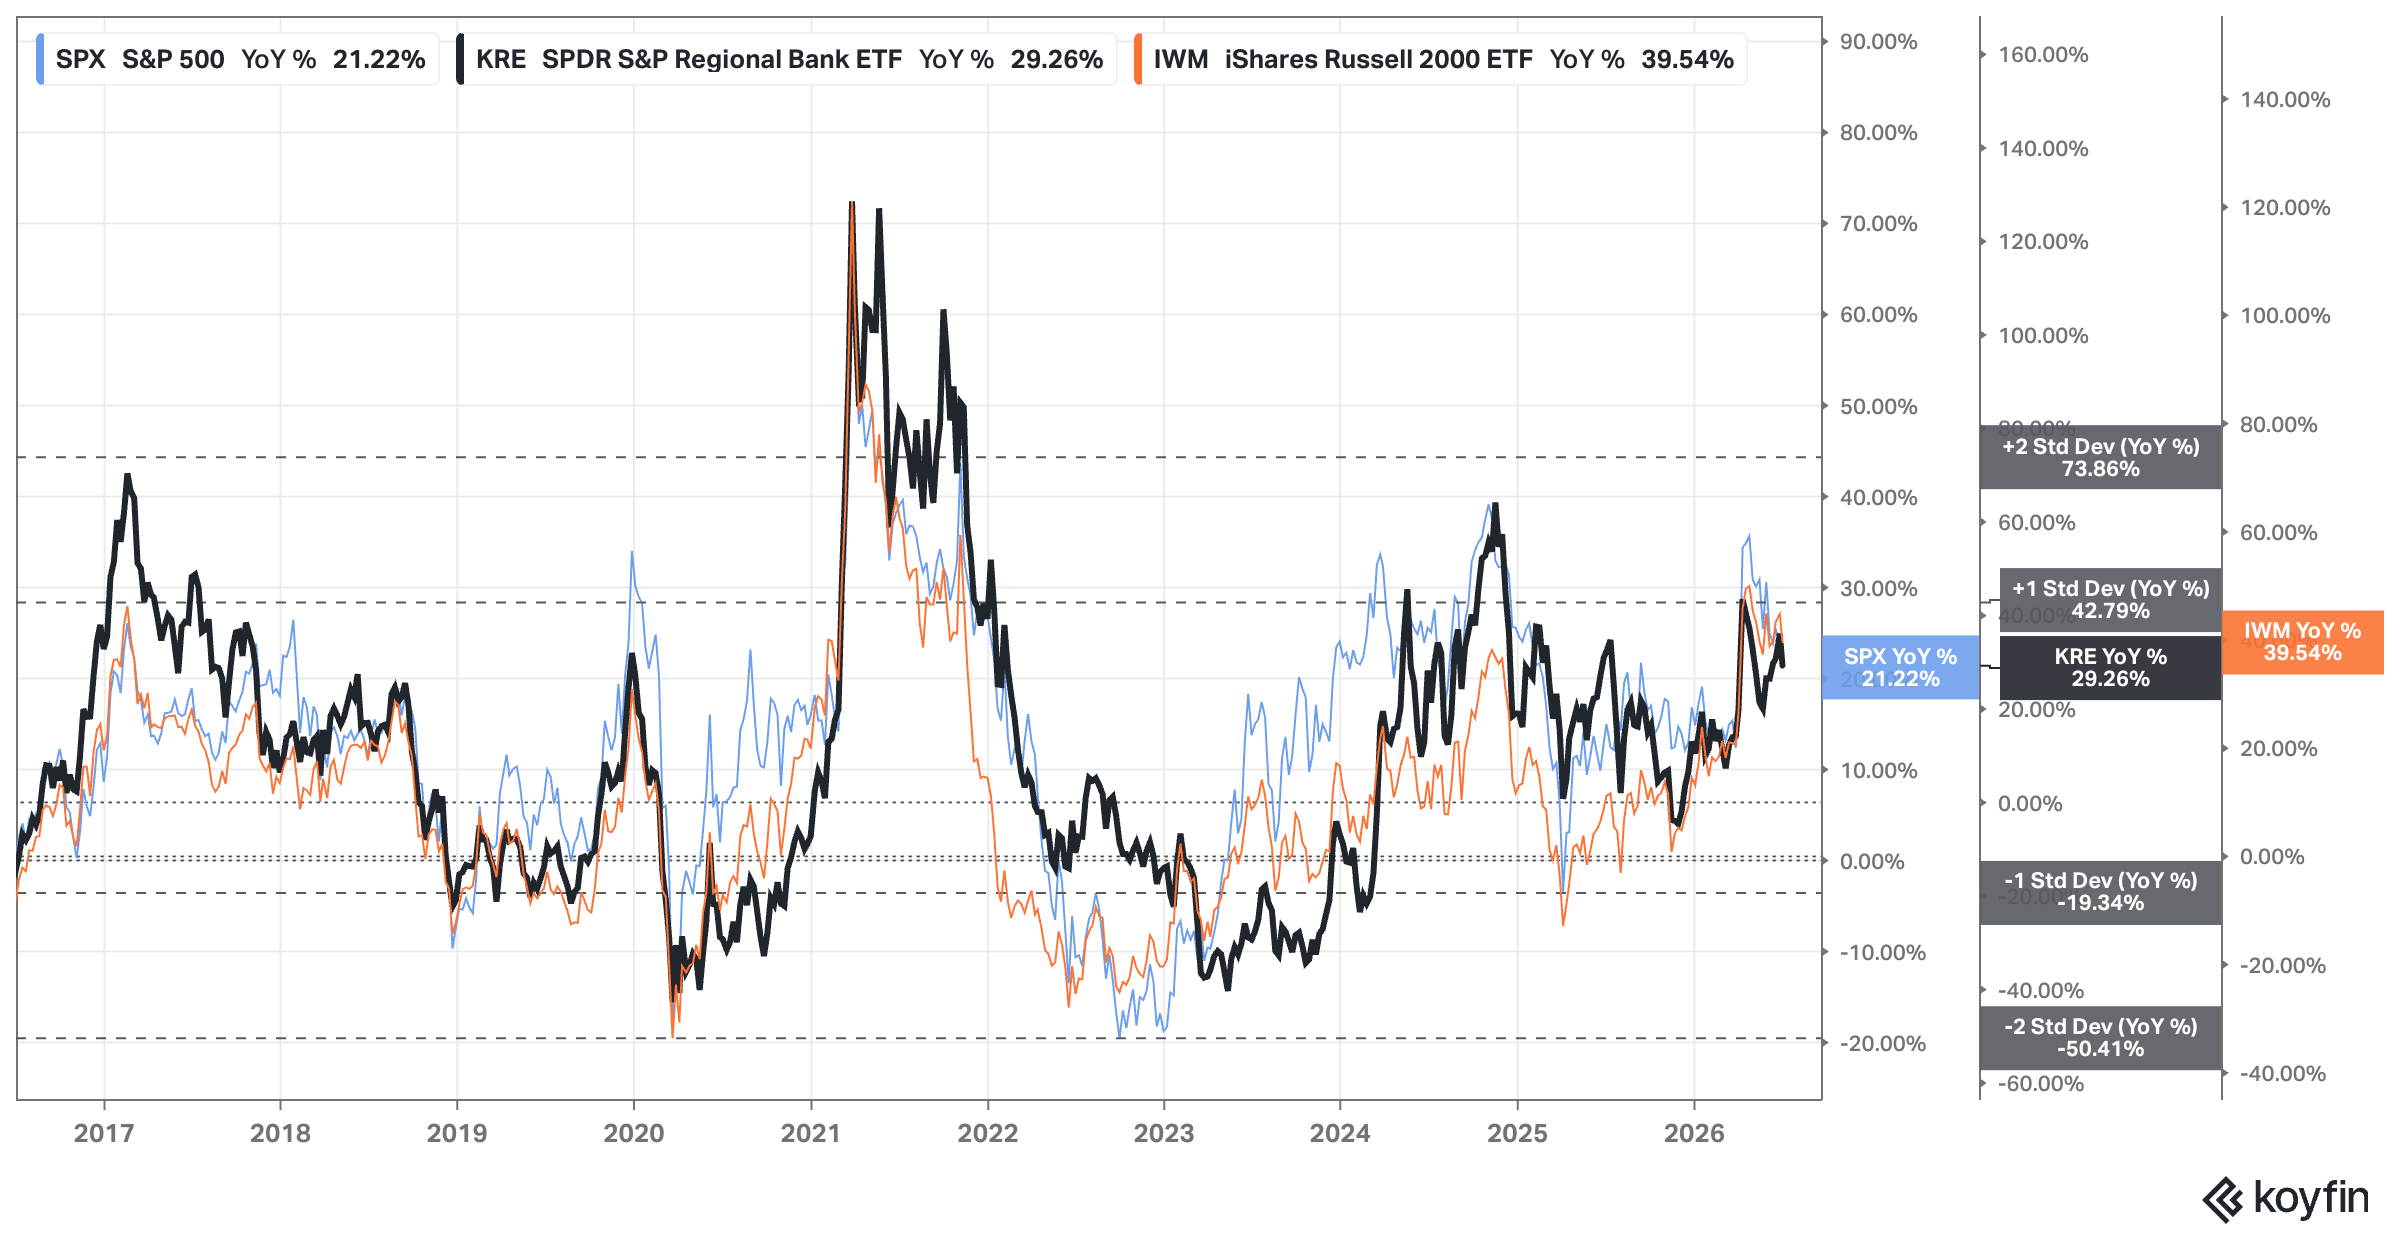
Update: I’m replacing the Consumer Sentiment indicator by the Regional Banks ETF performance. As the Consumer Sentiment is highly politicized, as it is based on opinions, I prefer to look at the performance of the regional banks, which are the ones carrying small & medium business credits. The correlation of the YoY% change of the KRE ETF maps the S&P and IWM performance quite closely.
If we look at KRE price chart we see a clear uptrend:
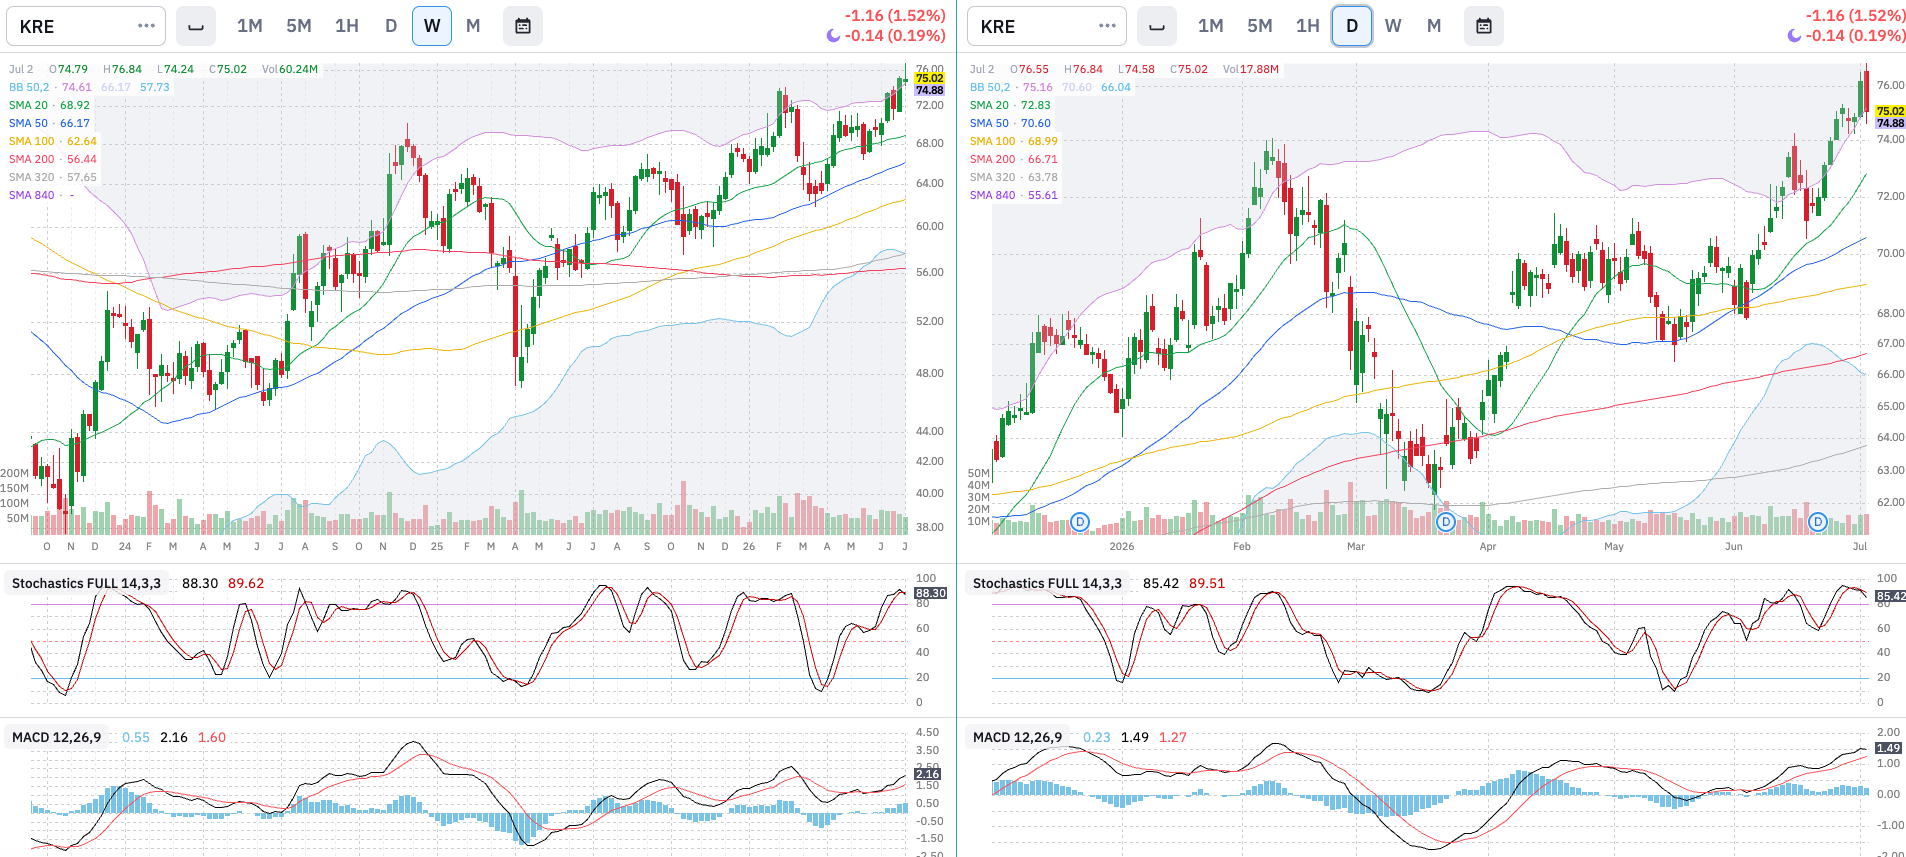
In the weekly chart, I would like to see a breakout above previous ATH and a firm consolidation above $80. Stochastics indicate that we may need to wait a while for that to happen, while MACD seems to confirm the future ATH.
Analysis: KRE performance fuels both SPY and IWM performance, and I see a bullish trend in KRE that could even accelerate once previous ATH are surpassed.
Current Situation: Bullish
Future Outlook: Bullish
Interest Rates: FED, 2yr, 10yr, and 30yr Rates
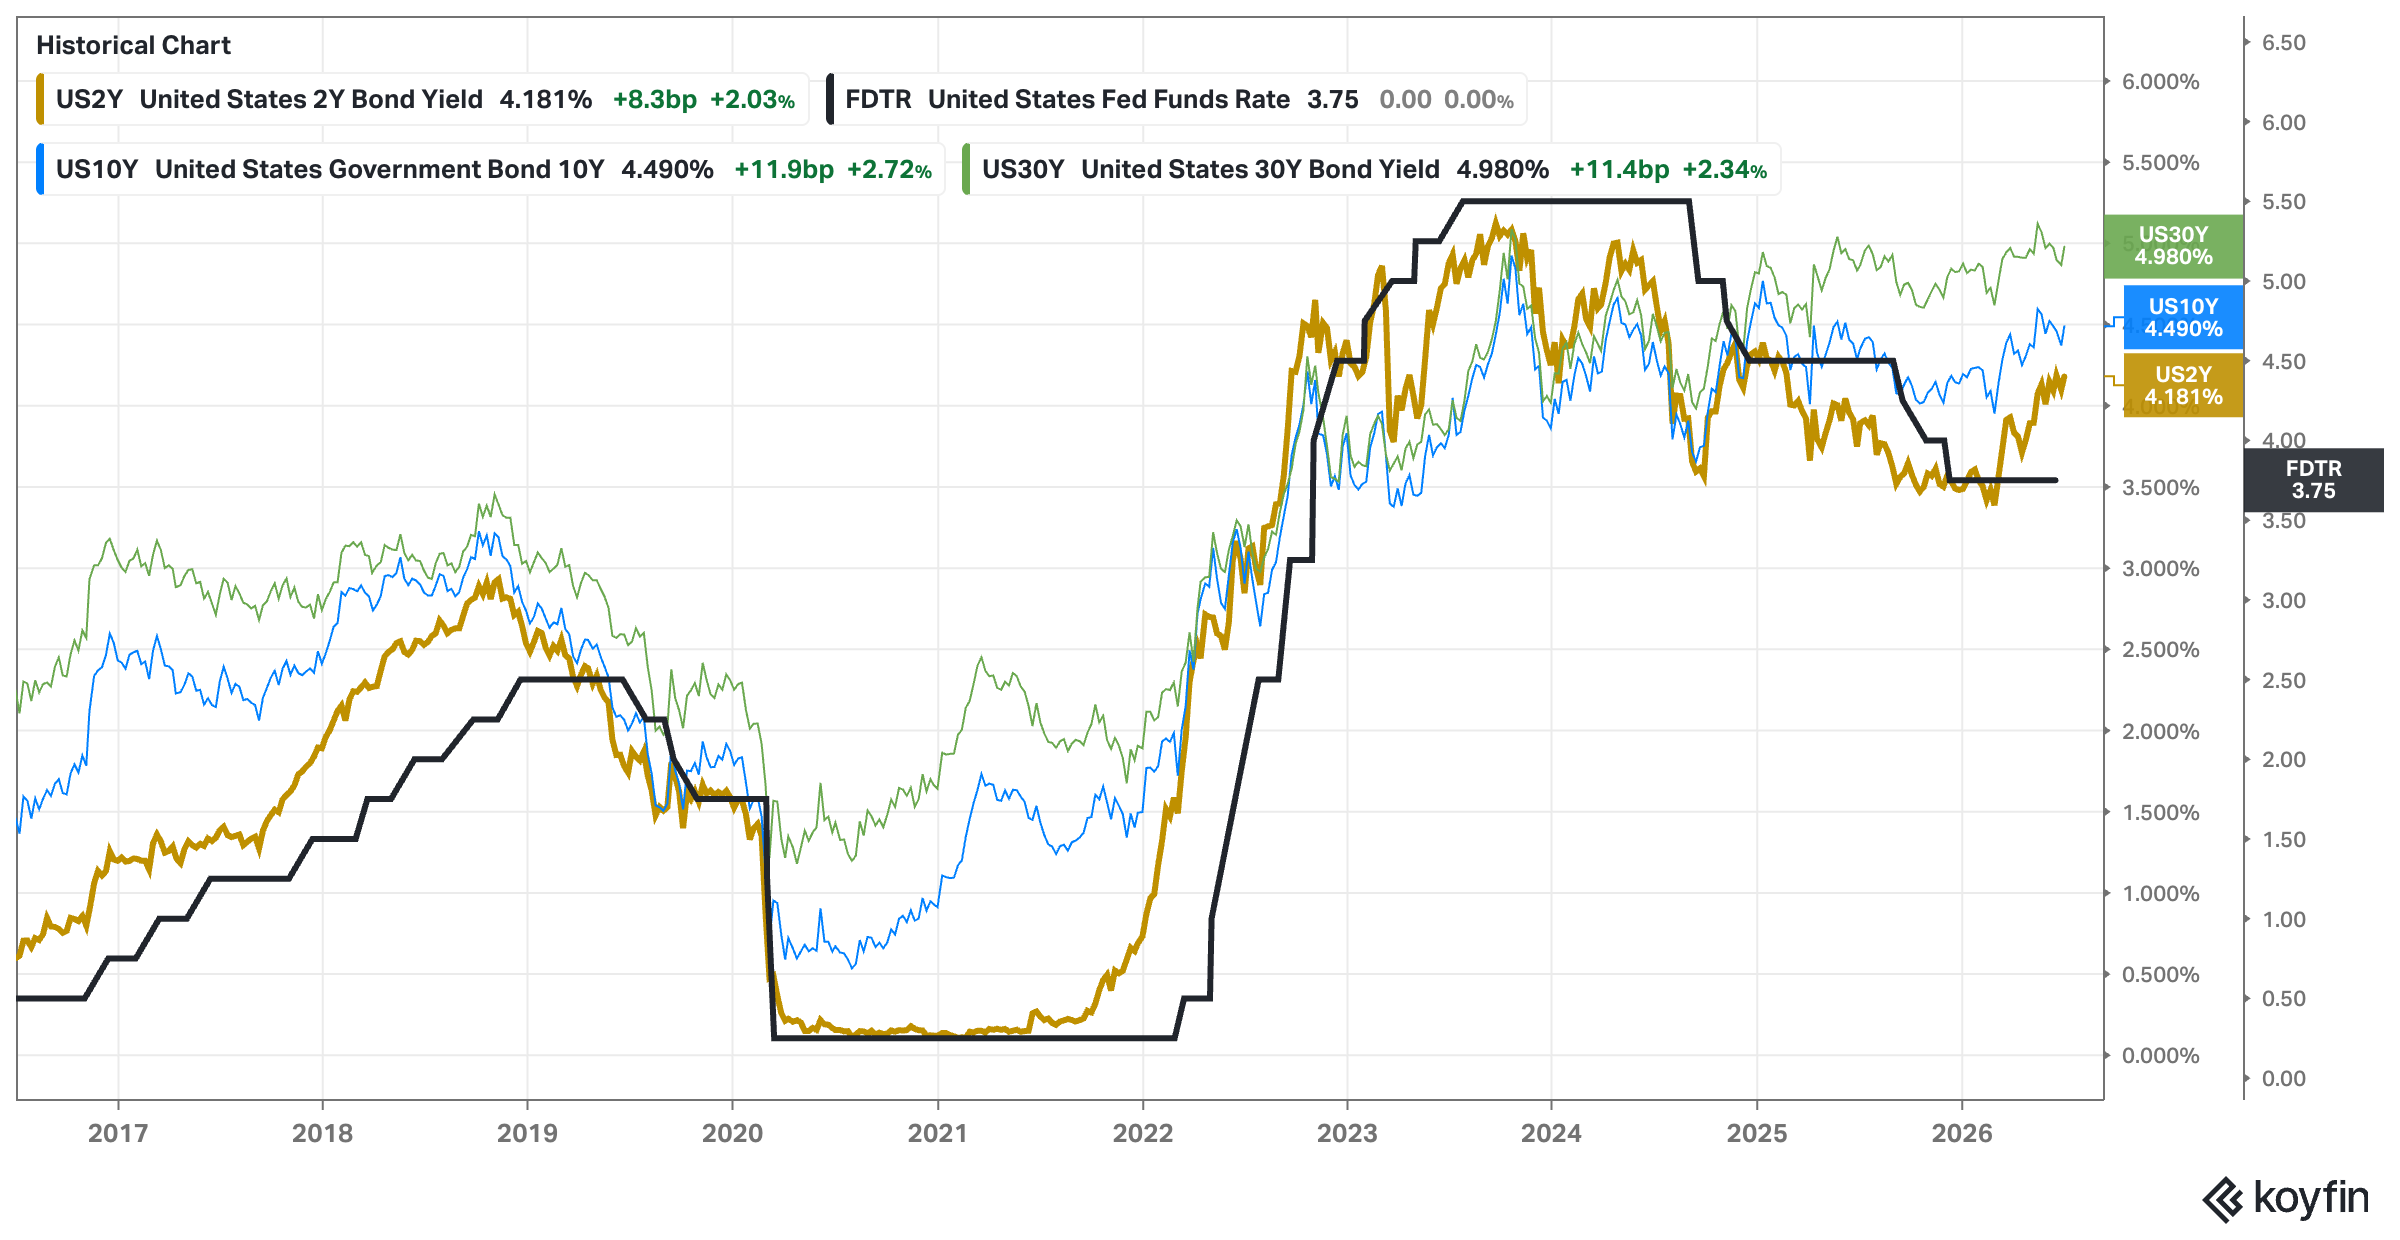
Analysis: Terms refuse to drop. The Fed may be forced to raise, which will certainly cool down the market. We prefer seeing those long and mid-term rates drop quickly.
Current Situation: Bearish
Future Outlook: Neutral
Context Investors Sentiment: Credit Spreads
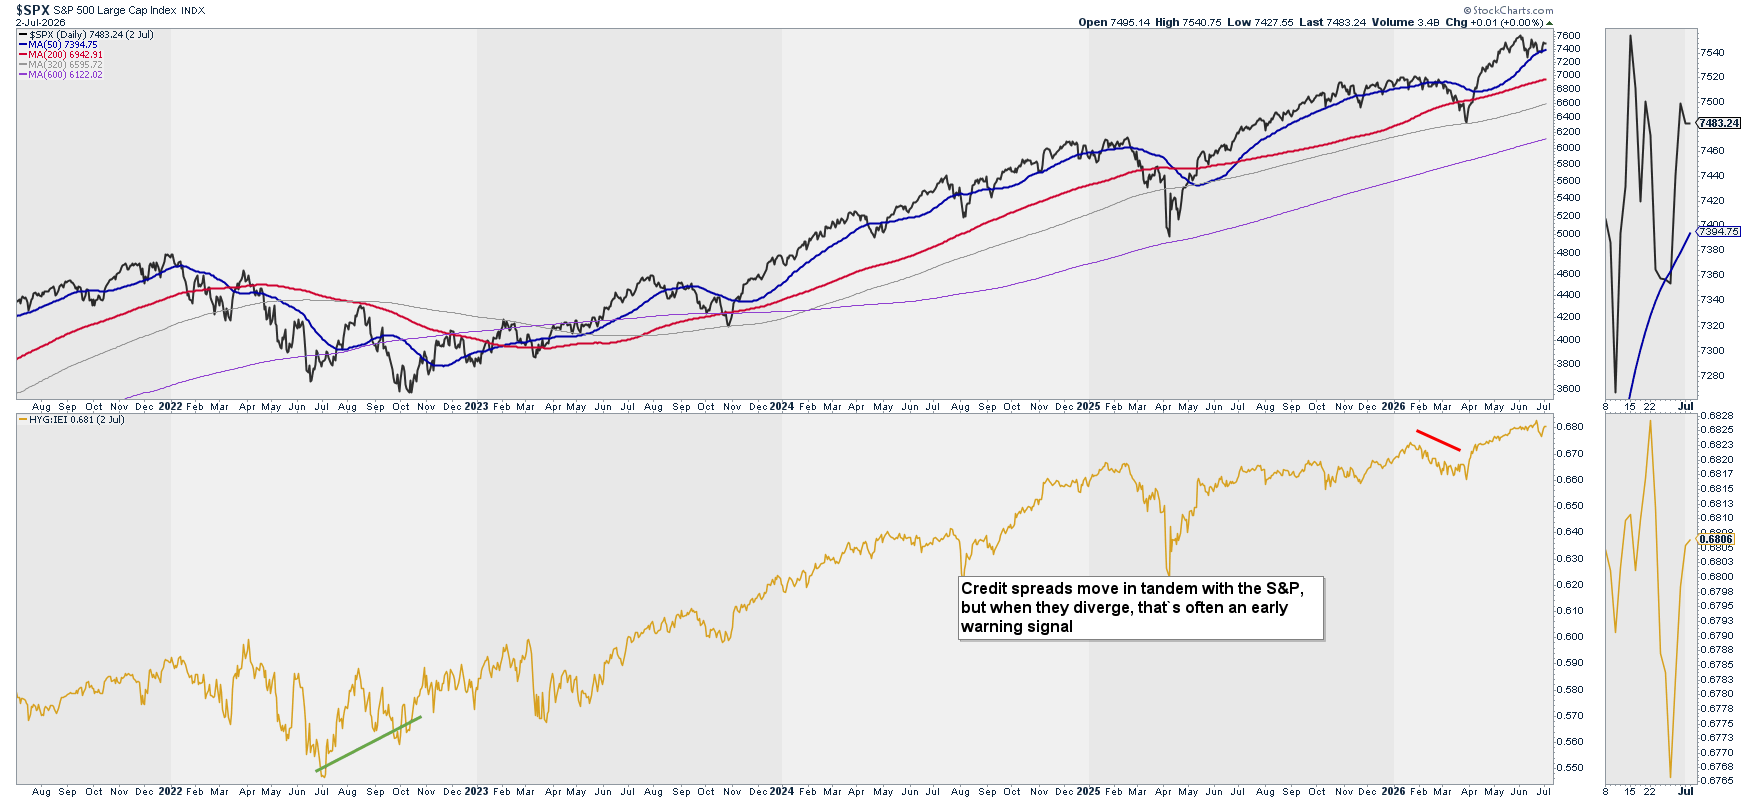
Note: Credit spreads move in tandem with the S&P, but when they diverge, that’s often an early warning signal.
Analysis: Spreads have turned lower, aligned with market’s price action.
Current Situation: Bearish
Outlook: Bearish
Level 1: Why is it happening? Summary
Economic Data: Bullish/Bullish
Interest Rates: Bearish/Neutral
Investors Sentiment: Bearish/Bearish
Level 2: What is happening?
Price Action: SPX – Long Trend – 20 & 10 years
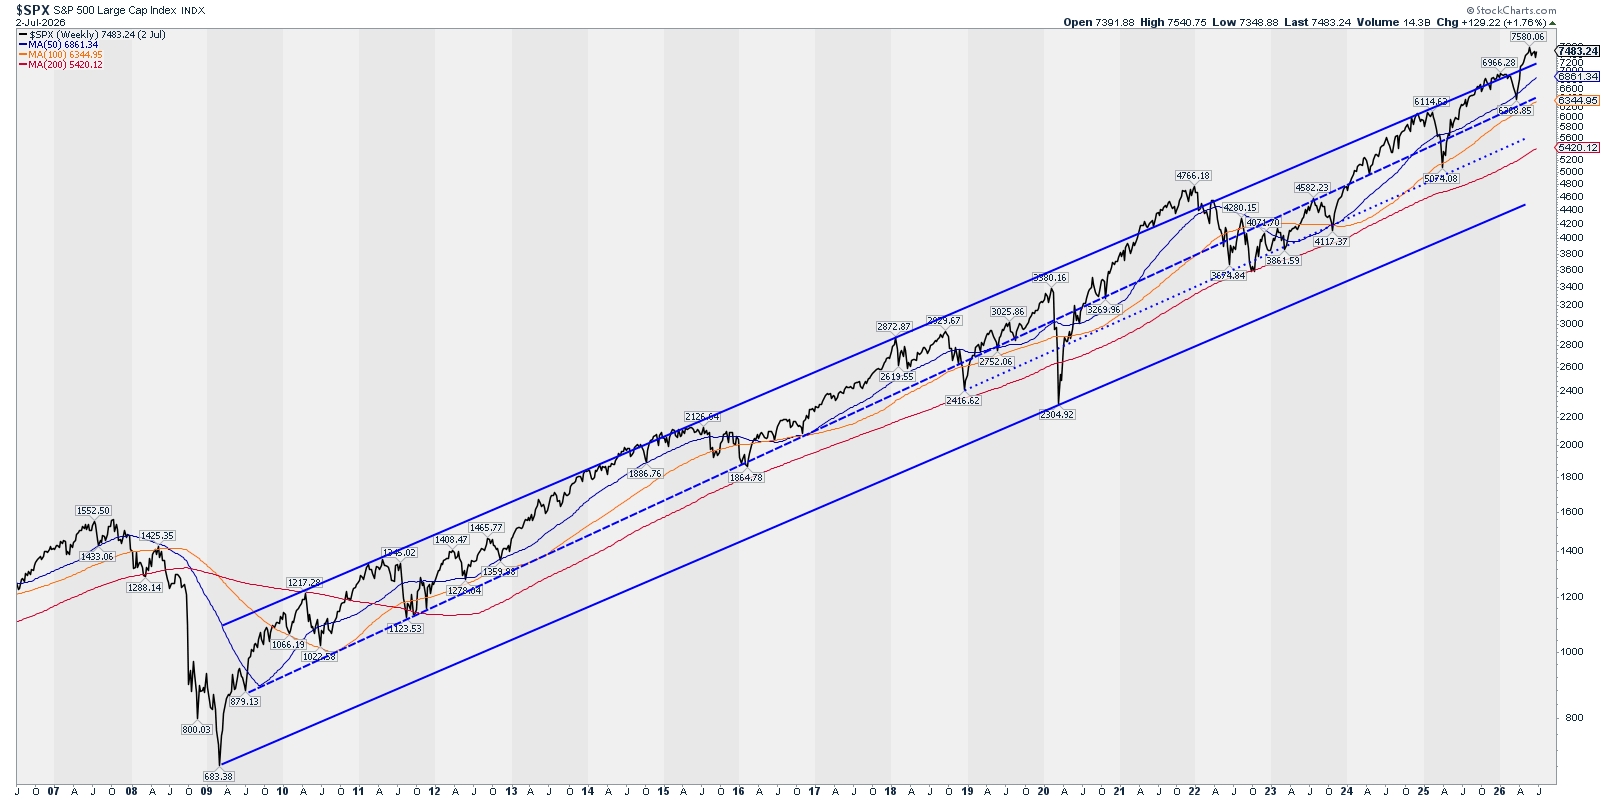
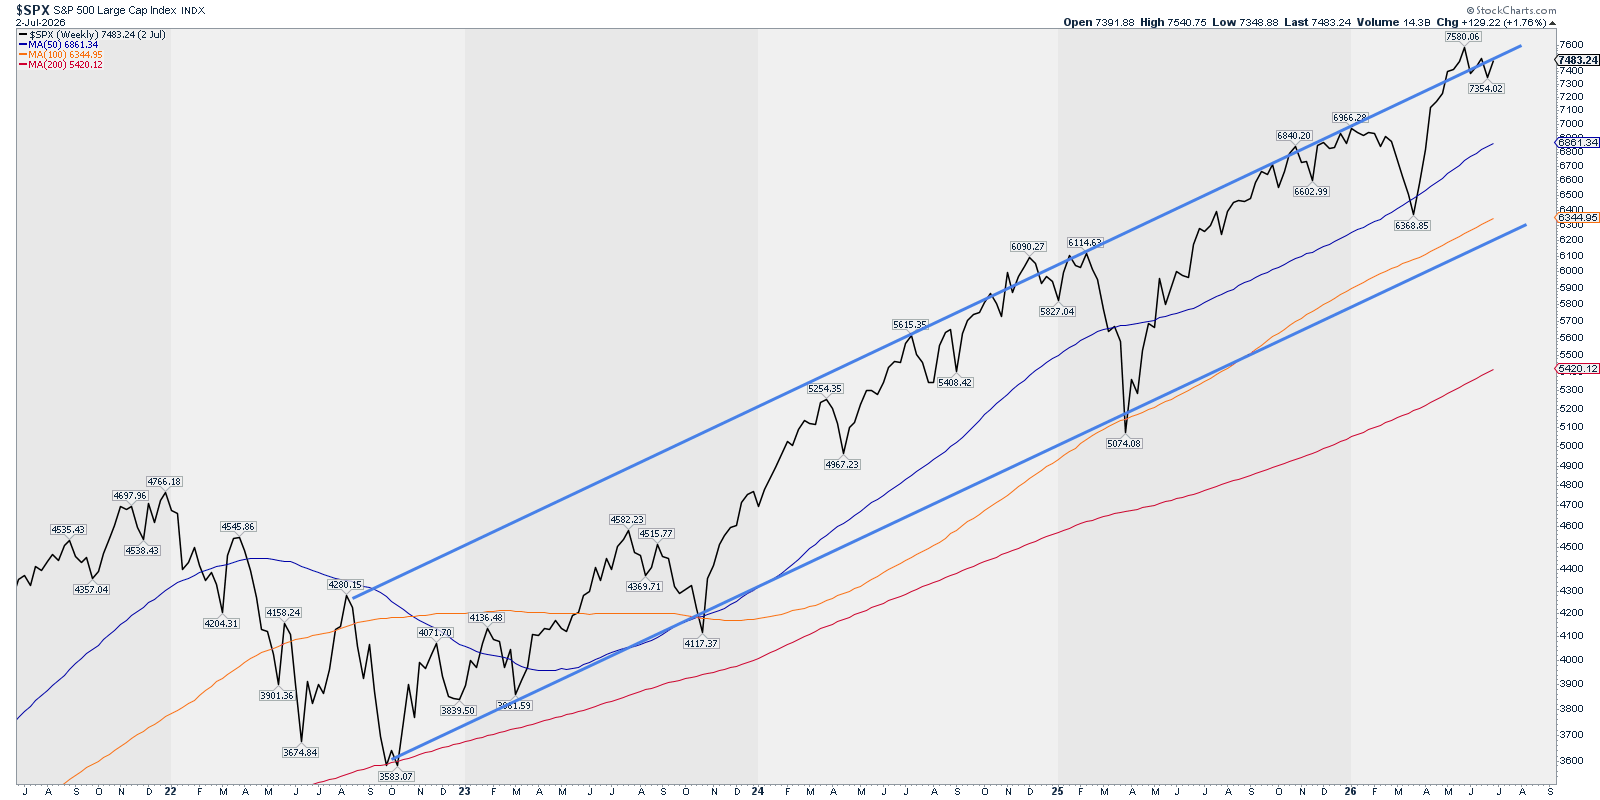
Analysis: Price inside the 10Y channel and finding resistance. The 20Y channel is still quite far down (circa 7,200 area). We can expect prices to coast along the upper side of the channel or even trending towards the middle (Weekly 50 SMA).
Current Situation: Bearish
Future Outlook: Bearish
Price Action: RSP – Trend – Weekly & Daily
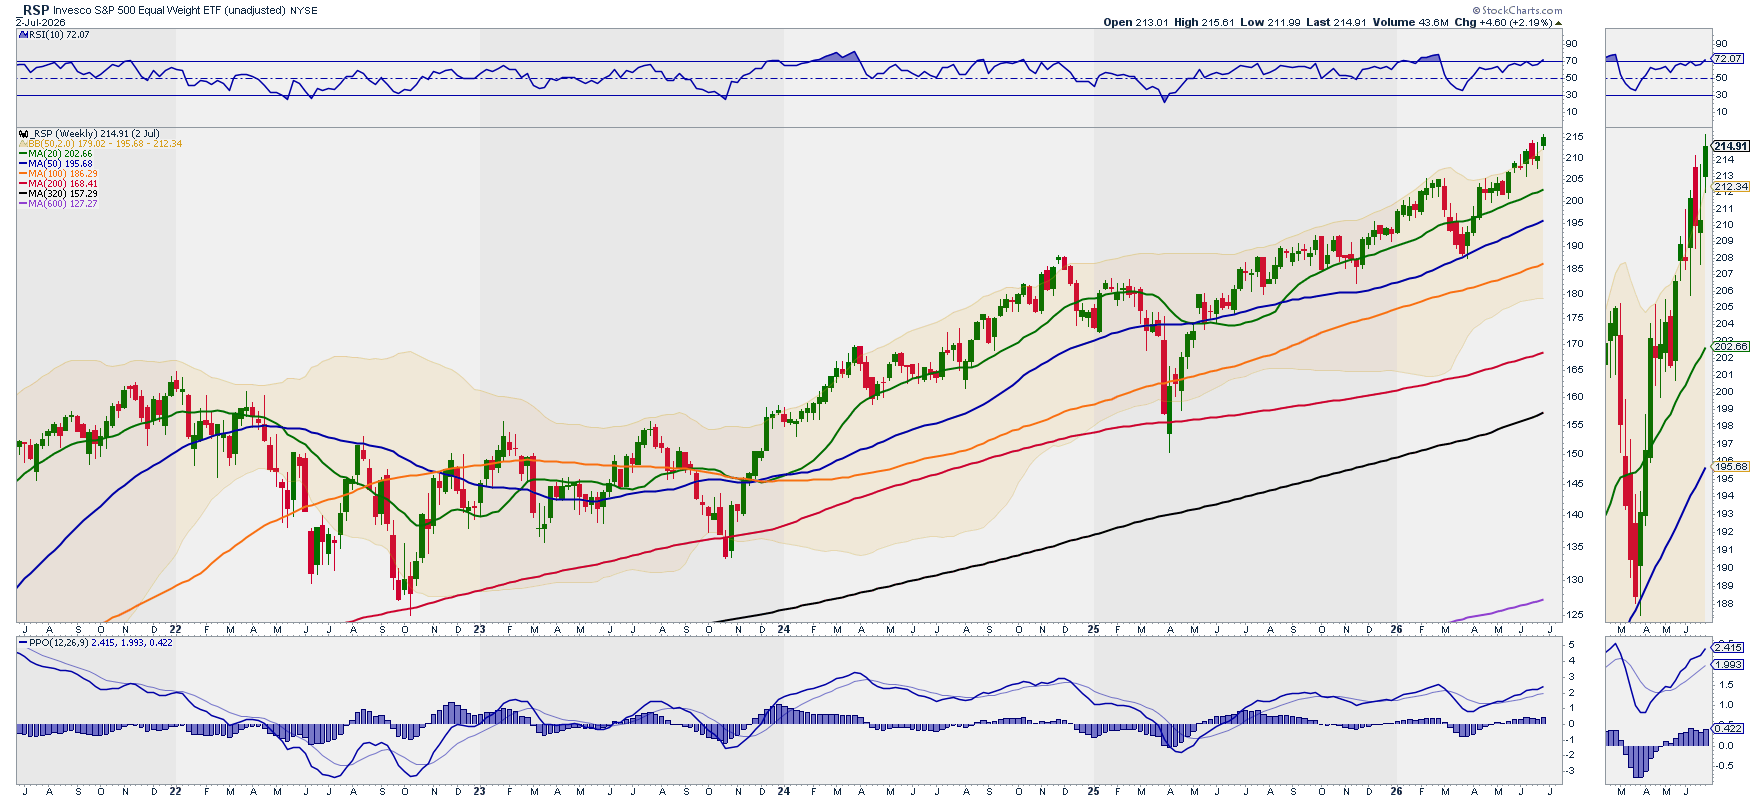
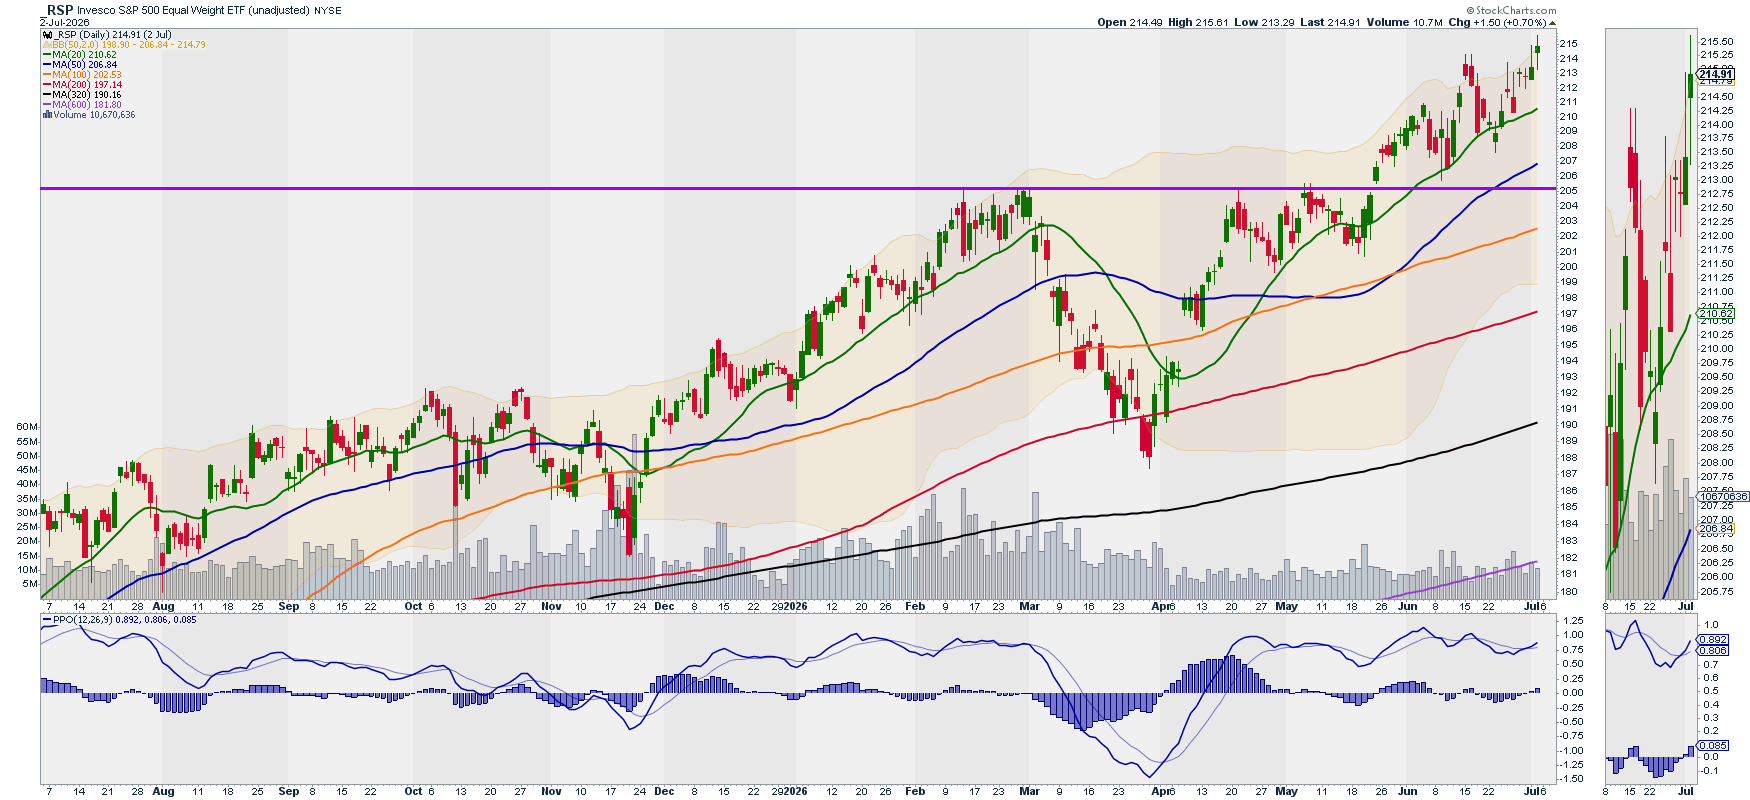
Analysis: The equal weight market is telling such a different story from the market cap. weight. RSP continue on a bullish trend breaking to ATHs this week. The current situation is bullish but weekly RSI and PPO are near overbought values. Also, price is over-extended relative to its 20 SMA. For these reasons, my outlook is bearish (correction).
Current Situation: Bullish
Future Outlook: Bearish (correction)
Breadth: RSP vs. SPY relative performance
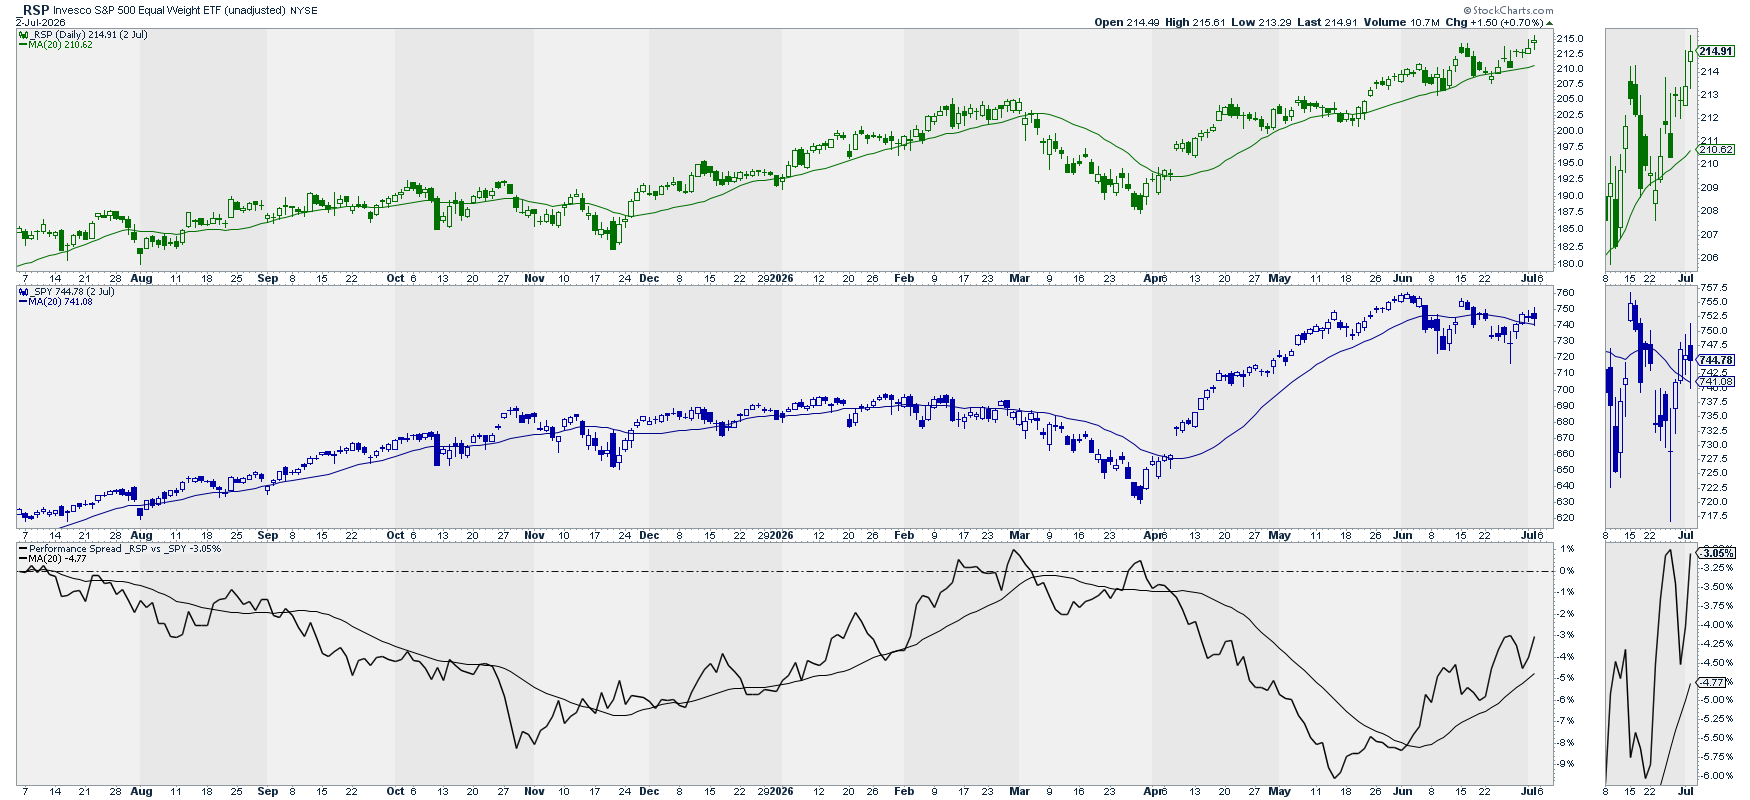
Analysis: RSP (green) vs. SPY (blue) ratio (black) increased, meaning we are in a “Breadth Expansion” situation with an outlook of “Expansion” as per the 20D SMA slope.
Current Situation: Expansion
Future Outlook: Expansion
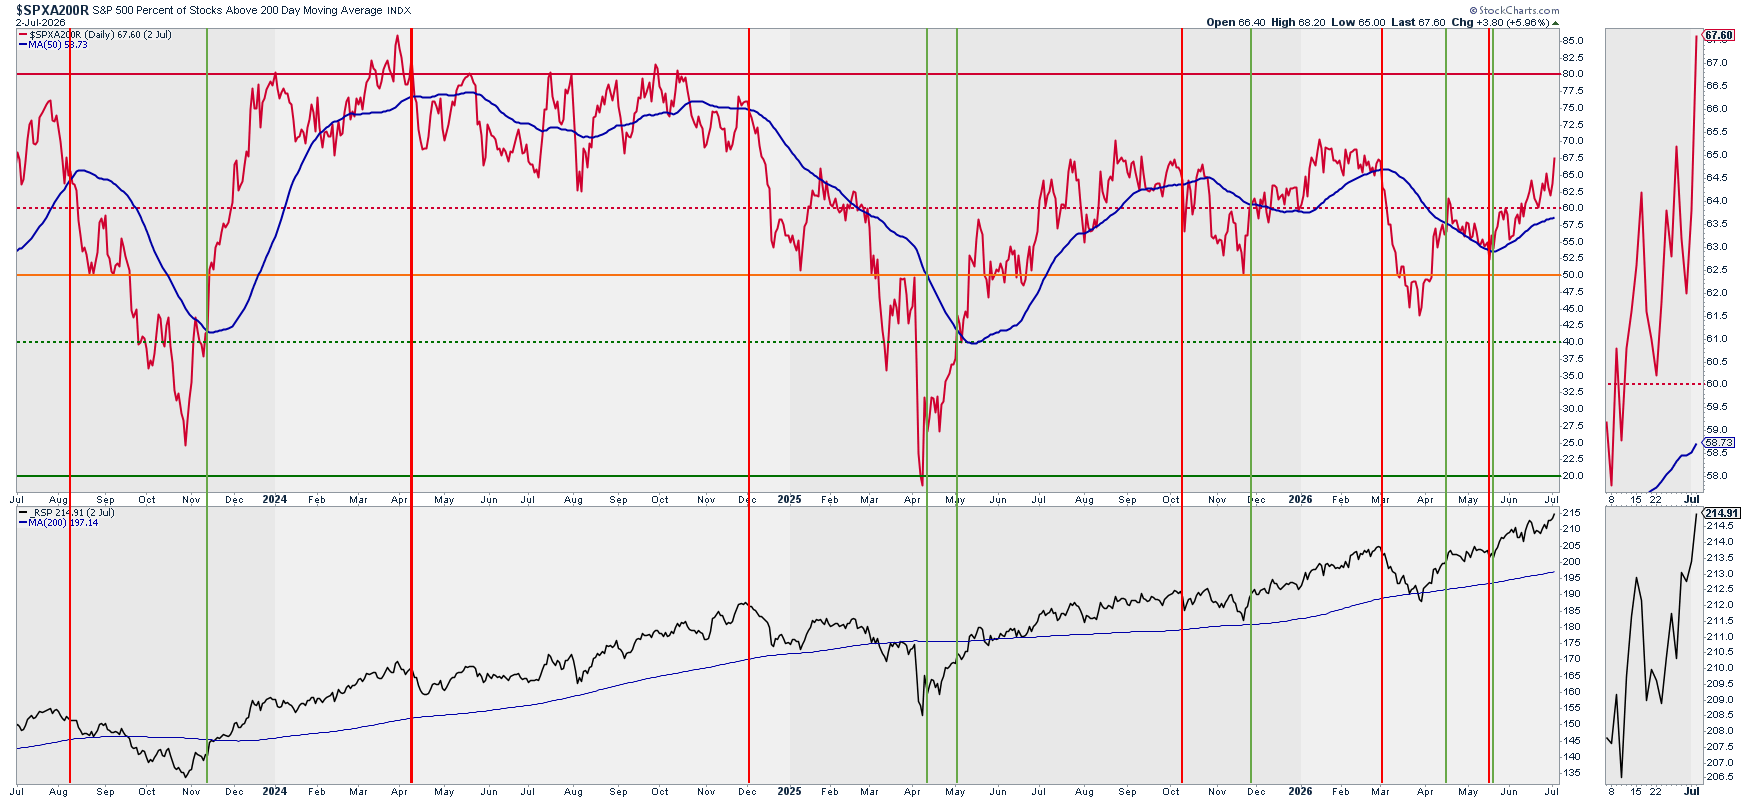
Breadth: % Stocks above SMAs vs. RSP
Above 200 Daily SMA
Above 20, 50, and 200 Daily SMAs
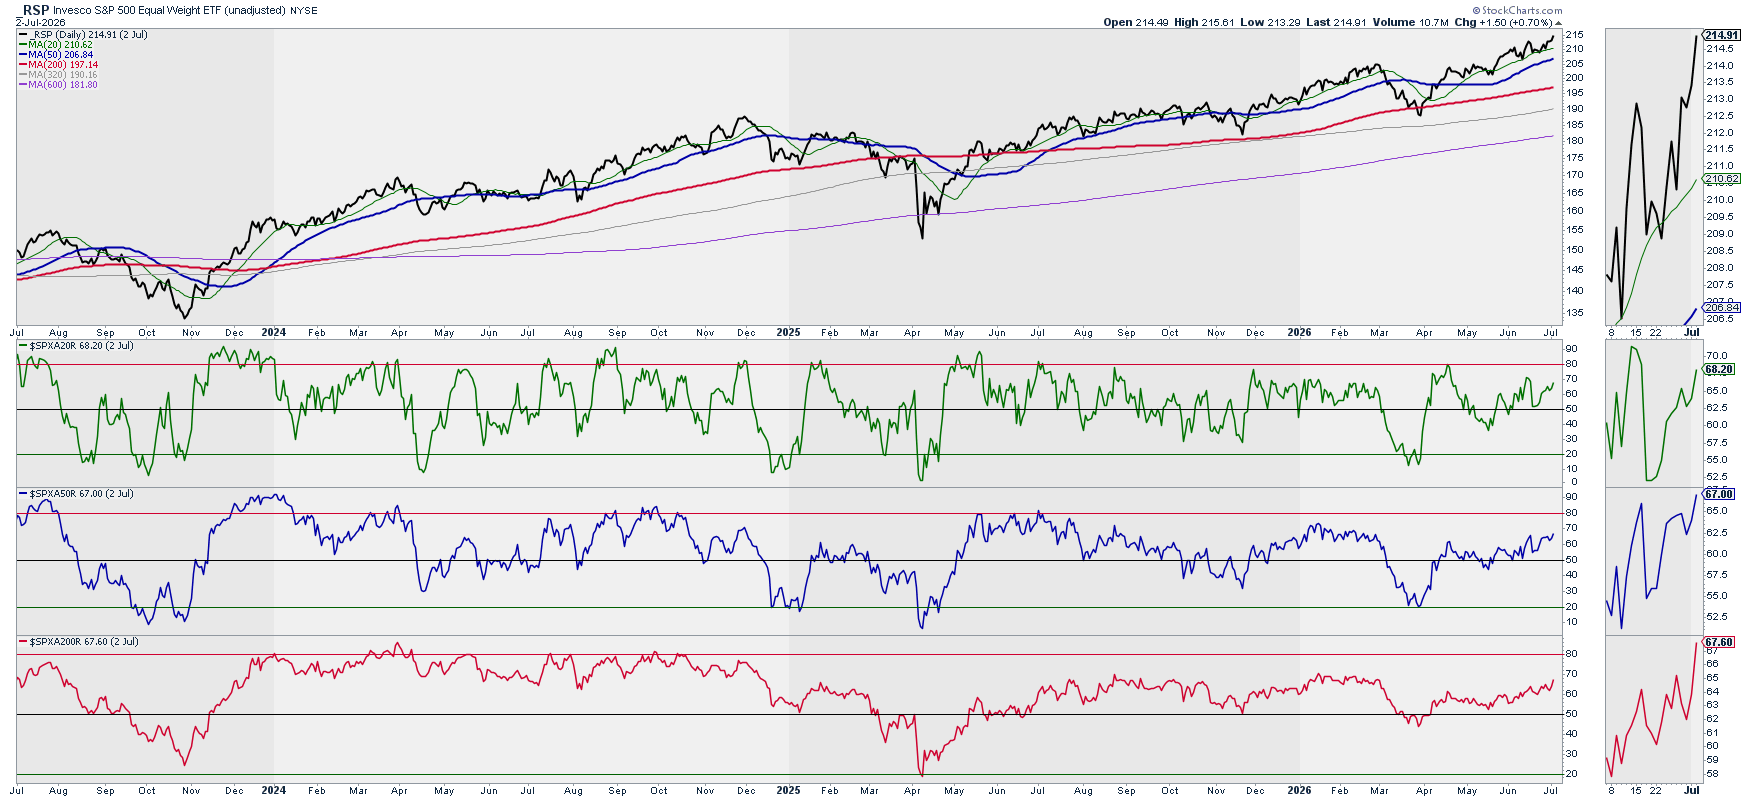
Analysis: Breadth is expanding and we have room to run. We remain on bullish territory.
Current Situation: Bullish
Future Outlook: Bullish
Breadth: New Highs vs. RSP & SPY
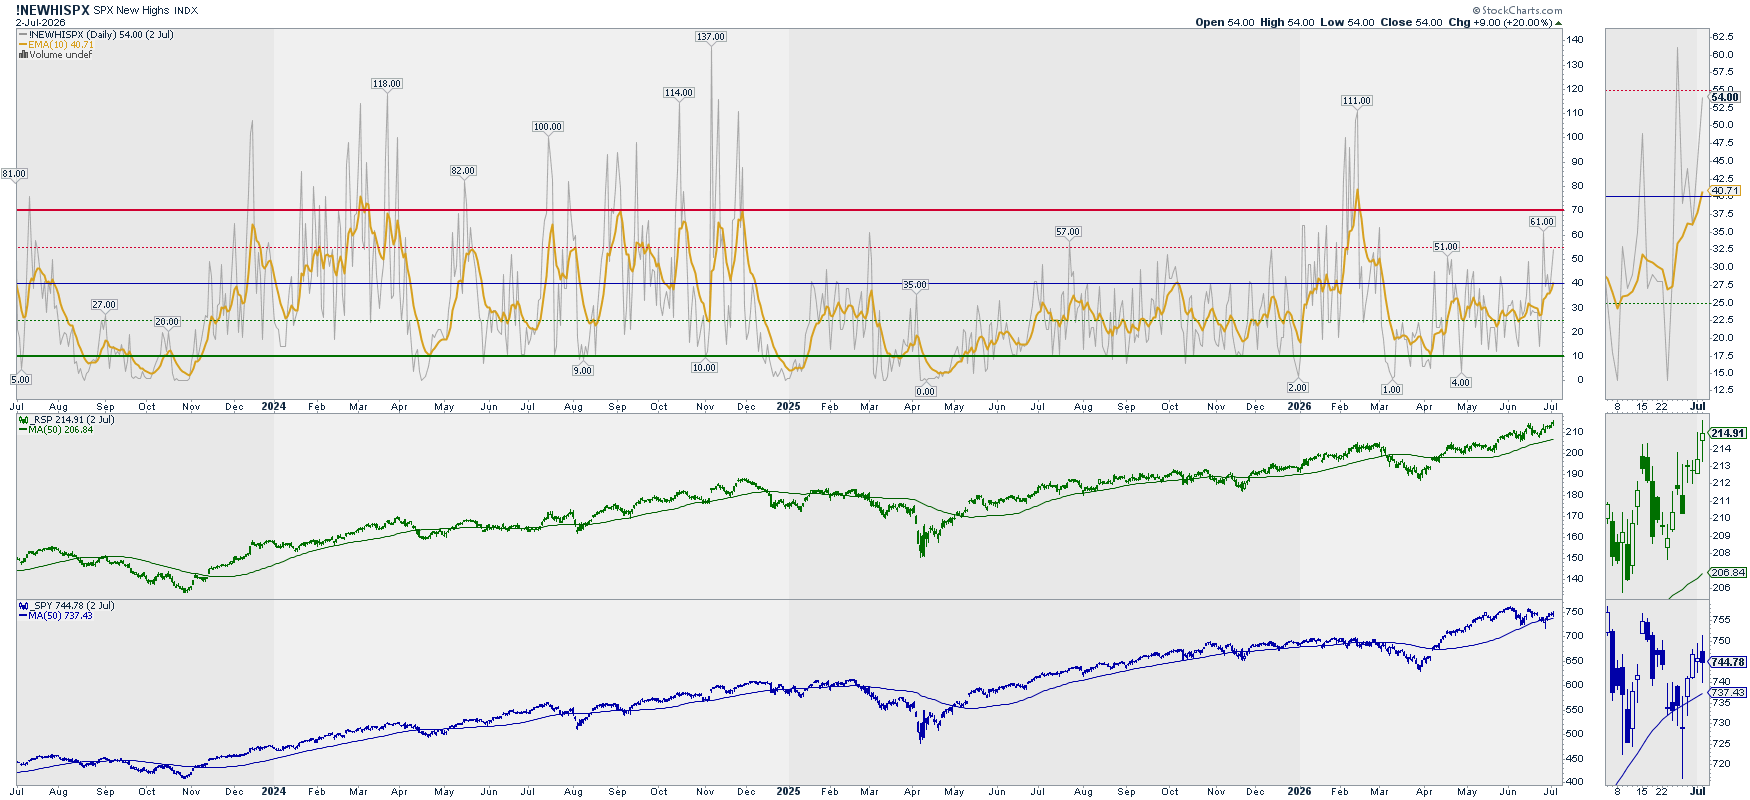
Analysis: Last week’s local top impacted only SPY. RSP continues its bullish rally. The new highs signal is a bullish trend with still room to rally.
Current Situation: Bullish
Future Outlook: Bullish
Volatility: Ratio Low Vol. Stocks / SPY vs. RSP & SPY
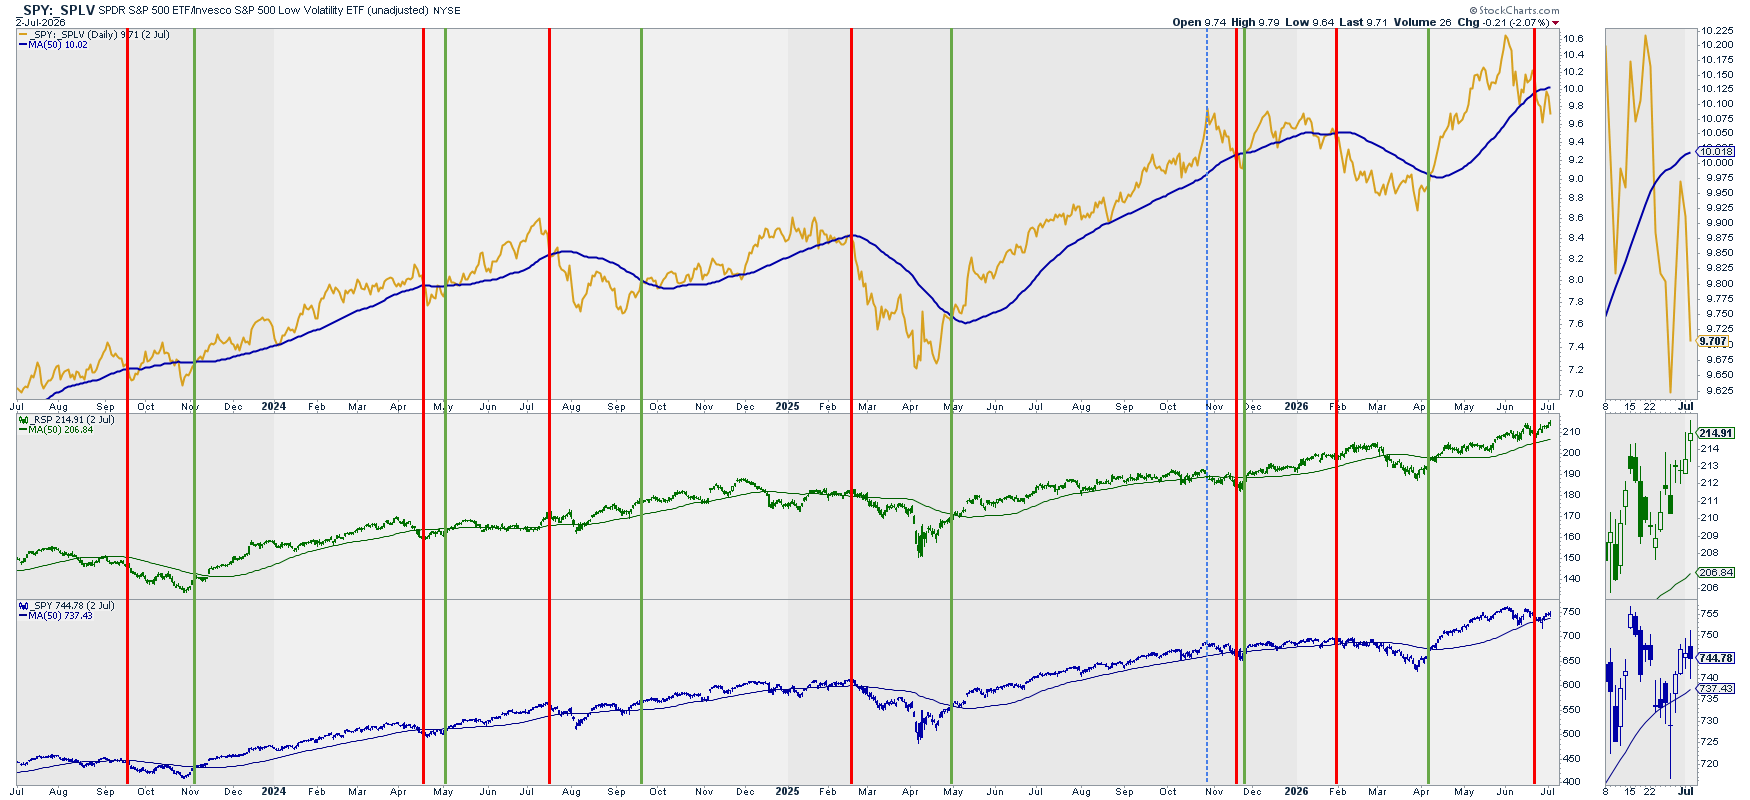
Analysis: This very reliable ratio have just triggered the bearish signal.
Current Situation: Bearish
Future Outlook: Bearish
Volatility: VIX vs. RSP & SPY
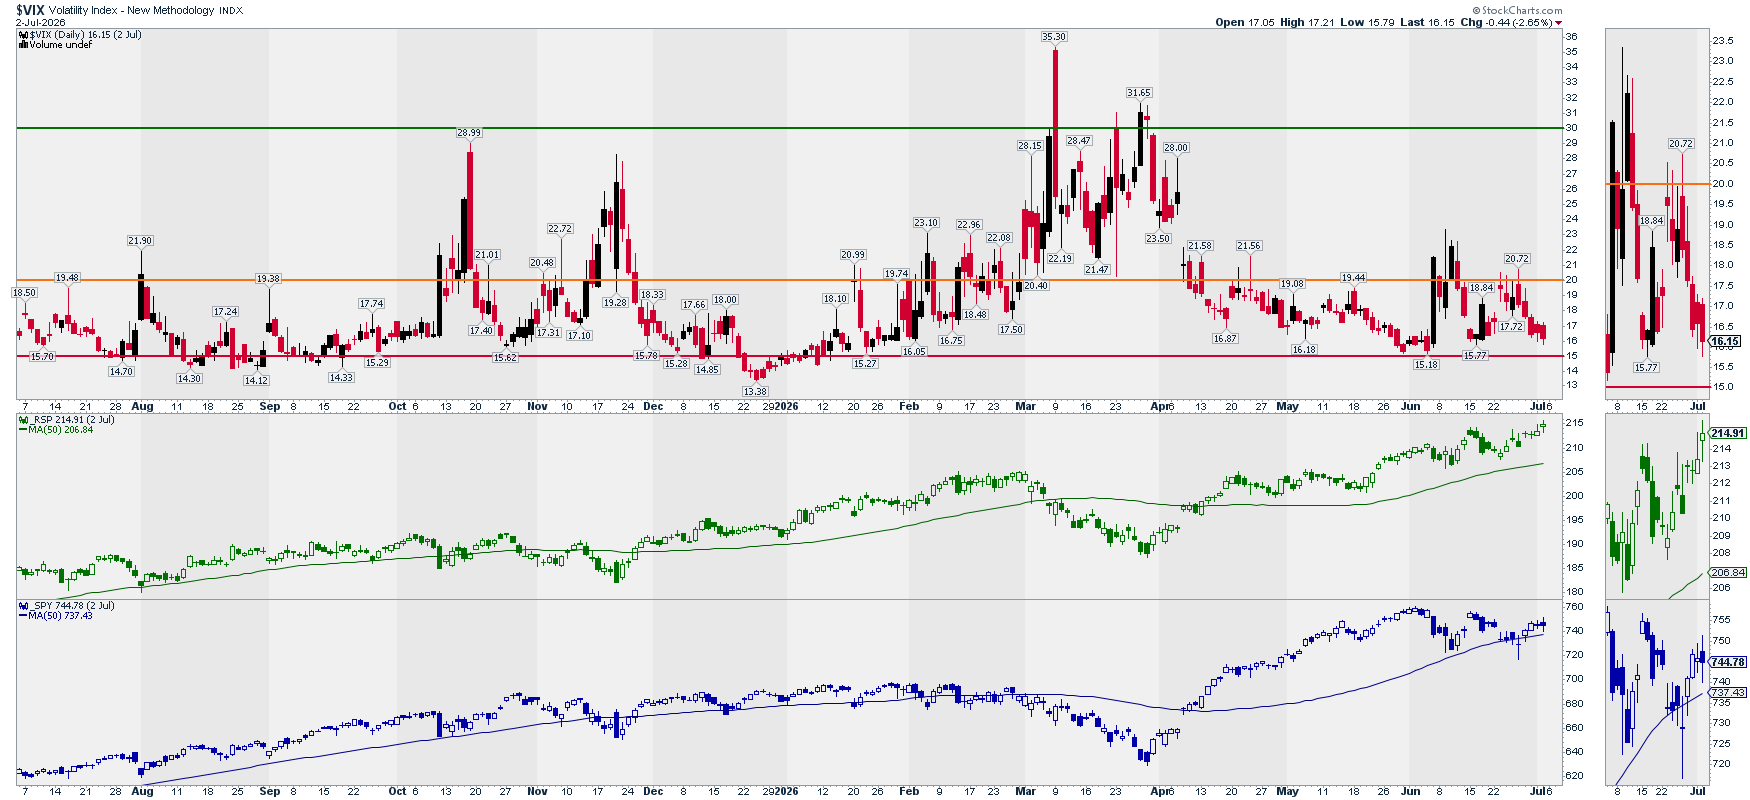
Note: This chart is mainly to detect market bottoms.
Analysis: VIX quickly drop from level 20.
Current Situation: Bullish
Future Outlook: Neutral
Options: (Inverted) Put/Call Ratio vs. SPY
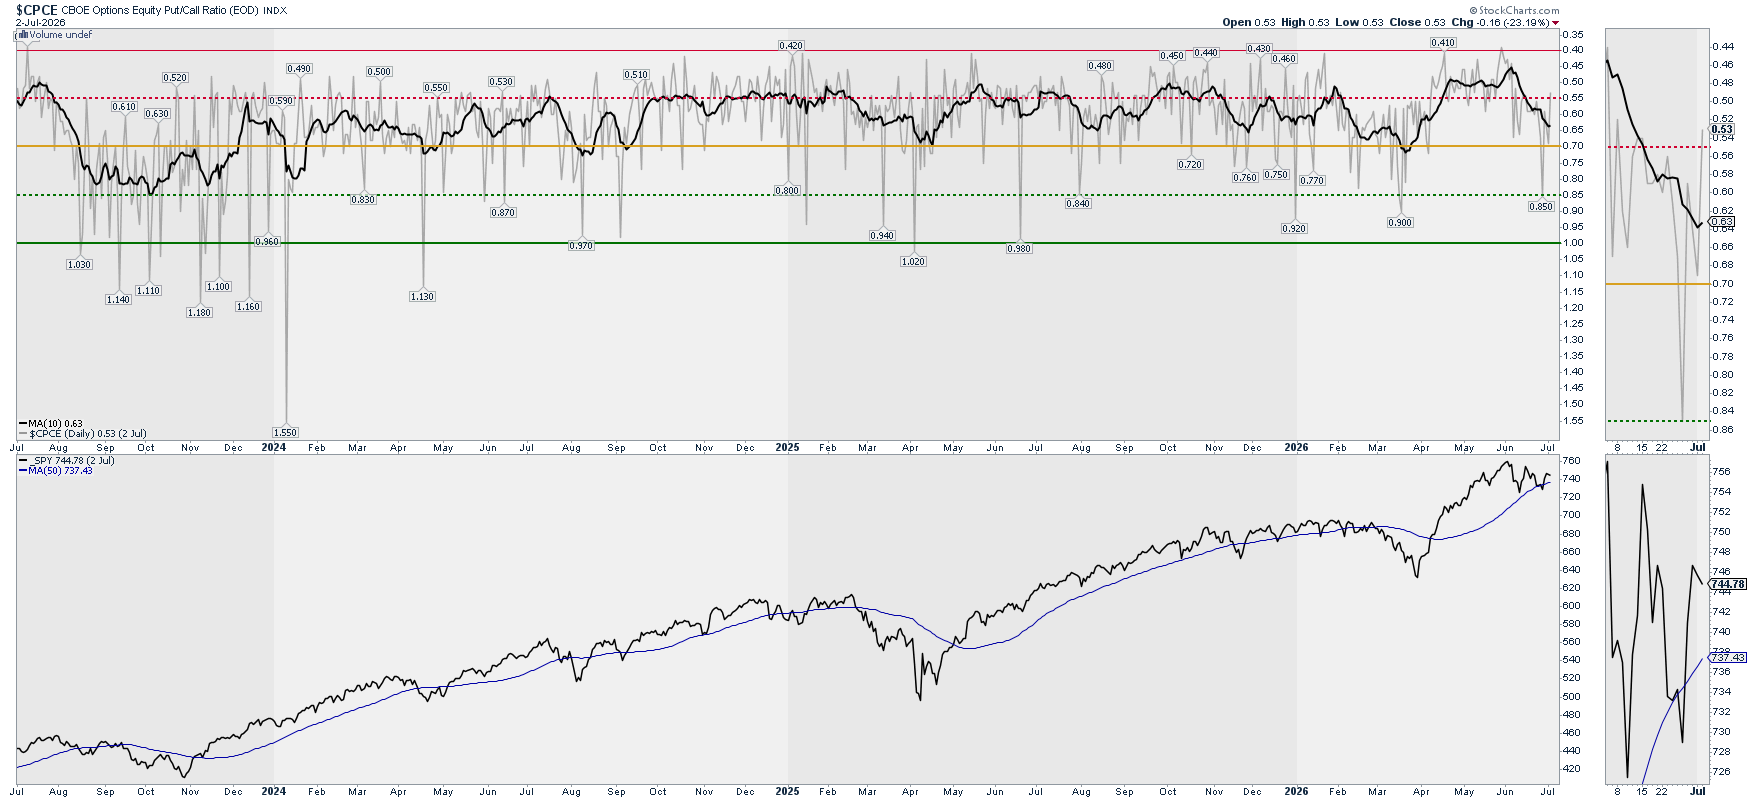
Analysis: Low spot reading (gray) which will push lower the signal (black) line, and the market with it.
Current Situation: Bearish
Future Outlook: Bearish
Options: Gamma Exposure – SPY
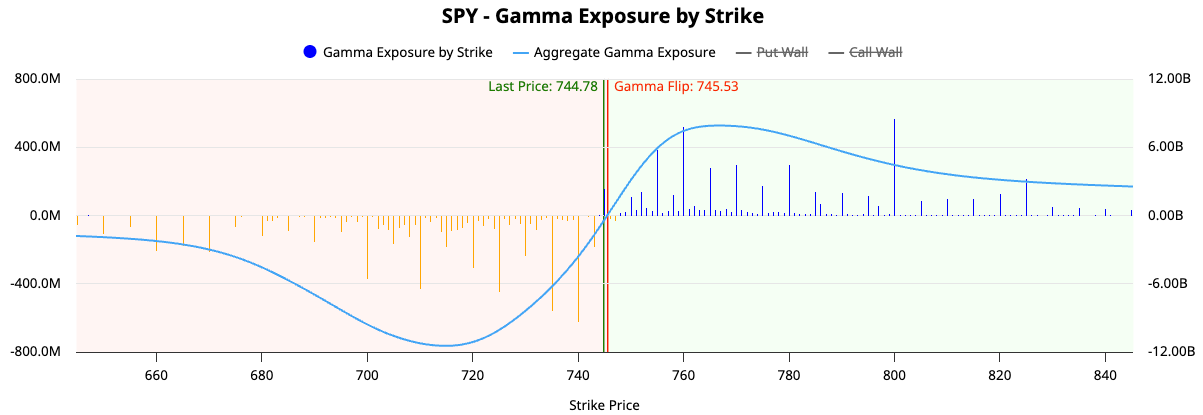
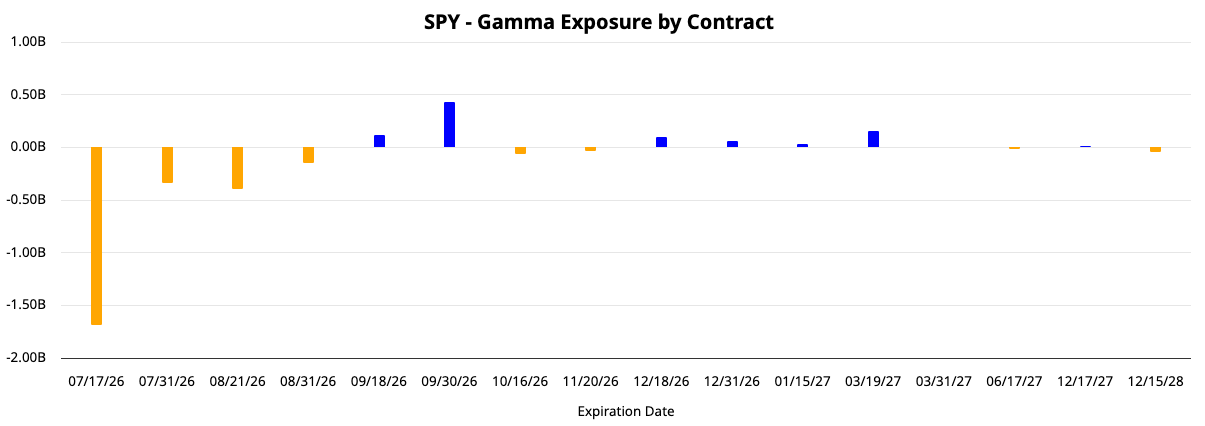
Analysis: Open interest GEX is negative with the last support at 720. July the 17th has the most negative GEX accumulation.
Current Situation: Bearish
Future Outlook: Bearish
Level 2: What is happening? Summary
Price Action: Bearish/Bearish
Breadth: Bullish/Bullish
Volatility: Bullish/Bearish
Options: Bearish/Bearish
Level 3: Where is it happening?
Bulls vs. Bears: RSP vs. RSPD (Cons. Disc. – Bulls) and RSPS (Cons. Sta. – Bears)
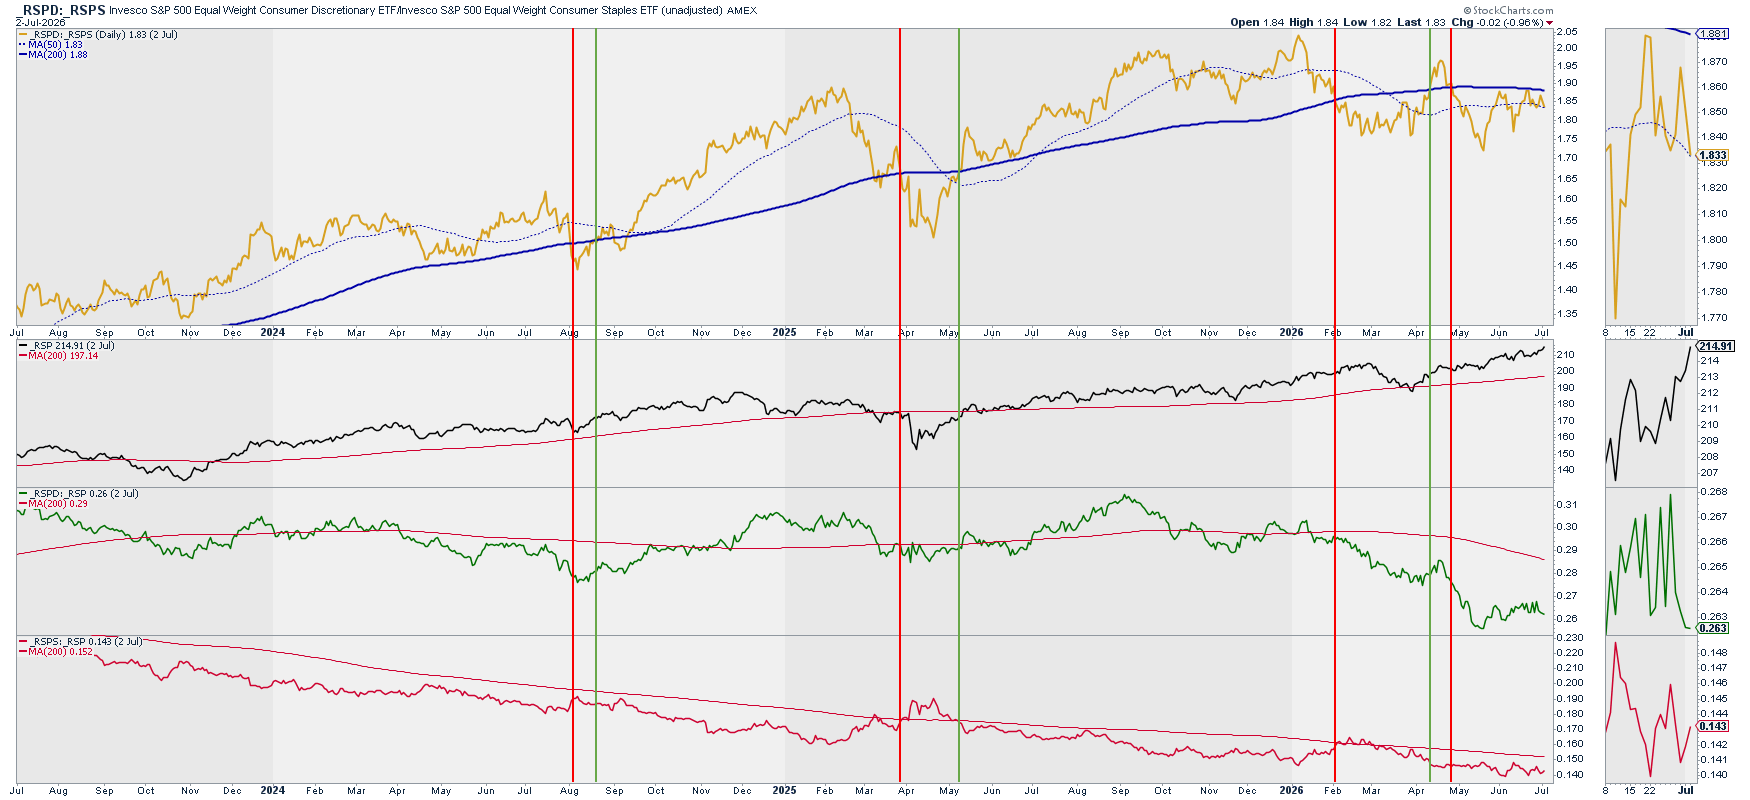
Analysis: Ratio (yellow) failed to break above the 200D SMA and also broke below the 50D SMA.
Current Situation: Bearish
Future Outlook: Bearish
Sectors Rotation
Sectors Performance
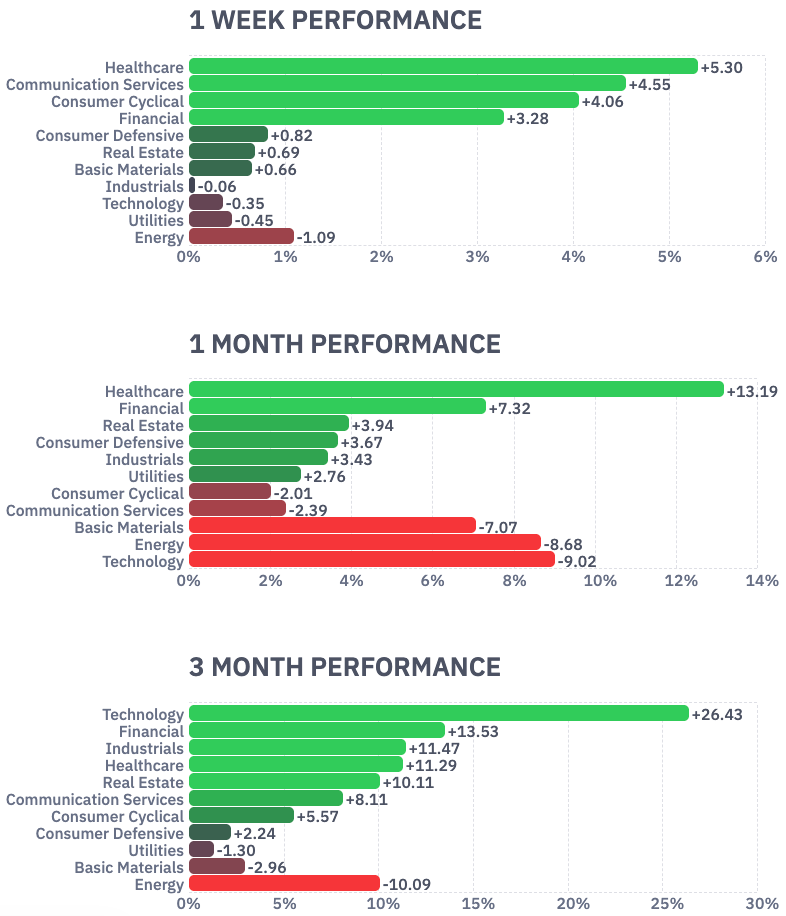

Healthcare (XLV) has been this week’s star and is about to break out of a long-term high. Industrials (XLI) continue with the bullish trend. Energy (XLE) is feeling the pain from the Iran war ceasefire. Both Communications (XLC) and Technology (XLK) are dragging the main indexes down.
Transportation (XTN) is breaking to ATH. Old time technicians used this sector to tell the overall health of the economy. Is still a good indicator in the digital era? We’ll see…
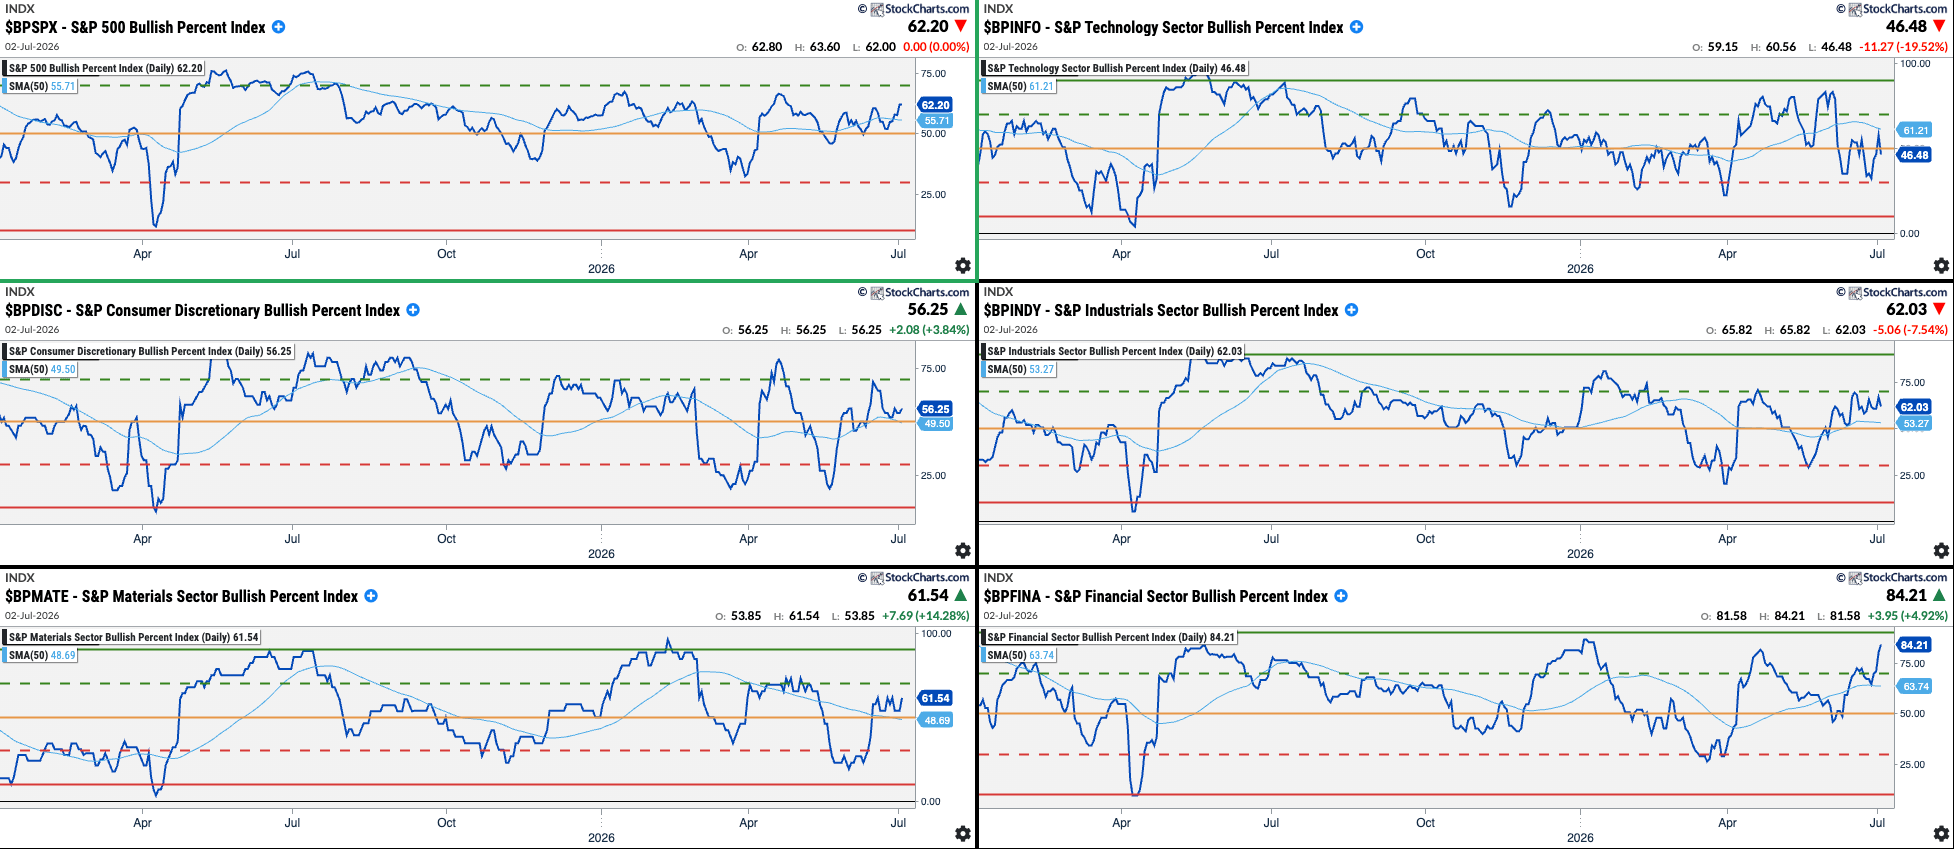
Sectors Bullish Percent Index
Growth Sectors
Value Sectors
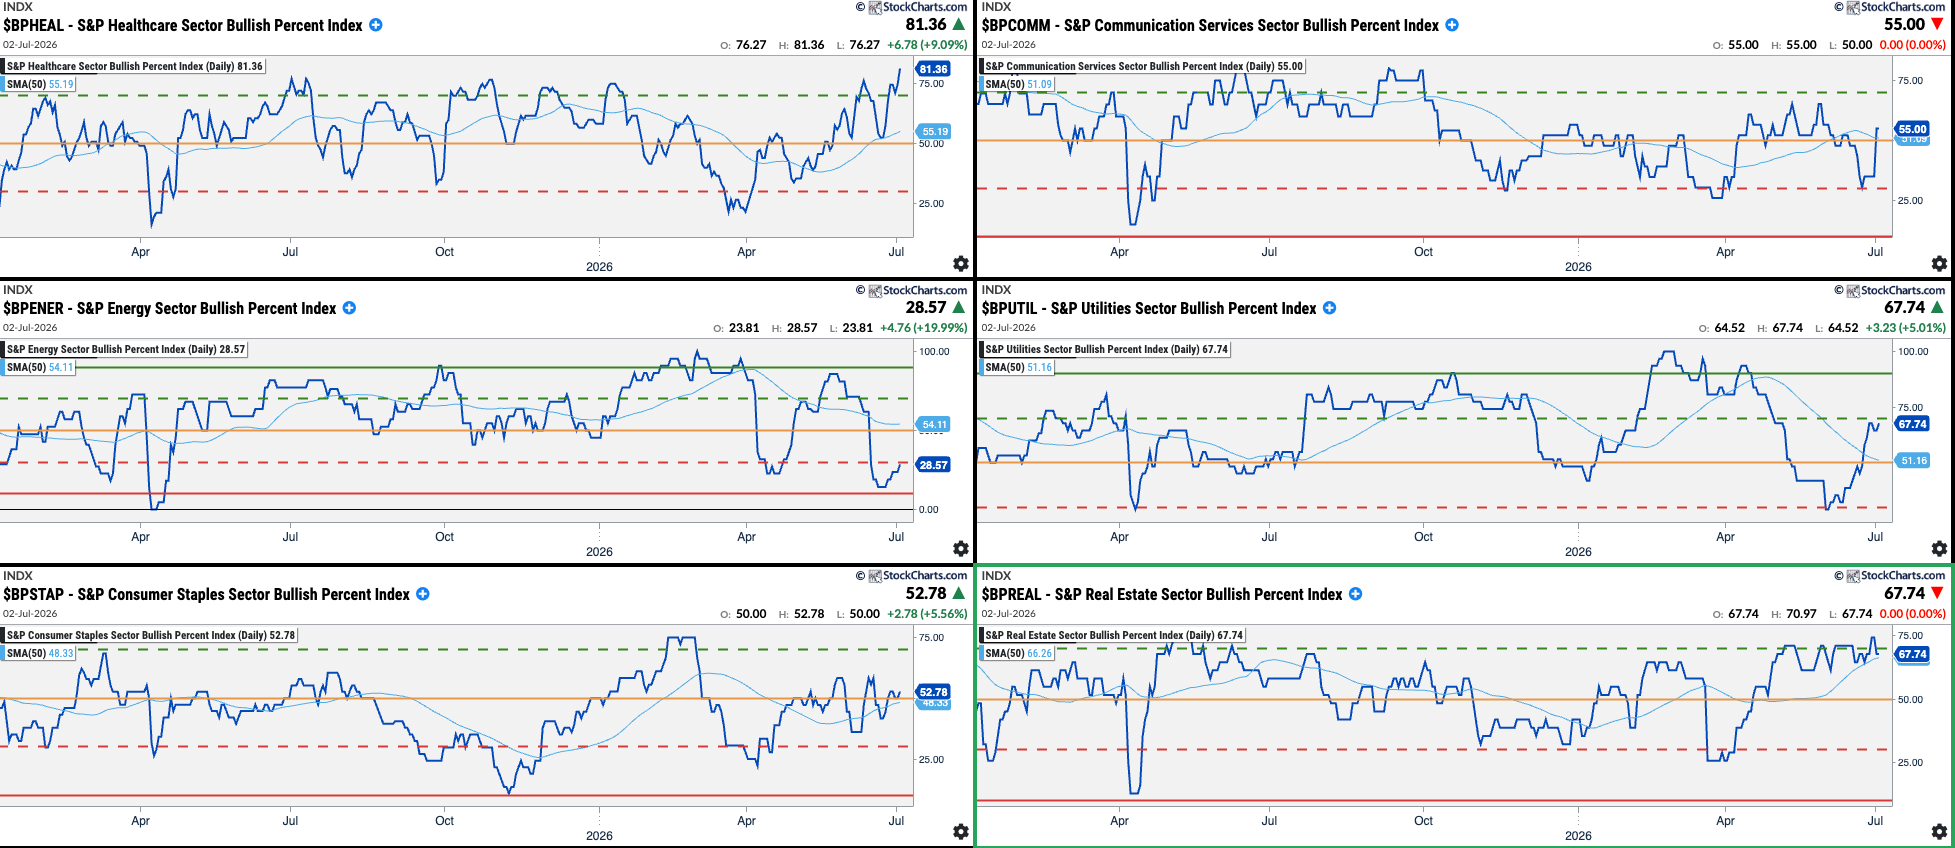
Note: Any sectors below their red levels are good opportunities to find great companies at good valuations or buy sector ETFs (buy cheap). Those sectors above their Green levels are candidates to be sold (sell expensive).
Current Situation: Bullish - & - Future Outlook: Bullish:
Industrials, Materials, Financials, Utilities
Current Situation: Bullish - & - Future Outlook: Bearish:
Healthcare, C. Disc., Real Estate
Current Situation: Bearish - & - Future Outlook: Bullish:
C.Staples, Energy
Current Situation: Bearish - & - Future Outlook: Bearish:
Technology, Communications
SPX has a Neutral Current Situation and a Neutral Future Outlook.
Level 3: Where is it happening? Summary
Bulls vs. Bears: Bearish
All Levels Summary and Final Thoughts
Level 1 Summary - The Why
Economic Data: Bullish/Bullish
Interest Rates: Bearish/Neutral
Investors Sentiment: Bearish/Bearish
Level 2 Summary - The What
Price Action: Bearish/Bearish
Breadth: Bullish/Bullish
Volatility: Bullish/Bearish
Options: Bearish/Bearish
Level 3 Summary - The Where
Bulls vs. Bears: Bearish
Level 4: Scanning for opportunities
Great Companies with Great Technicals
Descriptive
Index: Any | Market Cap.: +Mid (+$2B) | Option/Short: Yes/Yes
Avg. Volume: >1M | Relative Vol.: Over 1 | Price: >$10
Fundamental
EPS Growth Next Year: >15% | EPS Growth Past 3 Years: >5% | Sales Growth Past 3 Years: >5%
- Sorted by P/E
Technical
Performance: Quarter Up | Price above 20D SMA & 50D SMA | Beta: >1 | ATR: > 1

S&P500 and Nasdaq New Highs
Descriptive
Index: S&P 500 and Nasdaq | Market Cap.: +Mid (+$2B) | Option/Short: Yes/Yes
Avg. Volume: >1M | Price: >$10
(order by Market Cap desc.)
Technical
50-Day New High
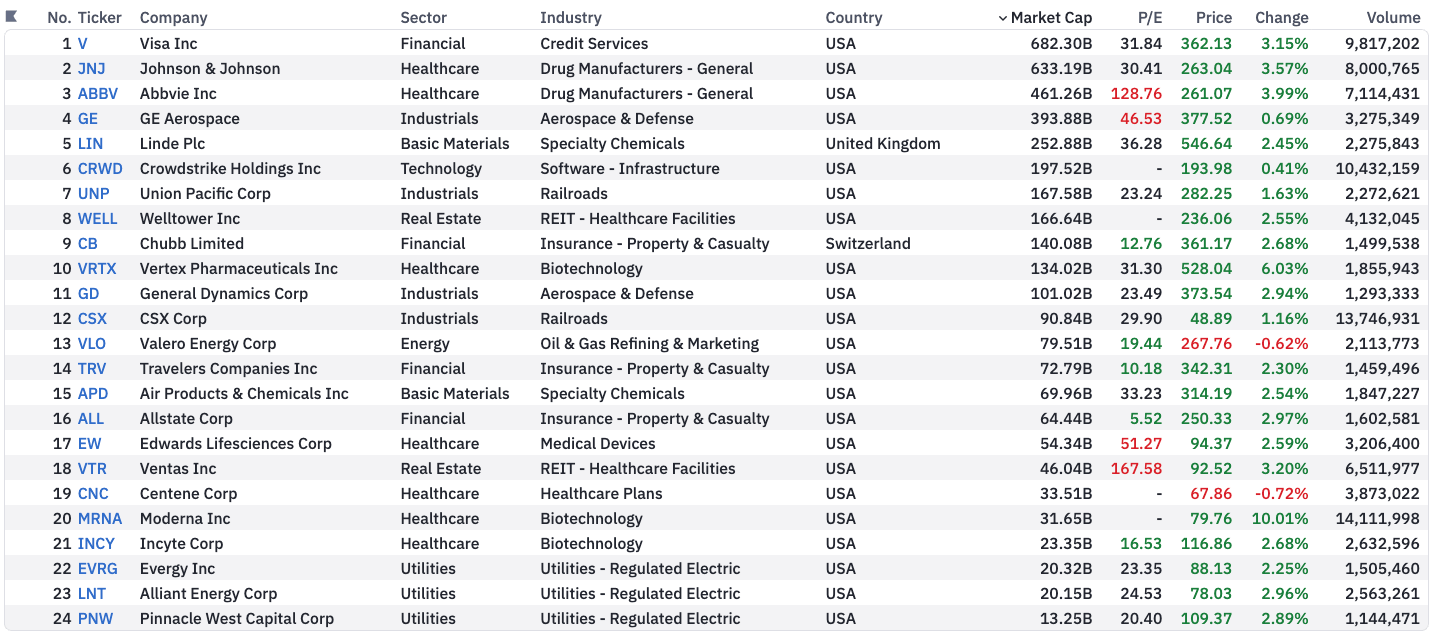
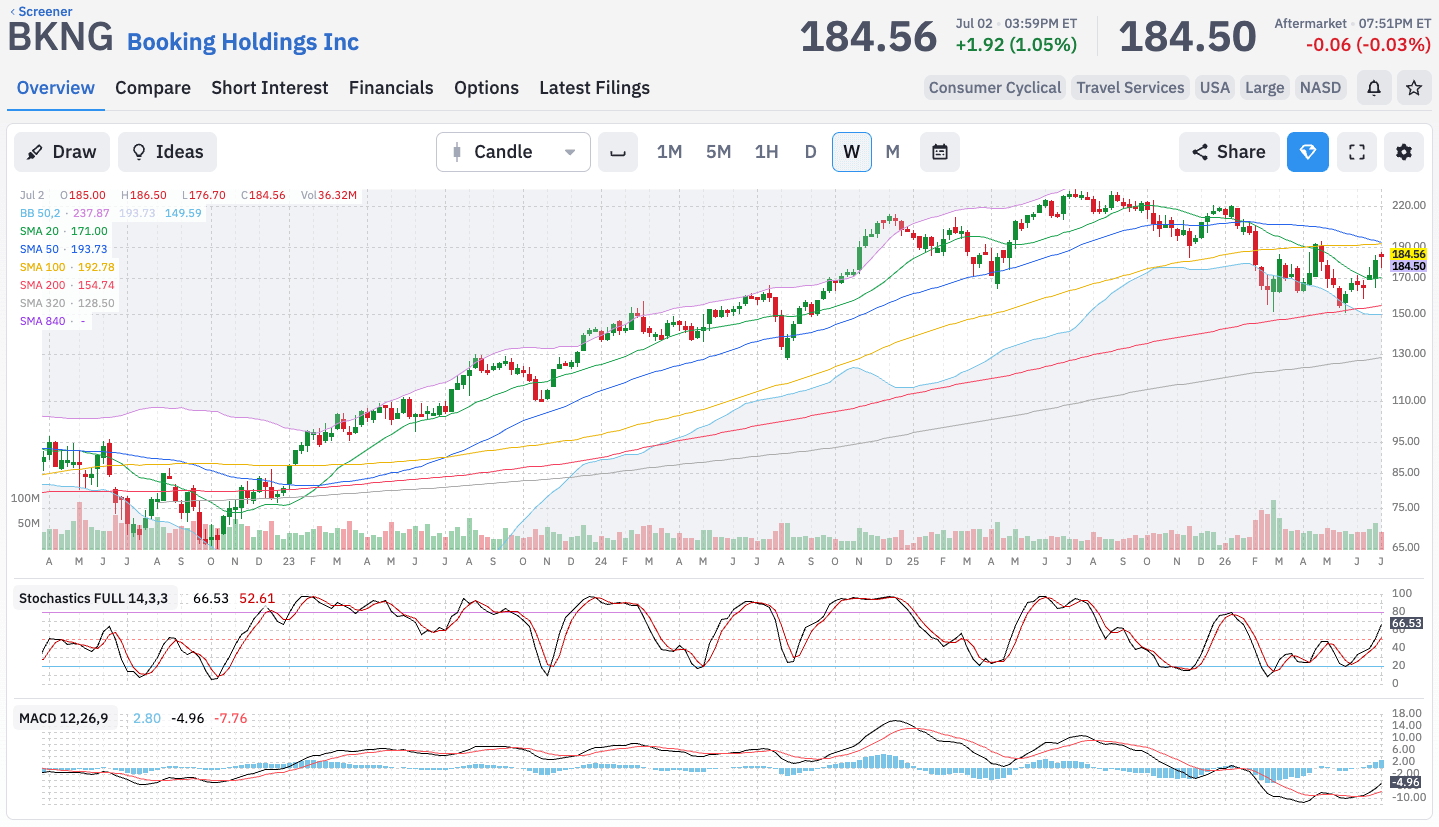
Chart of the week:
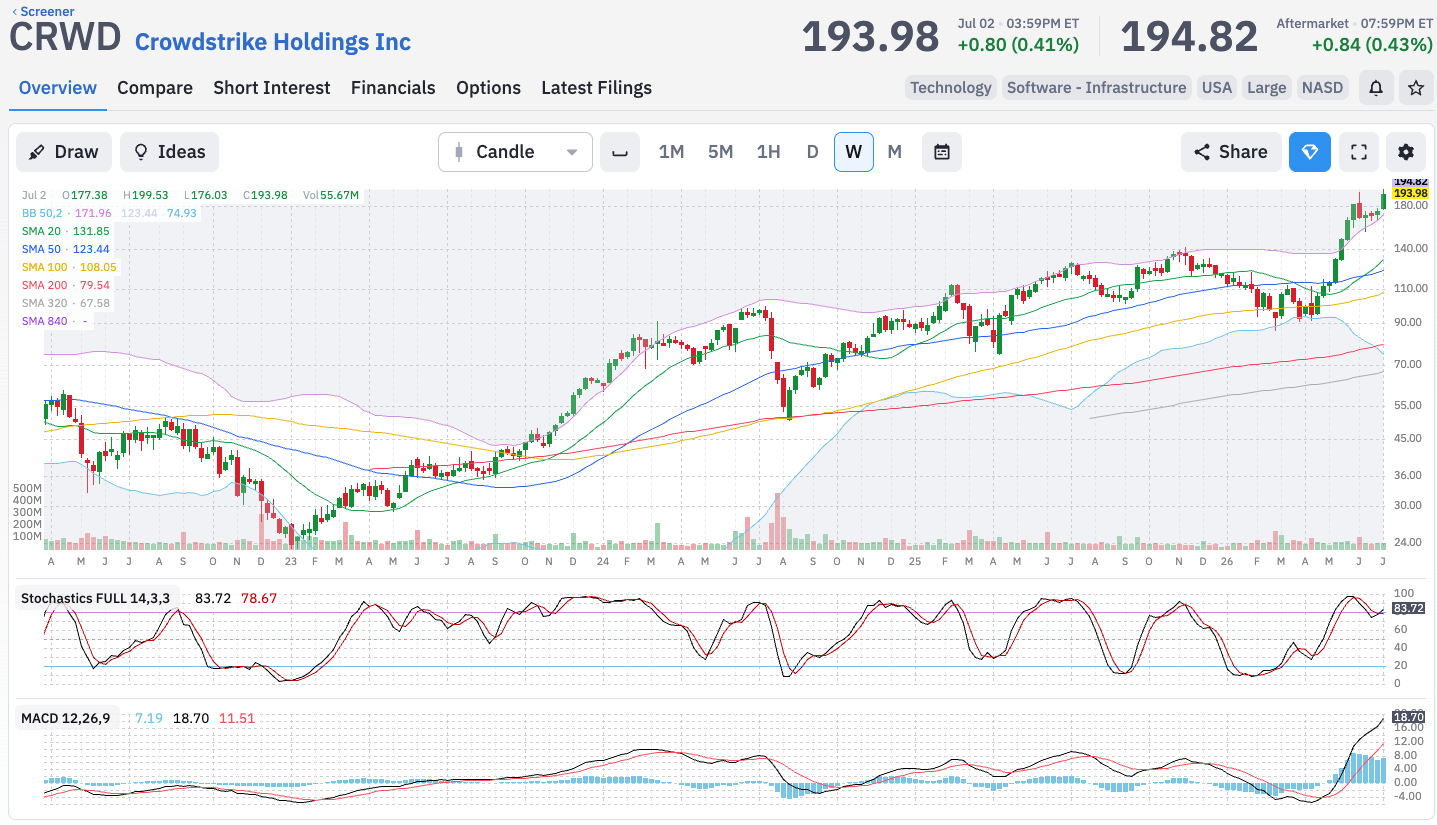
Crowdstrike for being a company that benefits from AI but is not an AI play. CRWD has a unique way to participate in the cyber security market with their innovative offering. CRWD is indeed an “world of tomorrow” portfolio (coming soon) stock.
Disclaimer: The content on AMAT Investing is strictly for educational and learning purposes. The author is not a licensed financial advisor and holds no formal financial education. This post does not constitute professional financial advice. All investing involves risk of loss. Always conduct your own research and consult a licensed professional before making any investment decisions.