

Weekly Review - 2026-Feb-27
How the market will reach to Iran's war?

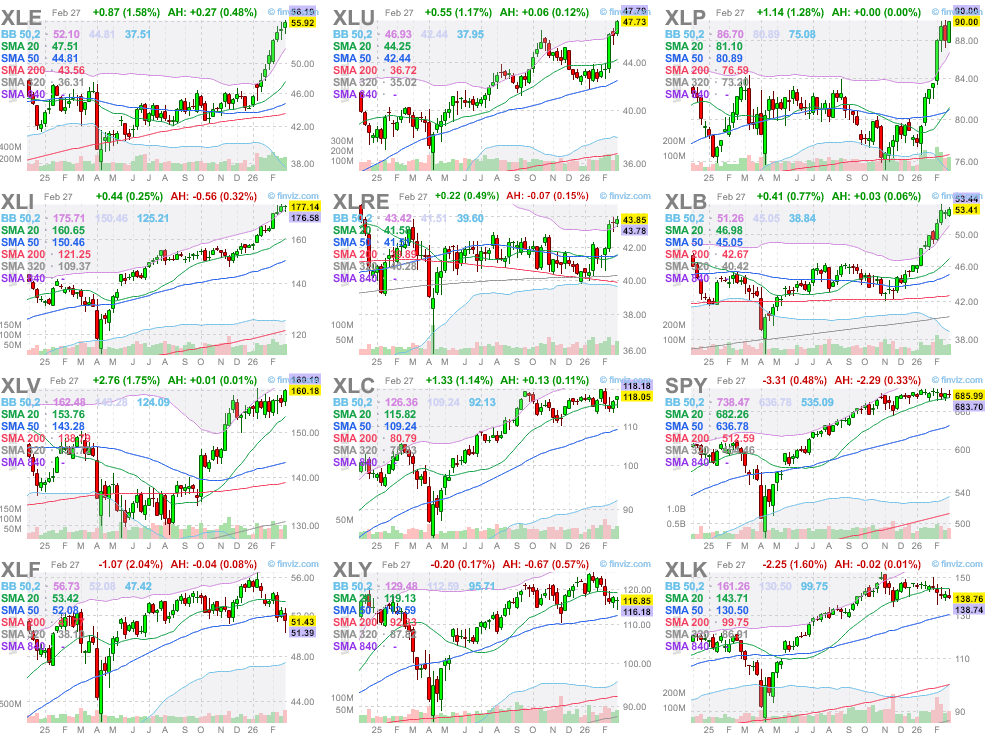
US Cap. Weighted Sectors ordered by monthly performance (desc):
Why is it happening? – Level 1
Economic Data: Production: ISM PMI vs. SPX
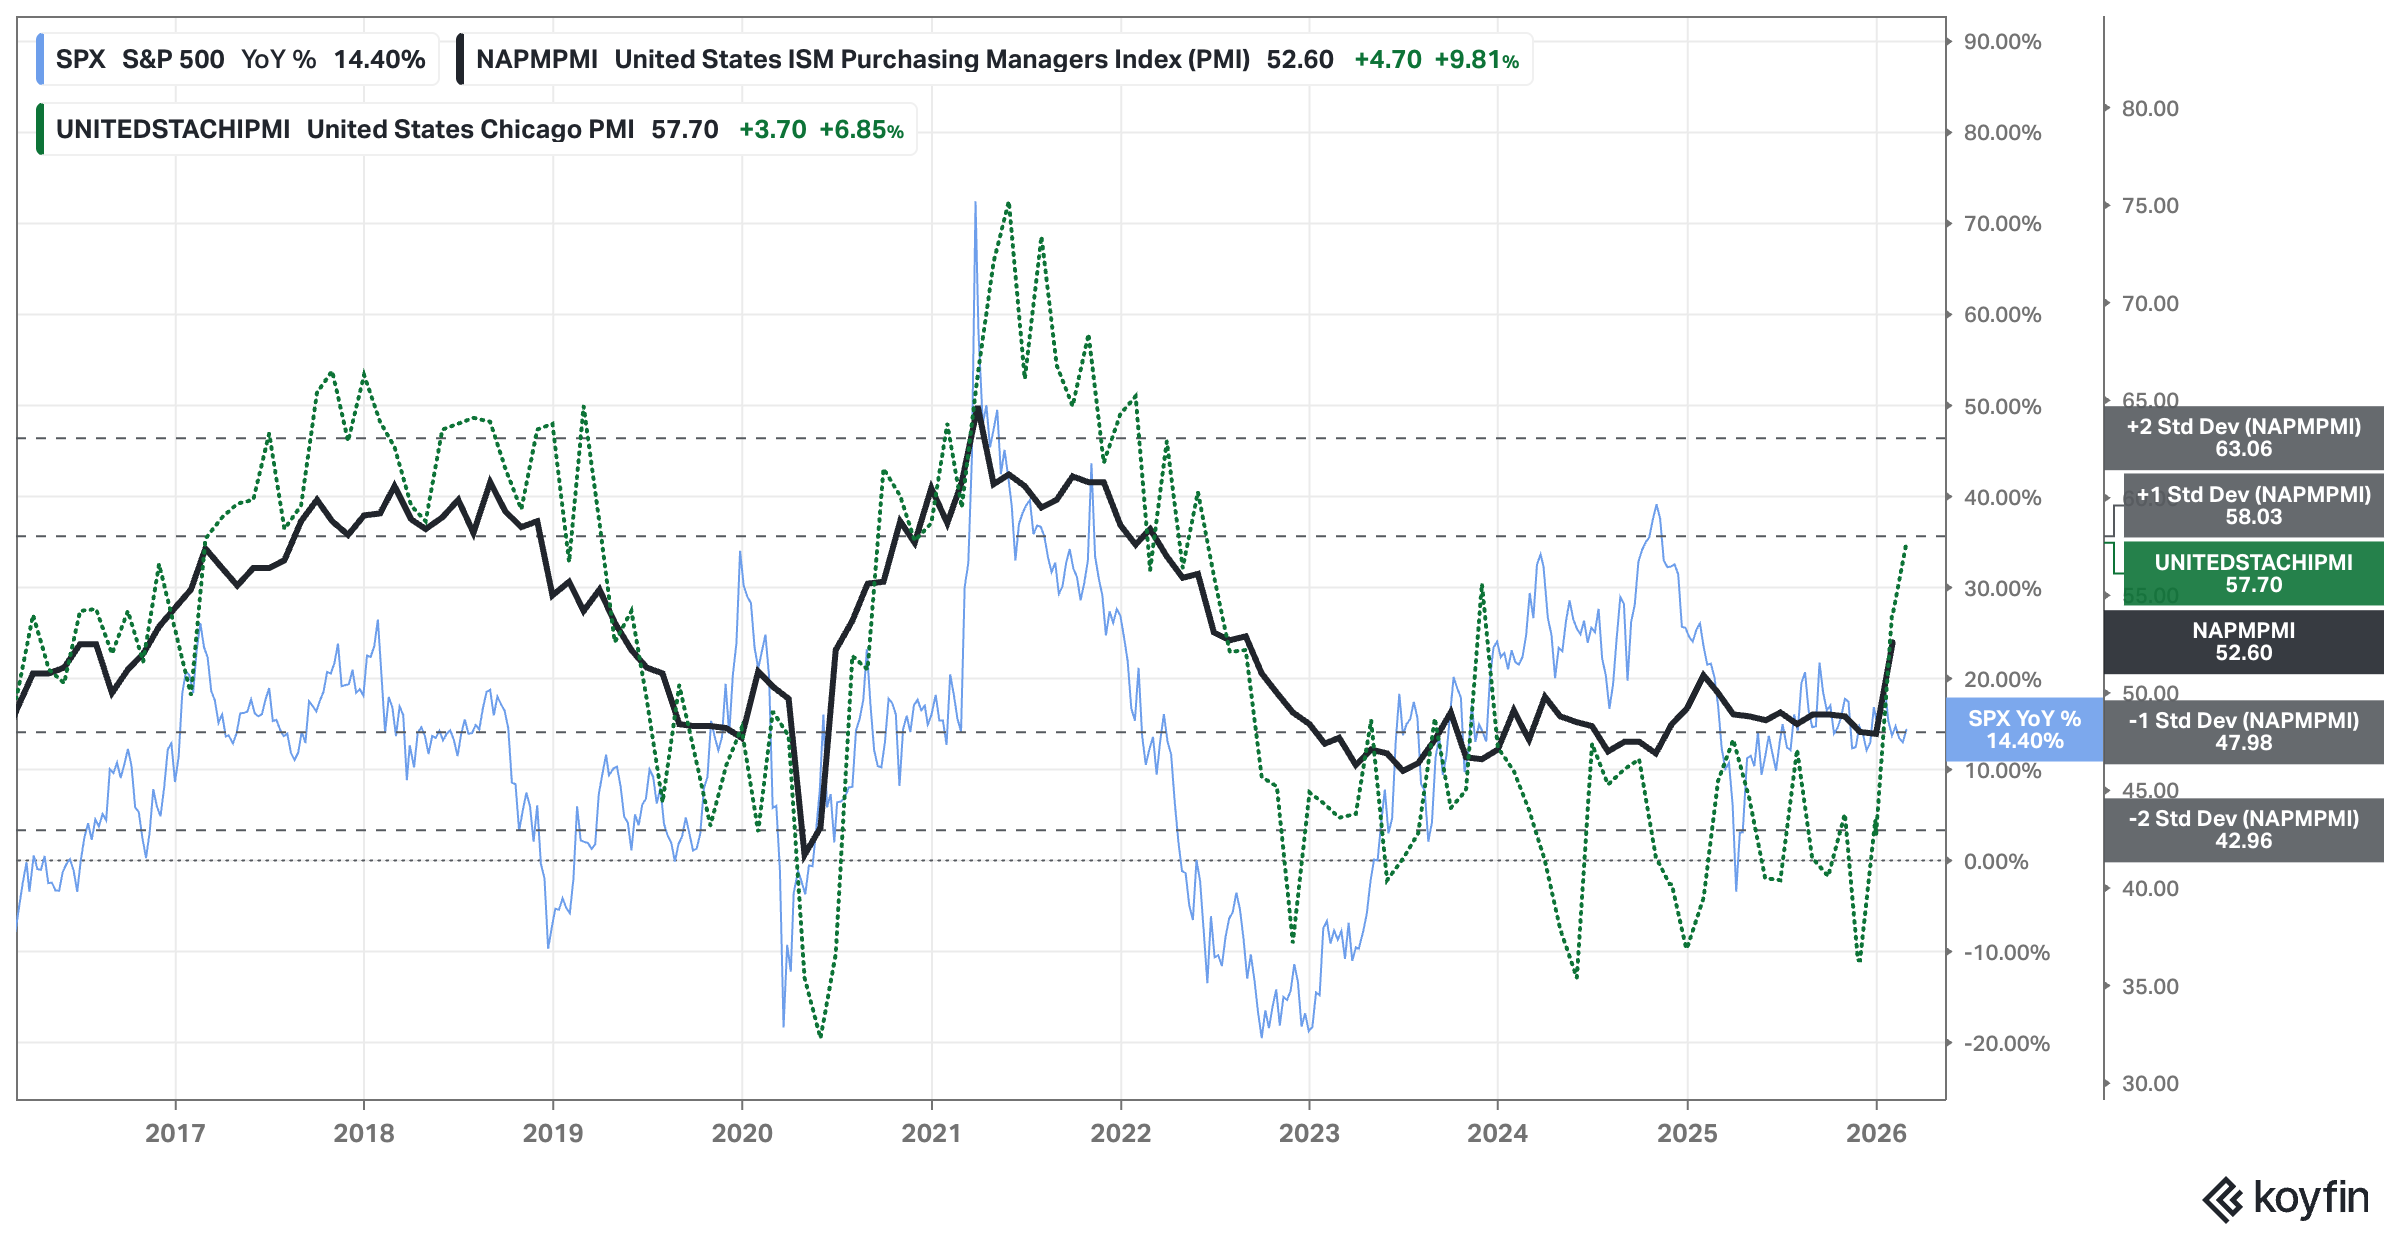
Analysis: Chicago PMI surprised on the upside.
Outlook: Bullish
Why is it happening? – Level 1
Economic Data: Production: Dallas & Philadelphia Manufacturing vs. SPX
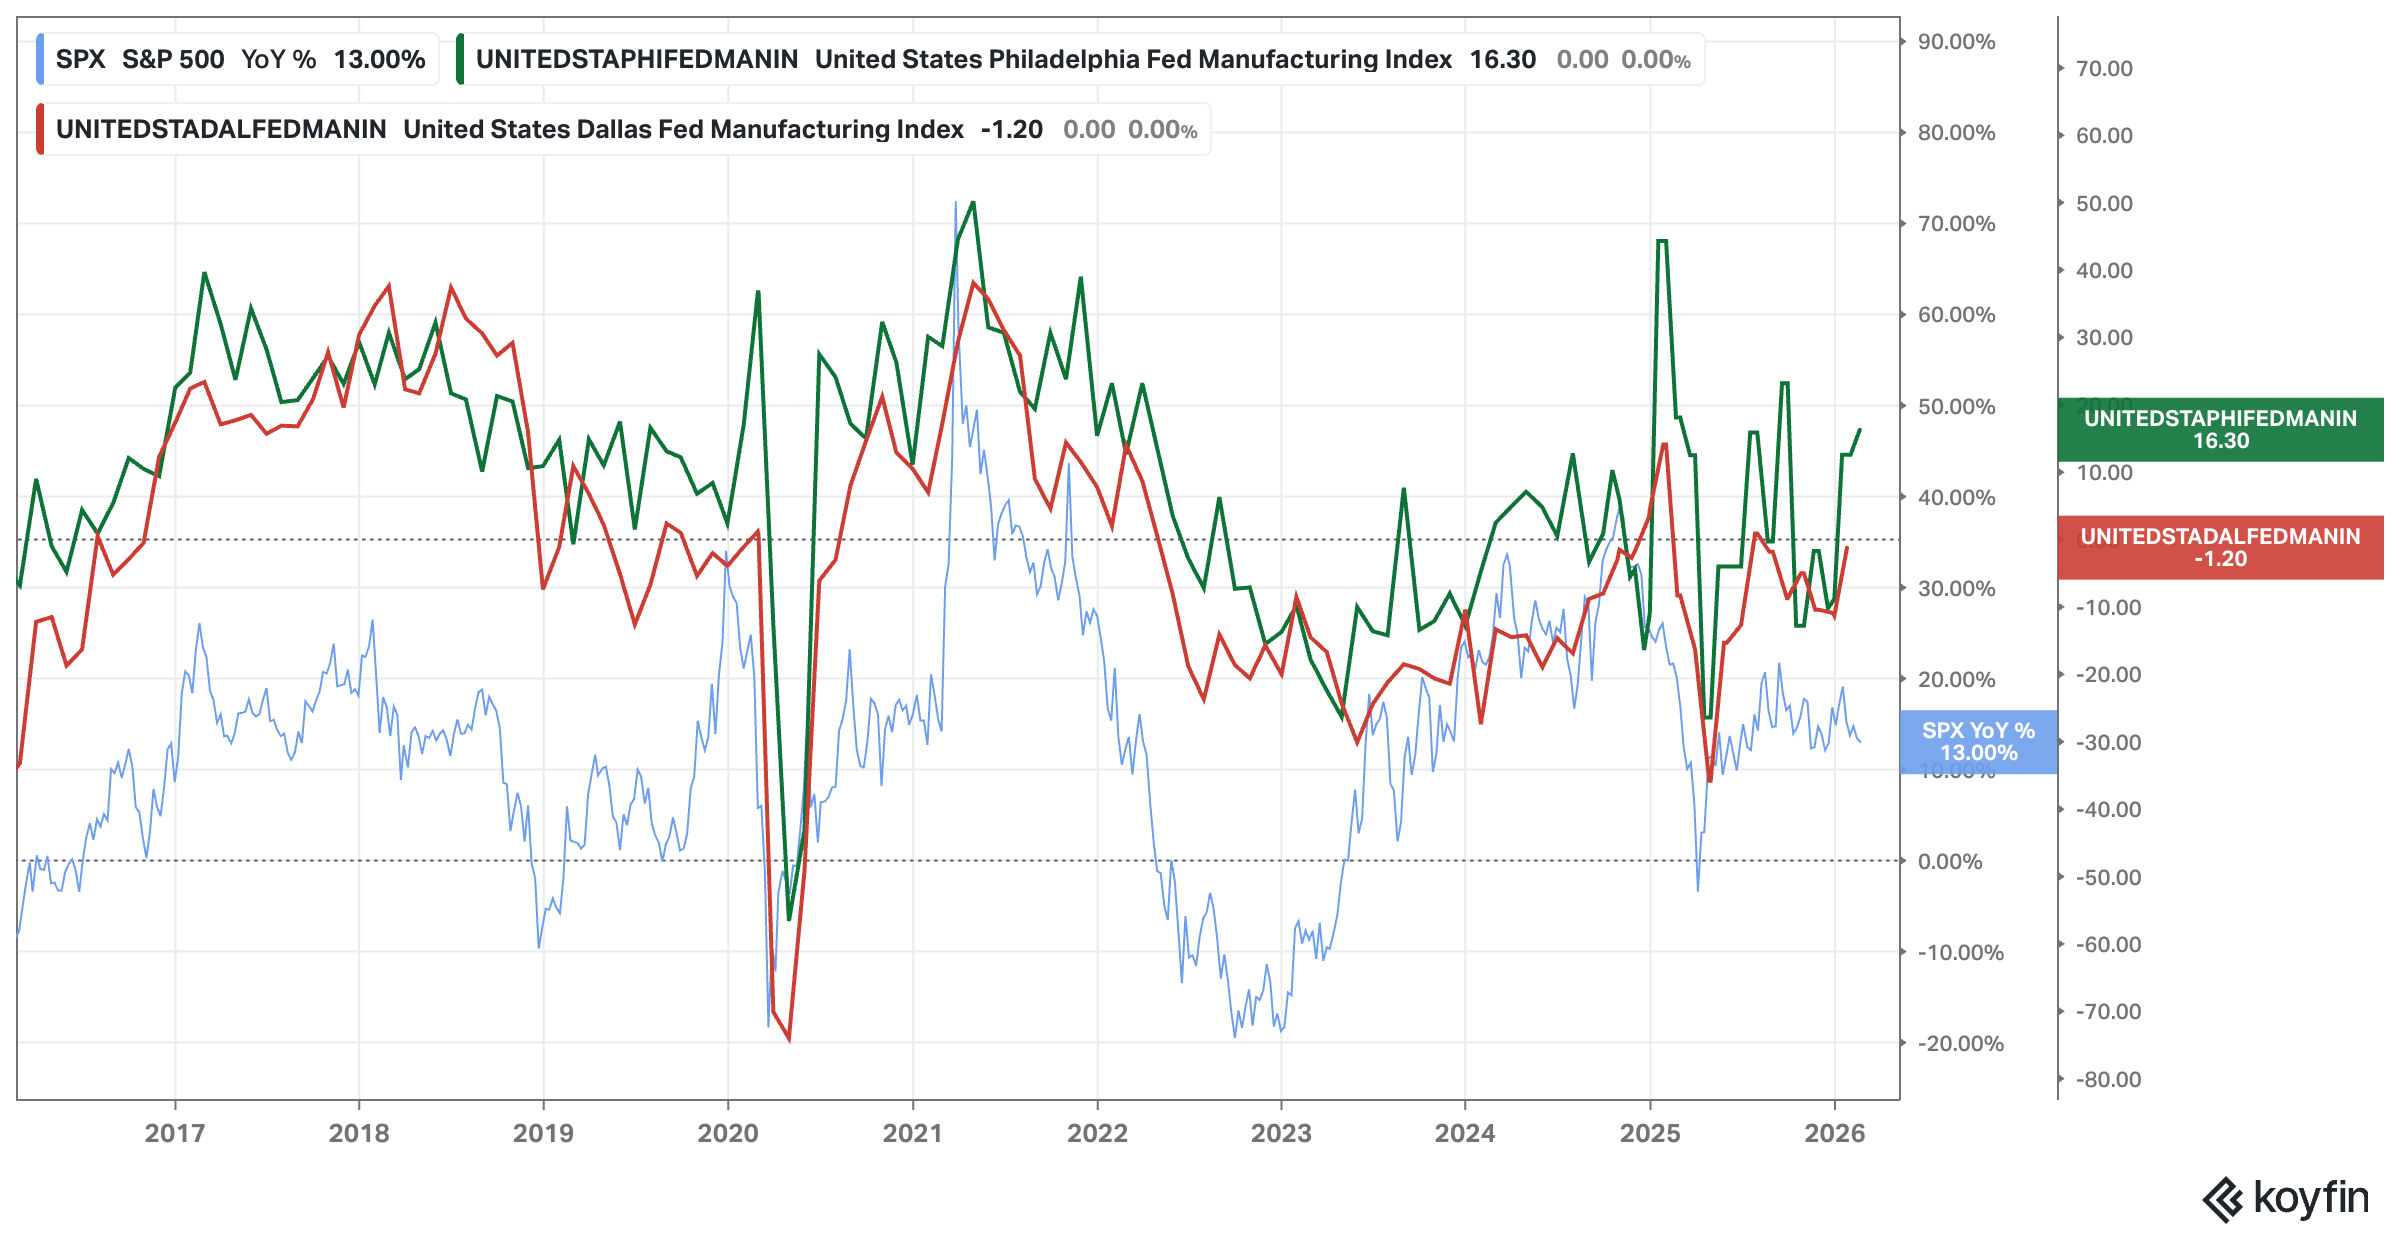
Analysis: No changes since last week. Philadelphia and Dallas improving.
Outlook: Bullish
Why is it happening? – Level 1
Economic Data: Consumption: Consumer Sentiment
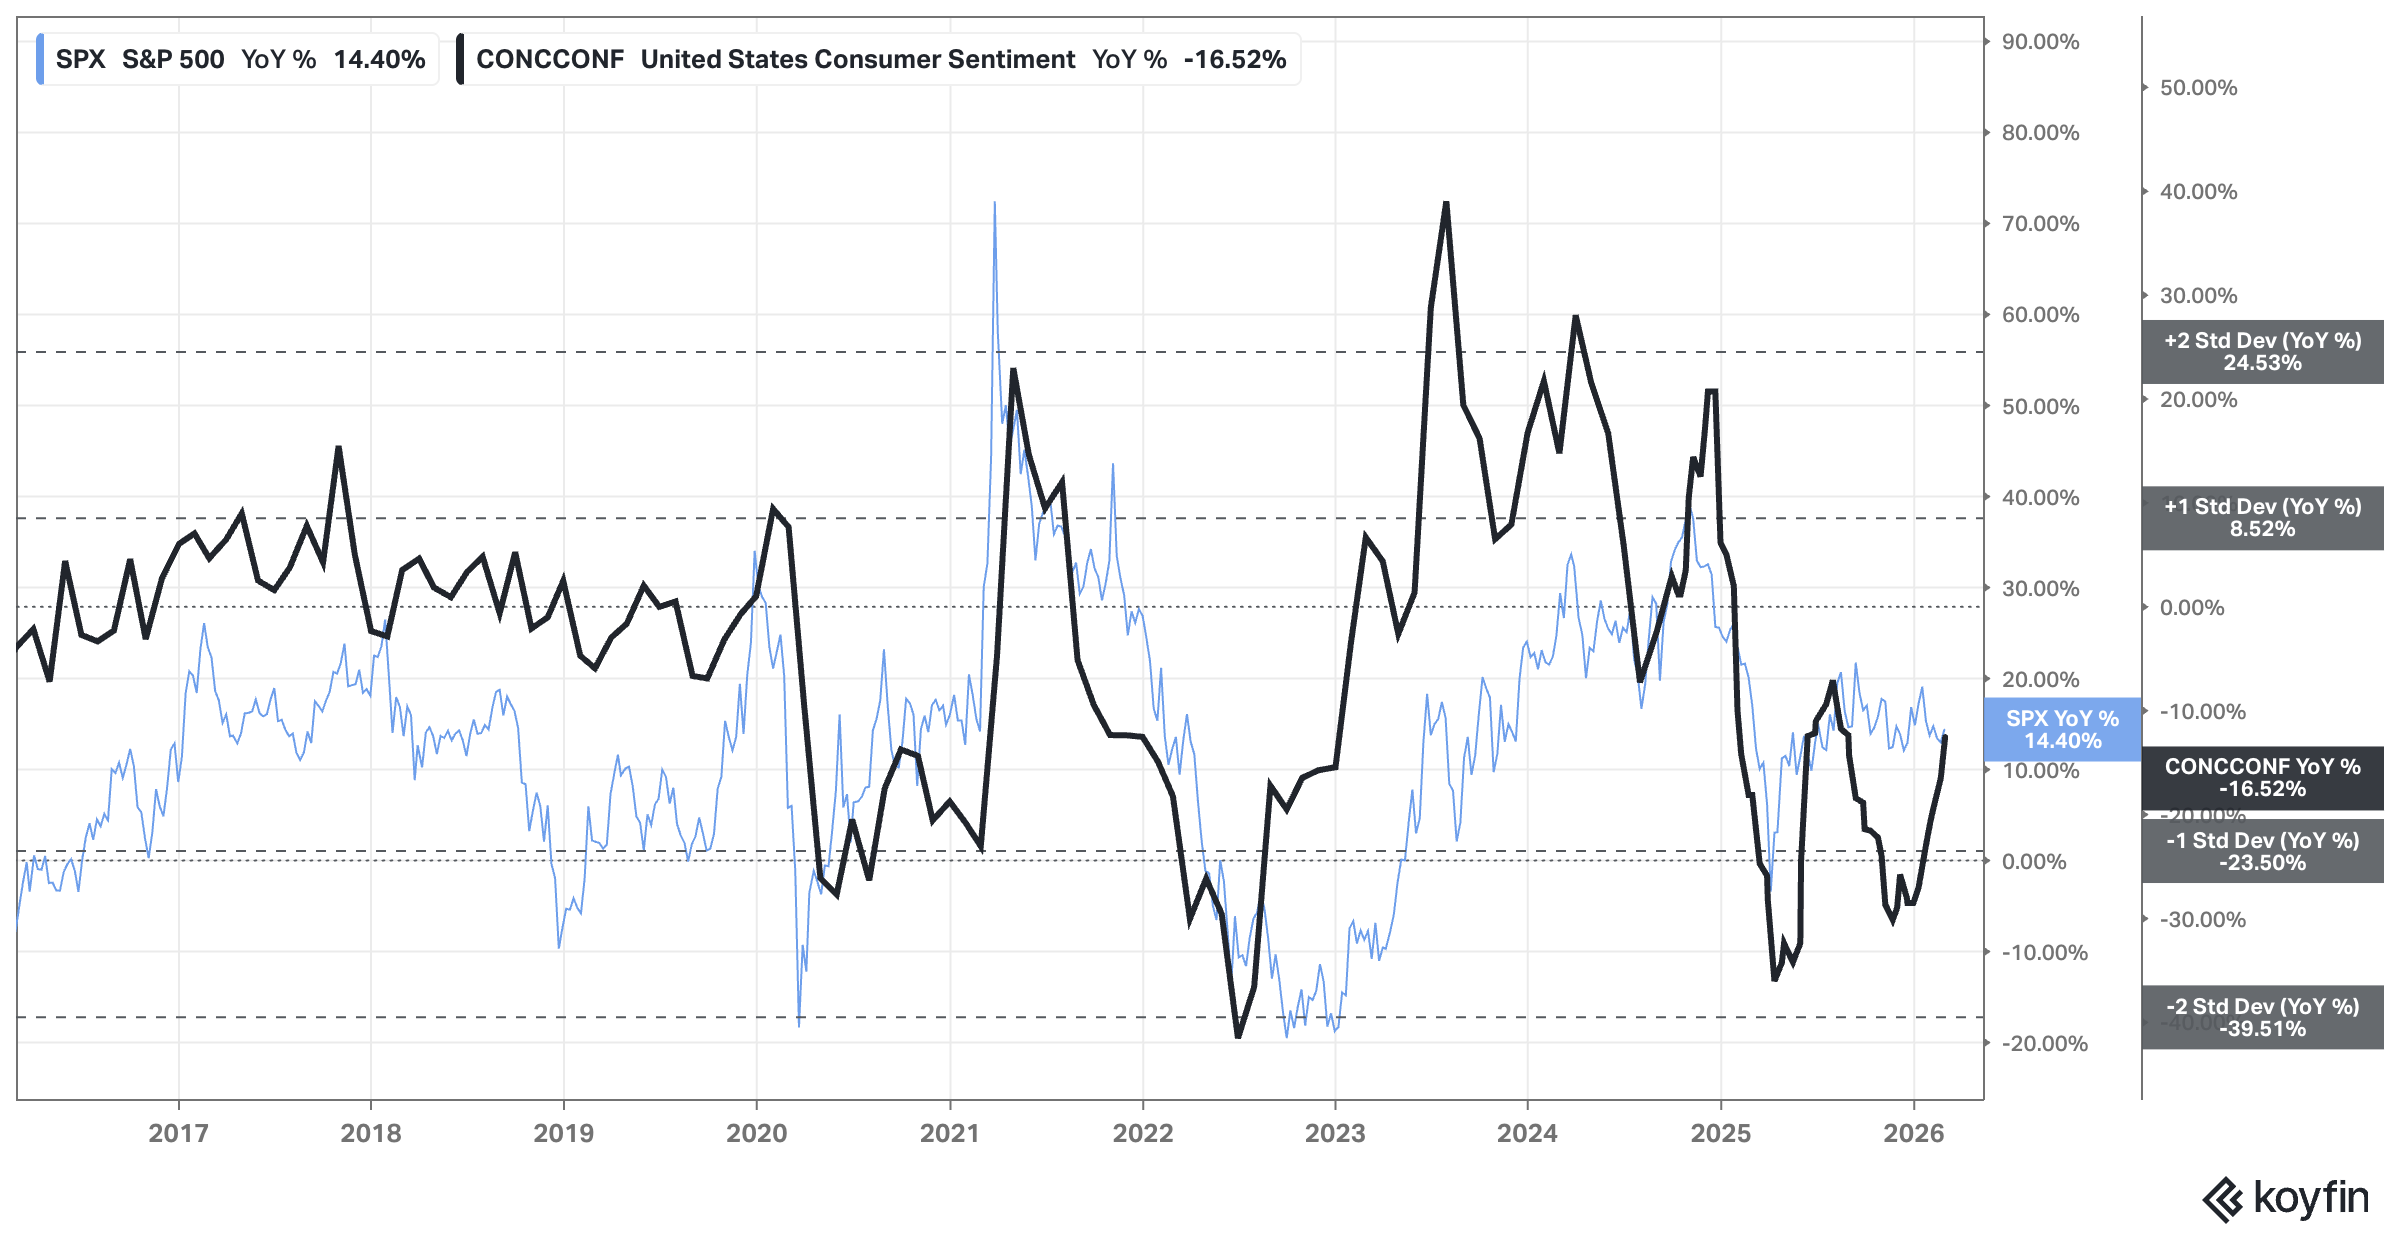
Analysis: Consumer confidence keeps improving.
Outlook: Bullish
Why is it happening? – Level 1
USD & Interest Rates: FED, 2yr, and 10yr Rates
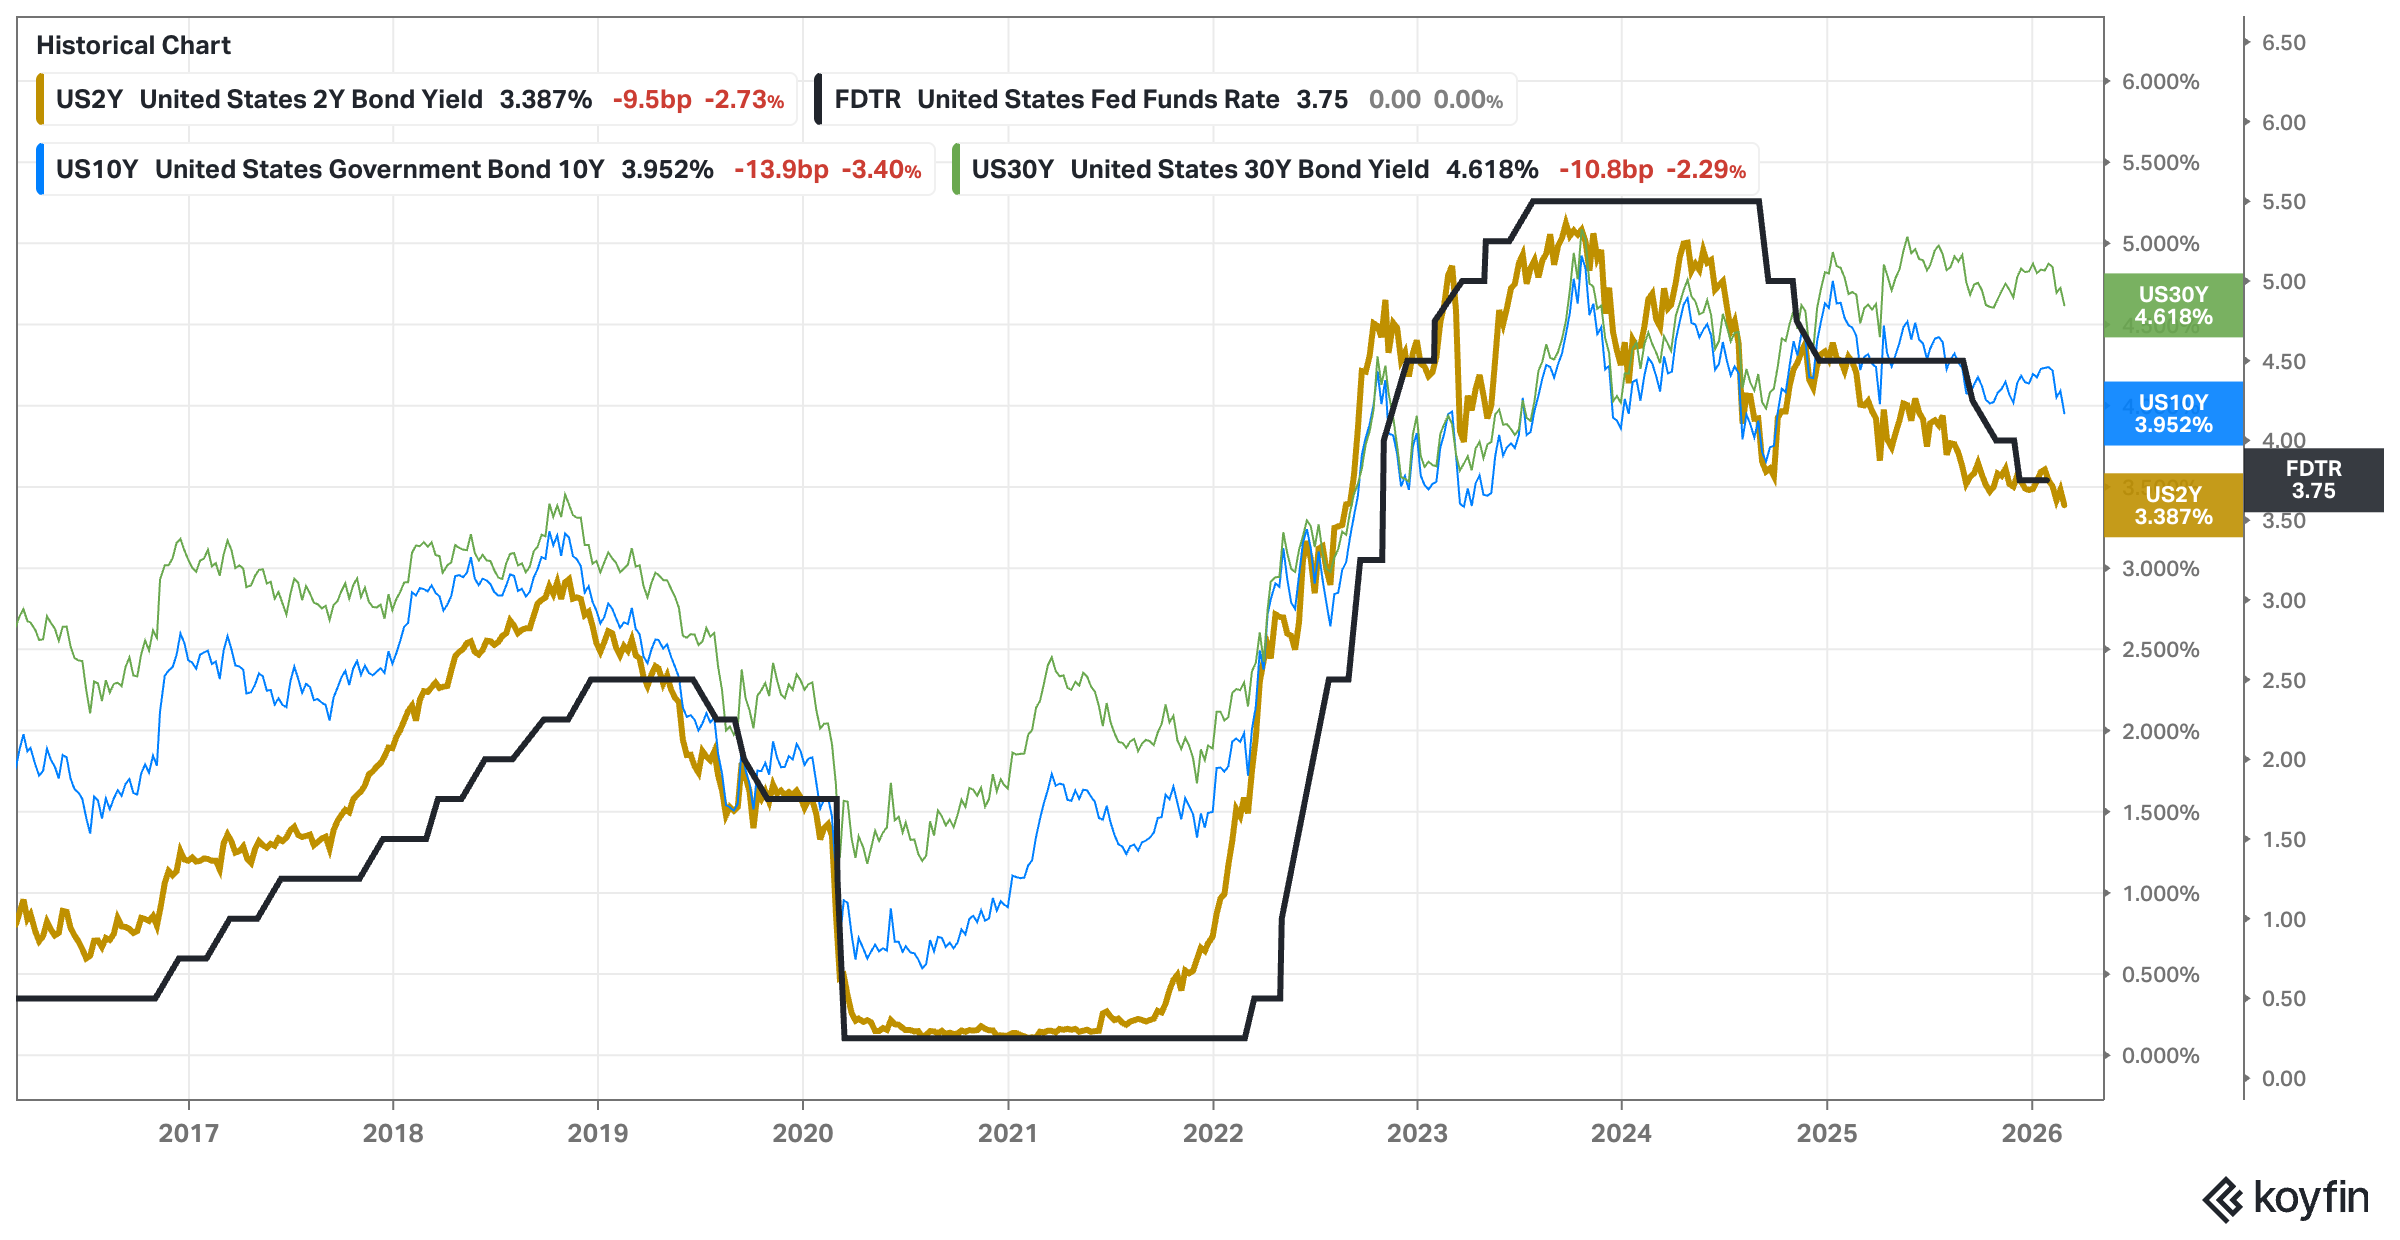
Analysis: Will the Fed continue lowering rates? Finally we see long-dated rates getting lower.
Outlook: Bullish for stocks (if rates continue going lower)
Why is it happening? – Level 1
USD & Interest Rates: USD vs EEM and S&P500
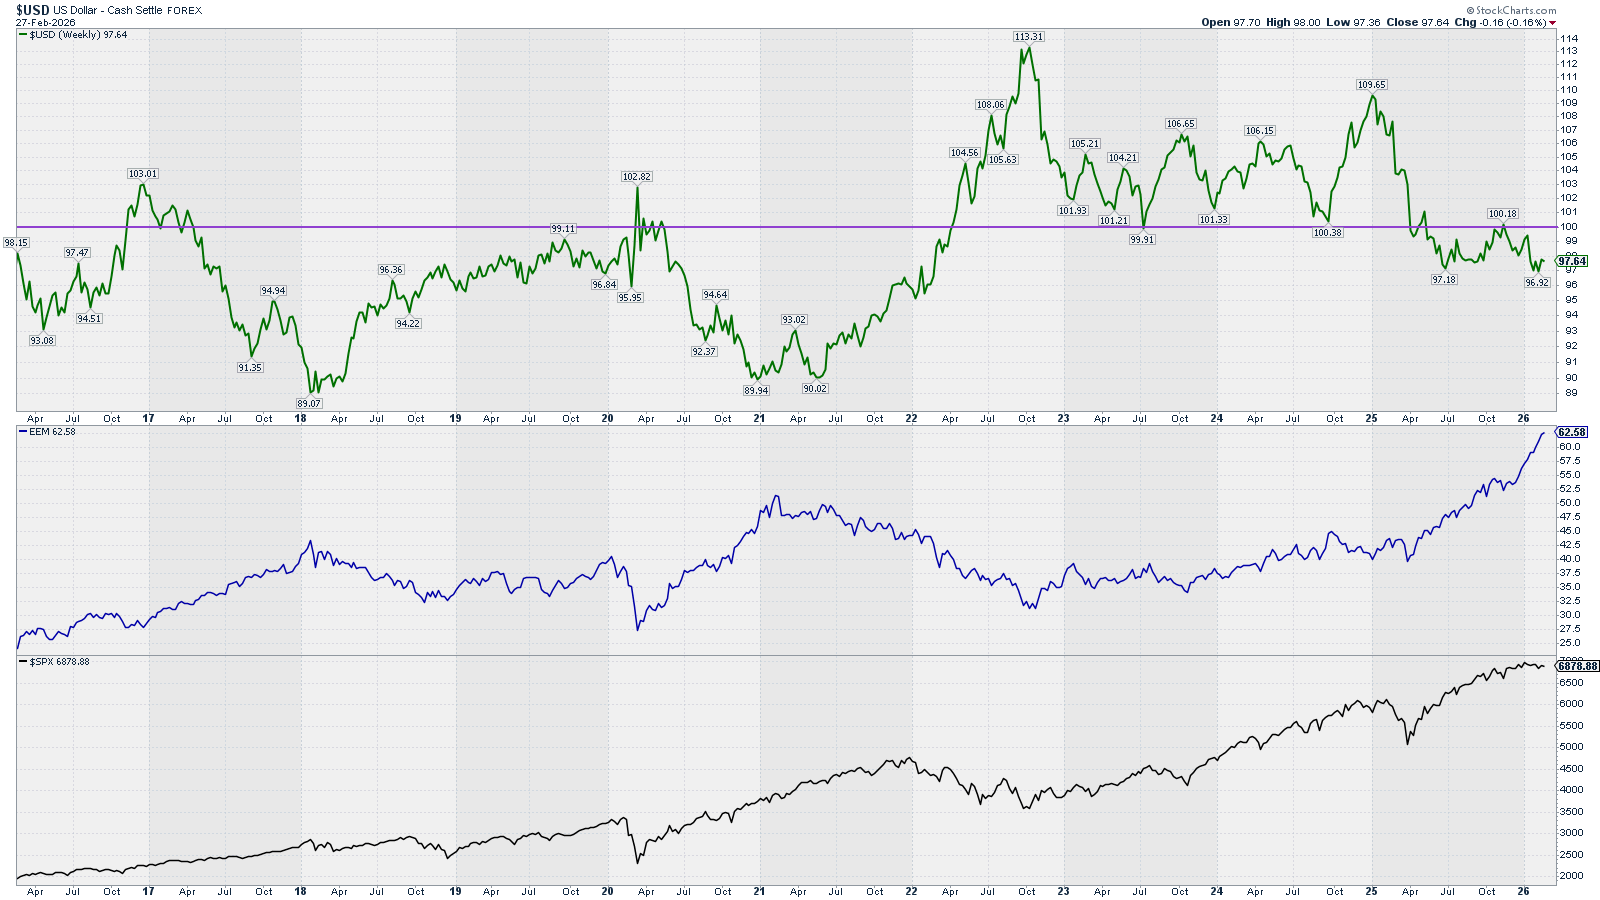
Analysis: USD found resistance at 100 level. EEM accelerating.
Outlook: Bullish (as long as USD goes lower)
Why is it happening? – Level 1
Context Investors Sentiment: Credit Spreads
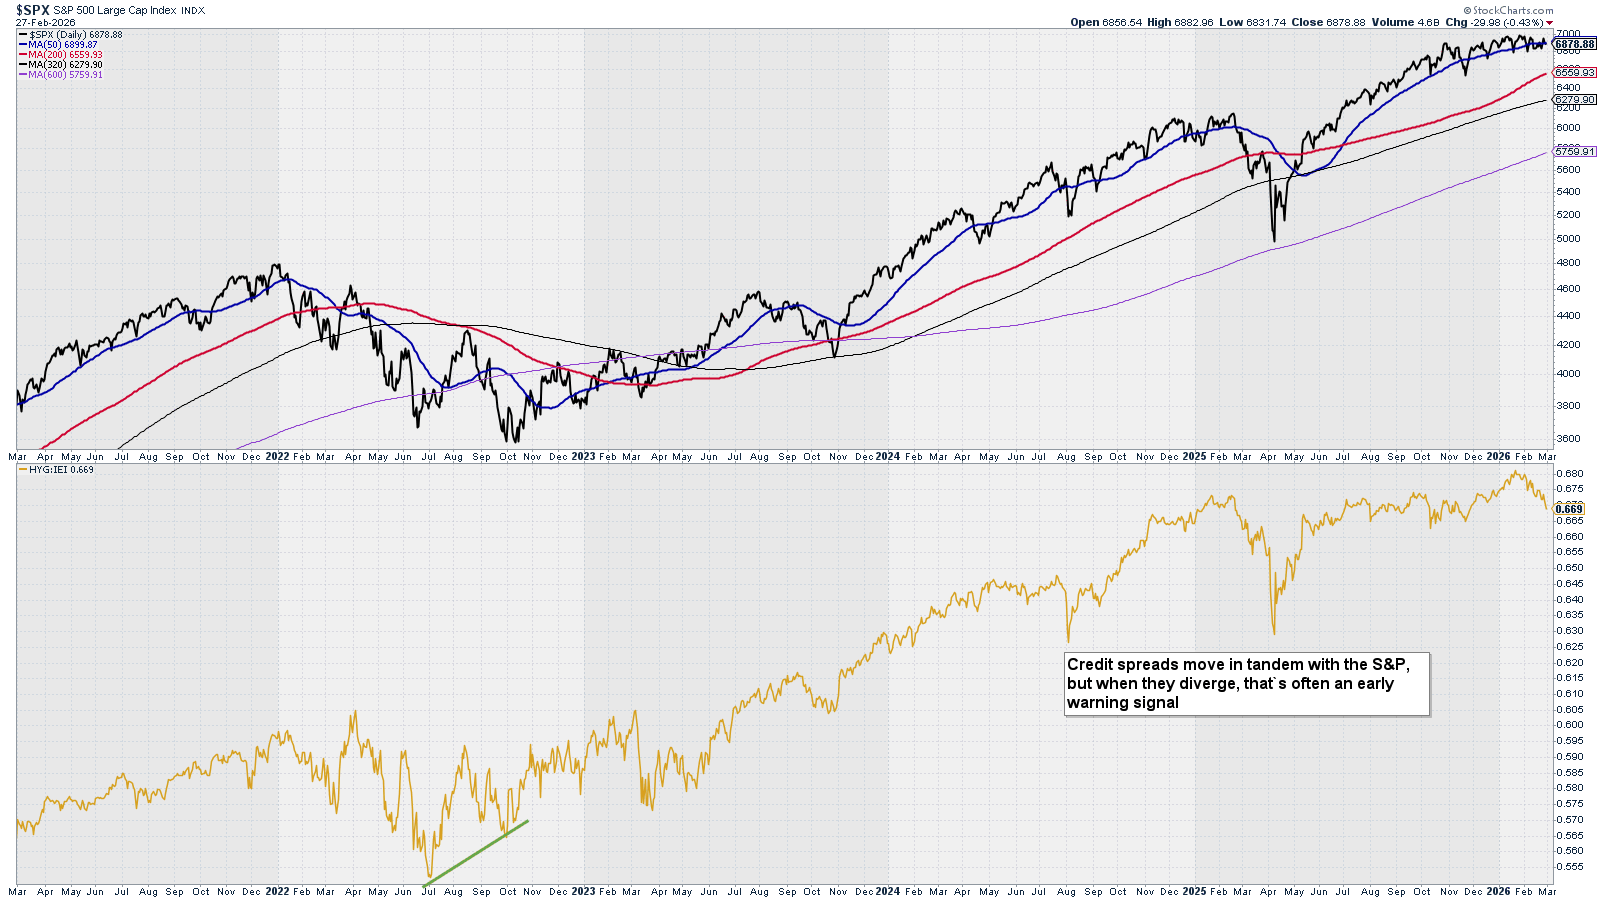
Credit spreads move in tandem with the S&P, but when they diverge, that’s often an early warning signal.
Analysis: Spreads (yellow line) trending lower.
Outlook: Bearish
Why is it happening? – Level 1
Investors Sentiment: AAII & NAAIM
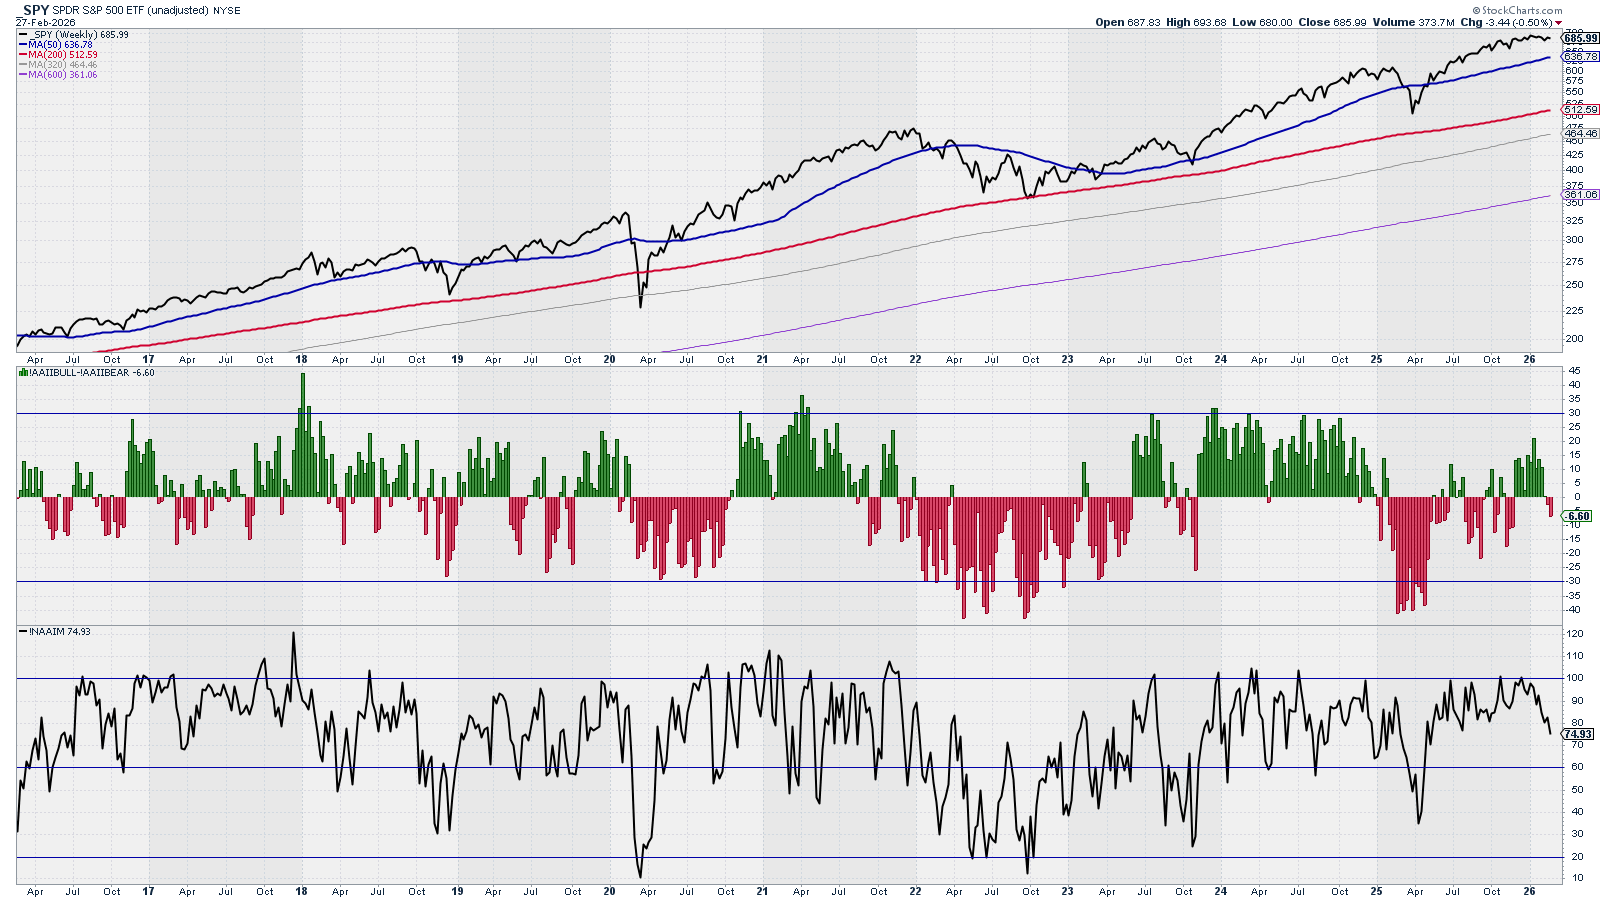
AAII (American Association of Individual Investors) represents the position of retail traders. NAAIM (National Association of Active Investment Managers) represents the position of professional traders. We will be looking to enter contrarian positions against AAII and NAAIM extremes. When these indicators are not in extremes, we shall position aligned with them.
Analysis: AAII just flipped to the bearish side. NAAIM trending lower from overbought level, still above mid-level.
Outlook: Bearish
Level 1 Summary
Economic Data: Bullish
USD & Interest Rates: Bullish
Investors Sentiment: Bearish
What is happening? – Level 2
Price Action: SPX – Trend – 20 years
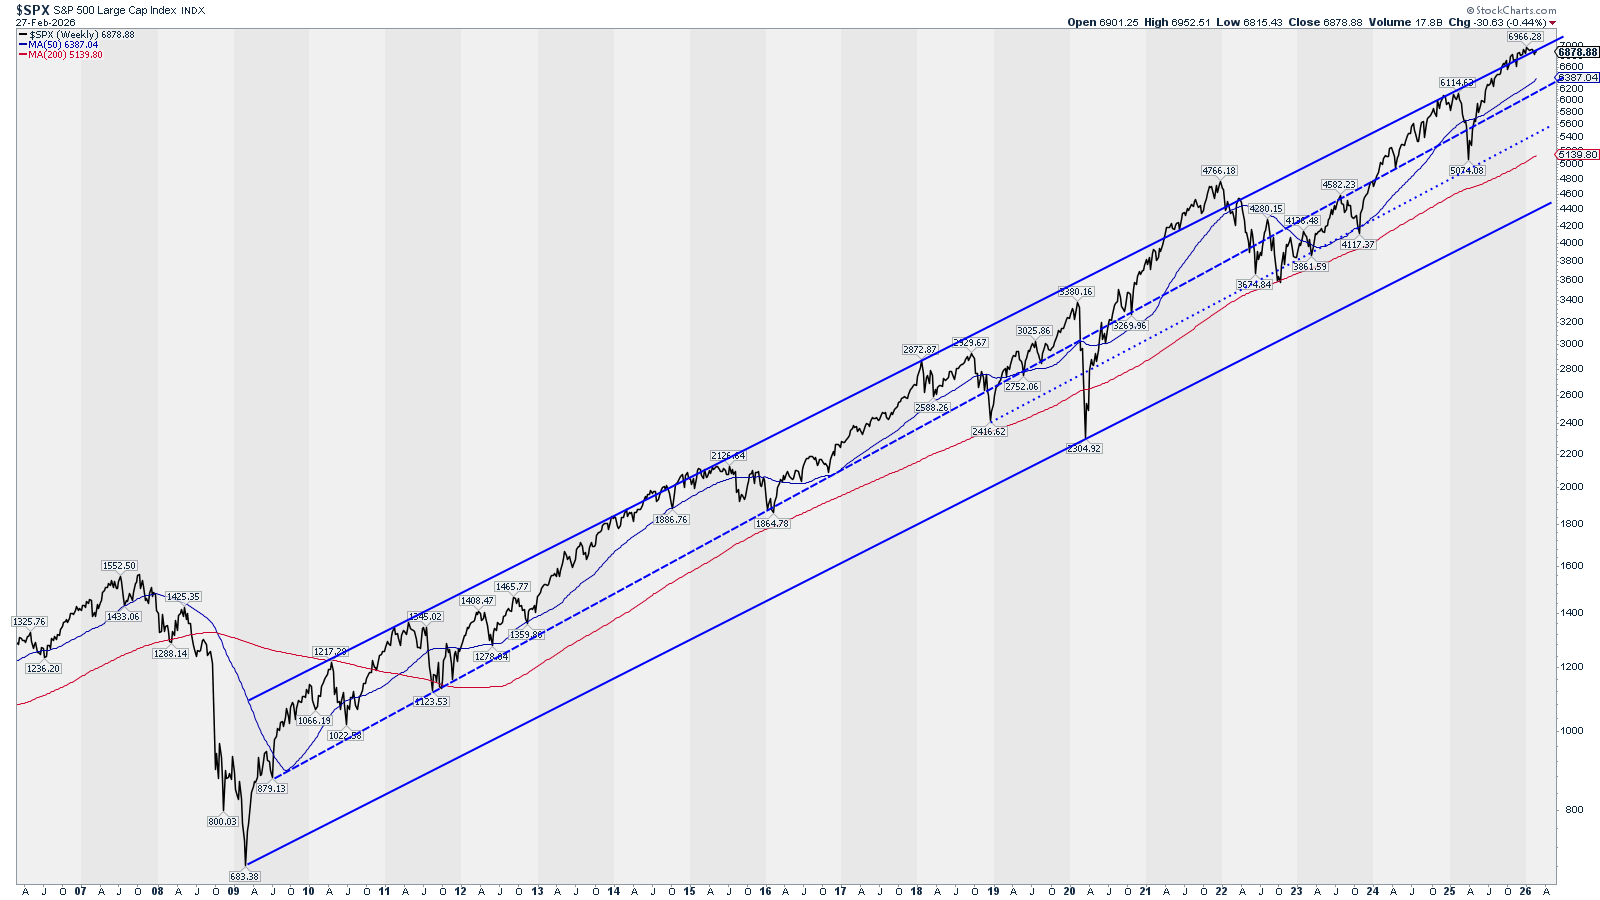
Analysis: Price on the upper channel of the last 20 years trend. This can slow down the uptrend or even cause a drop to bring price inside the long-term channel.
Outlook: Bearish
What is happening? – Level 2
Price Action: RSP – Trend – Weekly
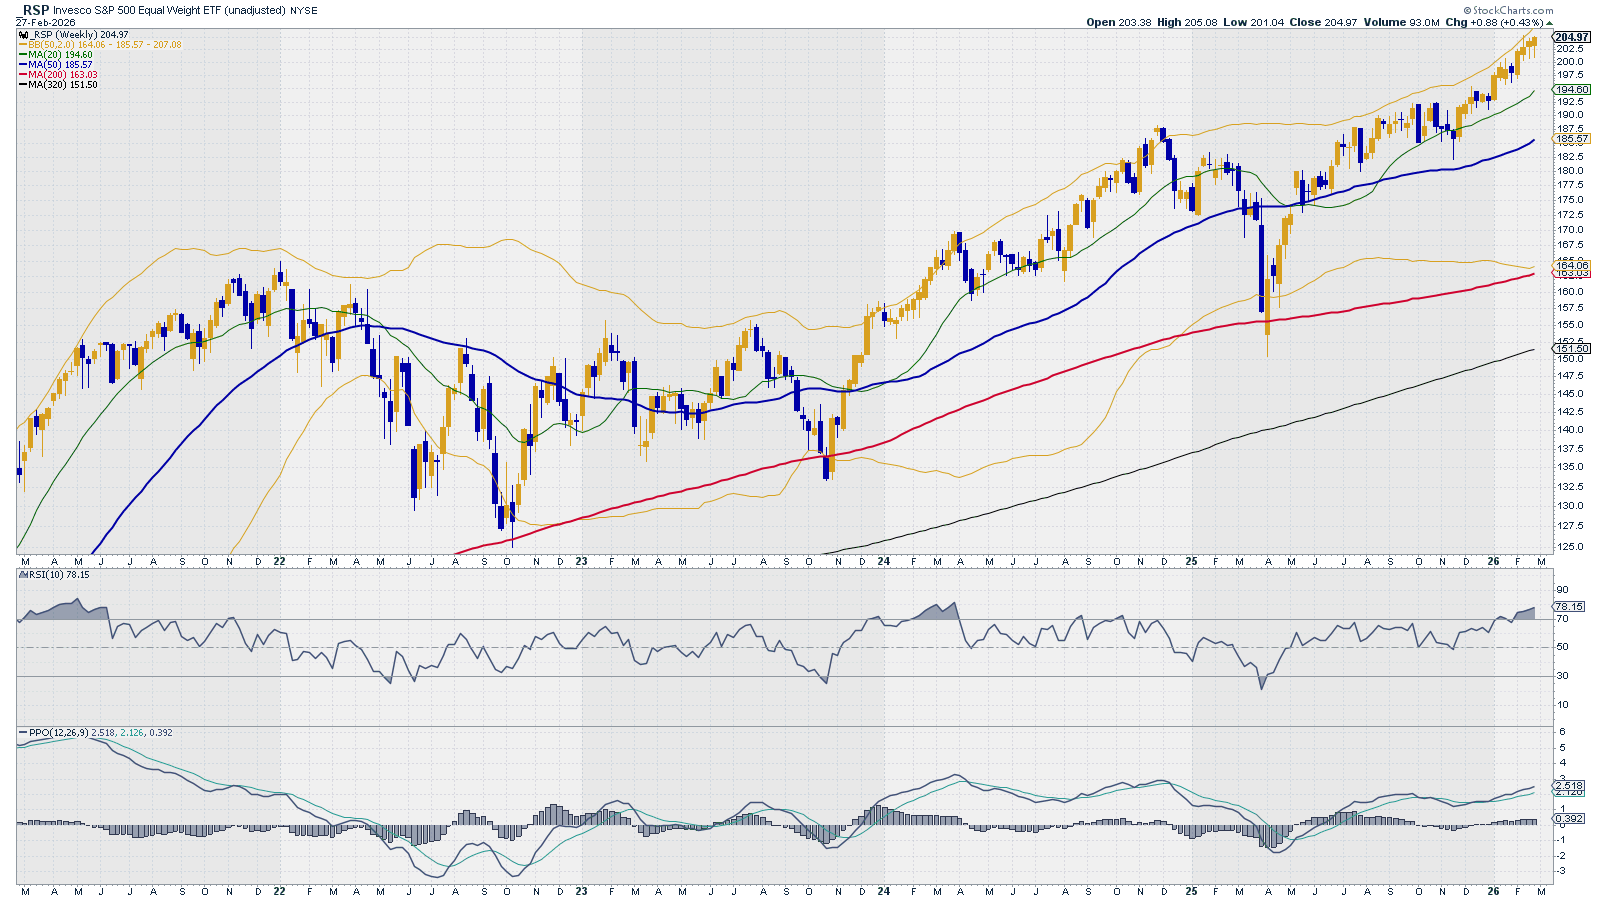
Analysis: Price not overbought (below BB) and still above SMA20. RSI just entered the overbought area. PPO on a bullish trend.
Outlook: Bullish
What is happening? – Level 2
Price Action: RSP – Trend – Daily
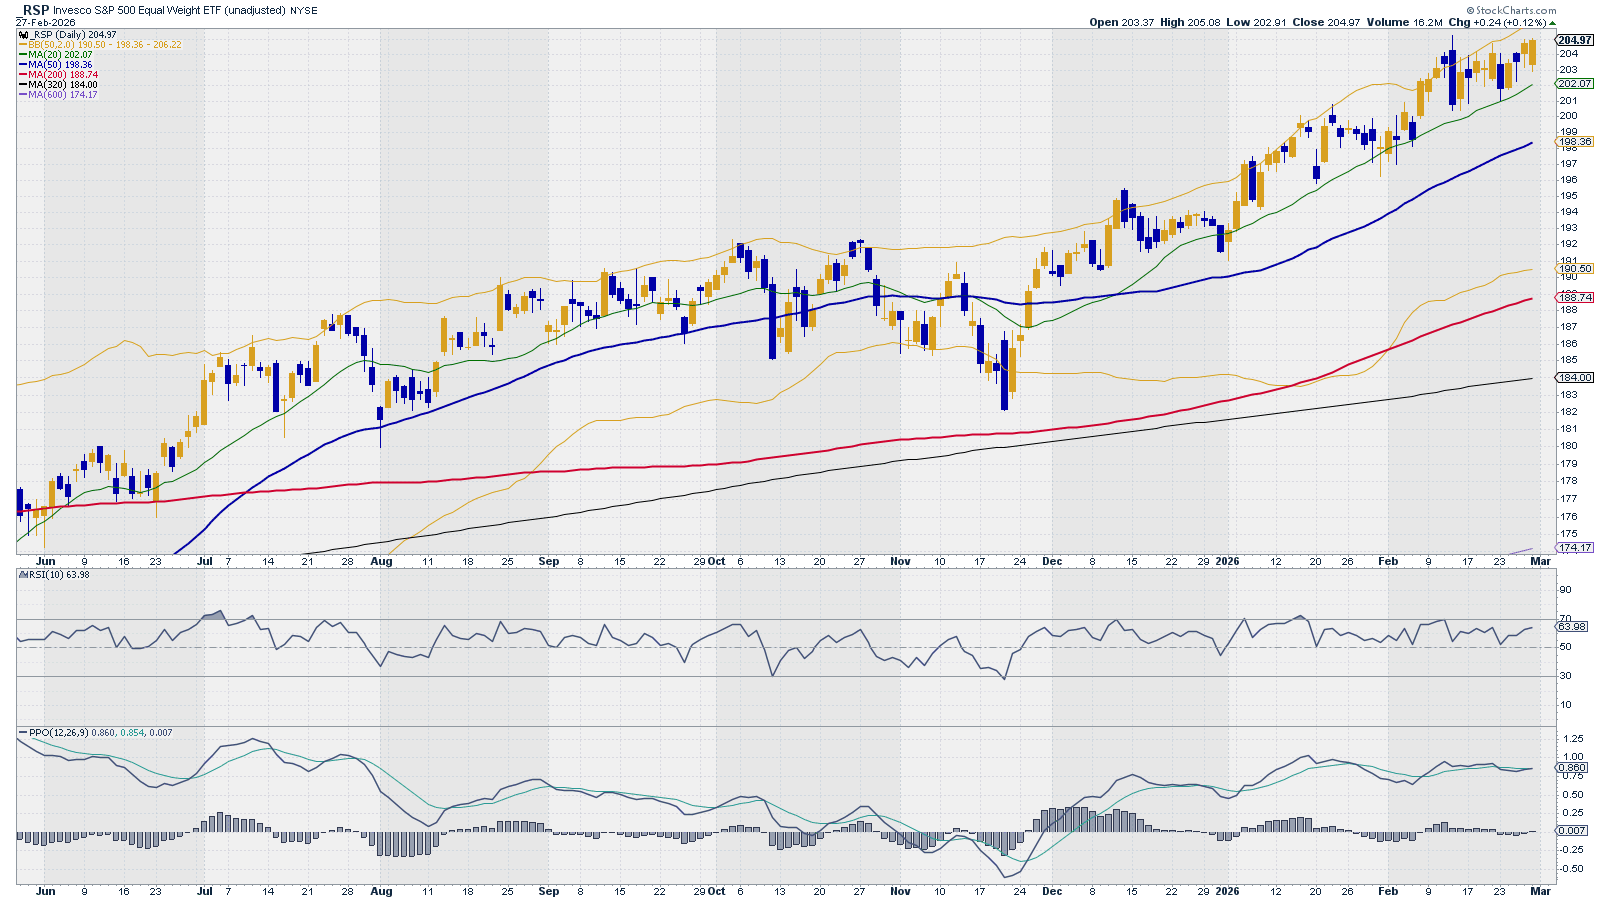
Analysis: Price not overbought (below BB) and still above SMA20. RSI in bullish territory but not overbought. PPO on a bullish trend.
Outlook: Bullish
What is happening? – Level 2
Breadth & Volatility: % Stocks above 200 SMA vs. RSP
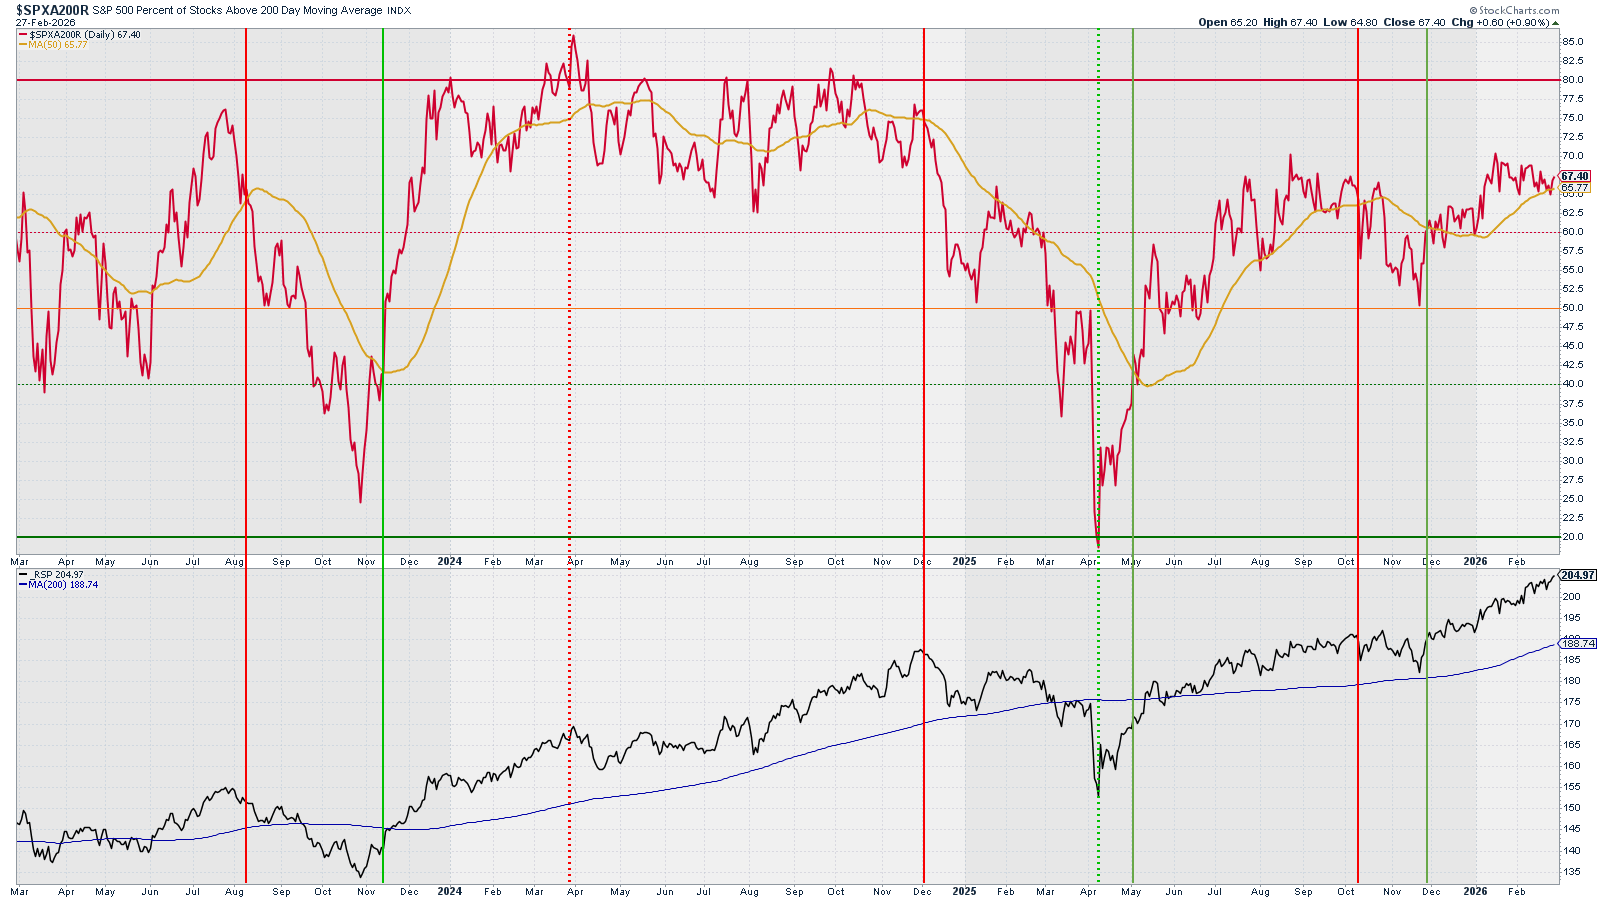
Analysis: Signal above SMA50 but on a horizontal trend in the mid-60s level.
Outlook: Bullish
What is happening? – Level 2
Breadth & Volatility: RSP and % Stocks above 200, 50, and 20 SMA
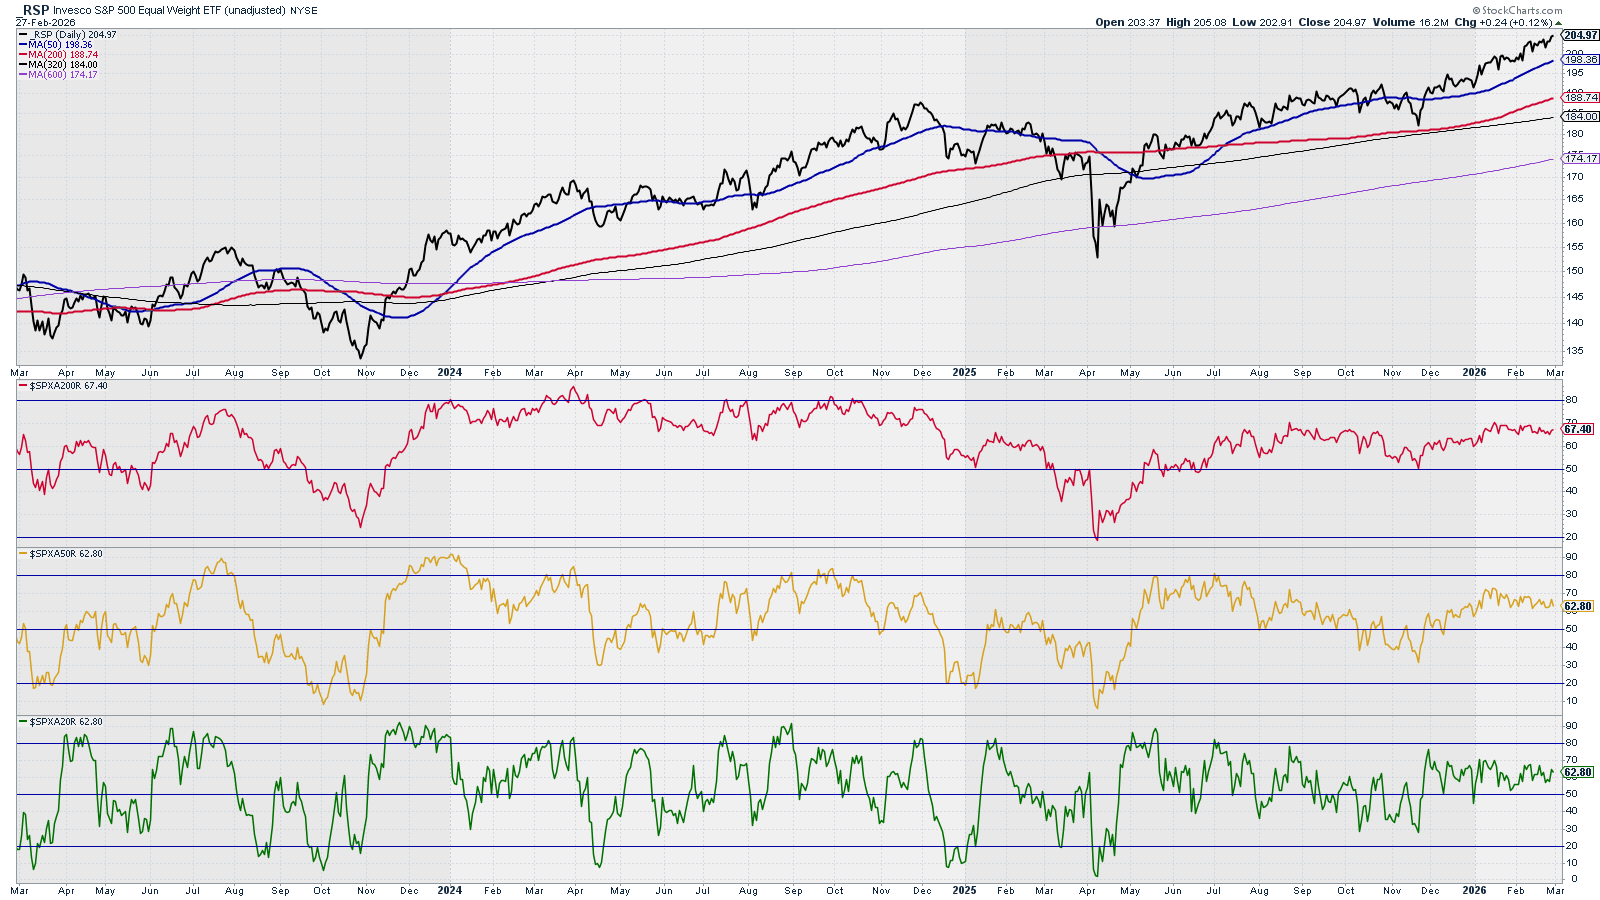
Analysis: All signals in bullish territory, without divergences among themselves or against RSP. The three signals on a flat trend.
Outlook: Bullish
What is happening? – Level 2
Breadth & Volatility: Bullish Pct. Index & McClellan Summation Index
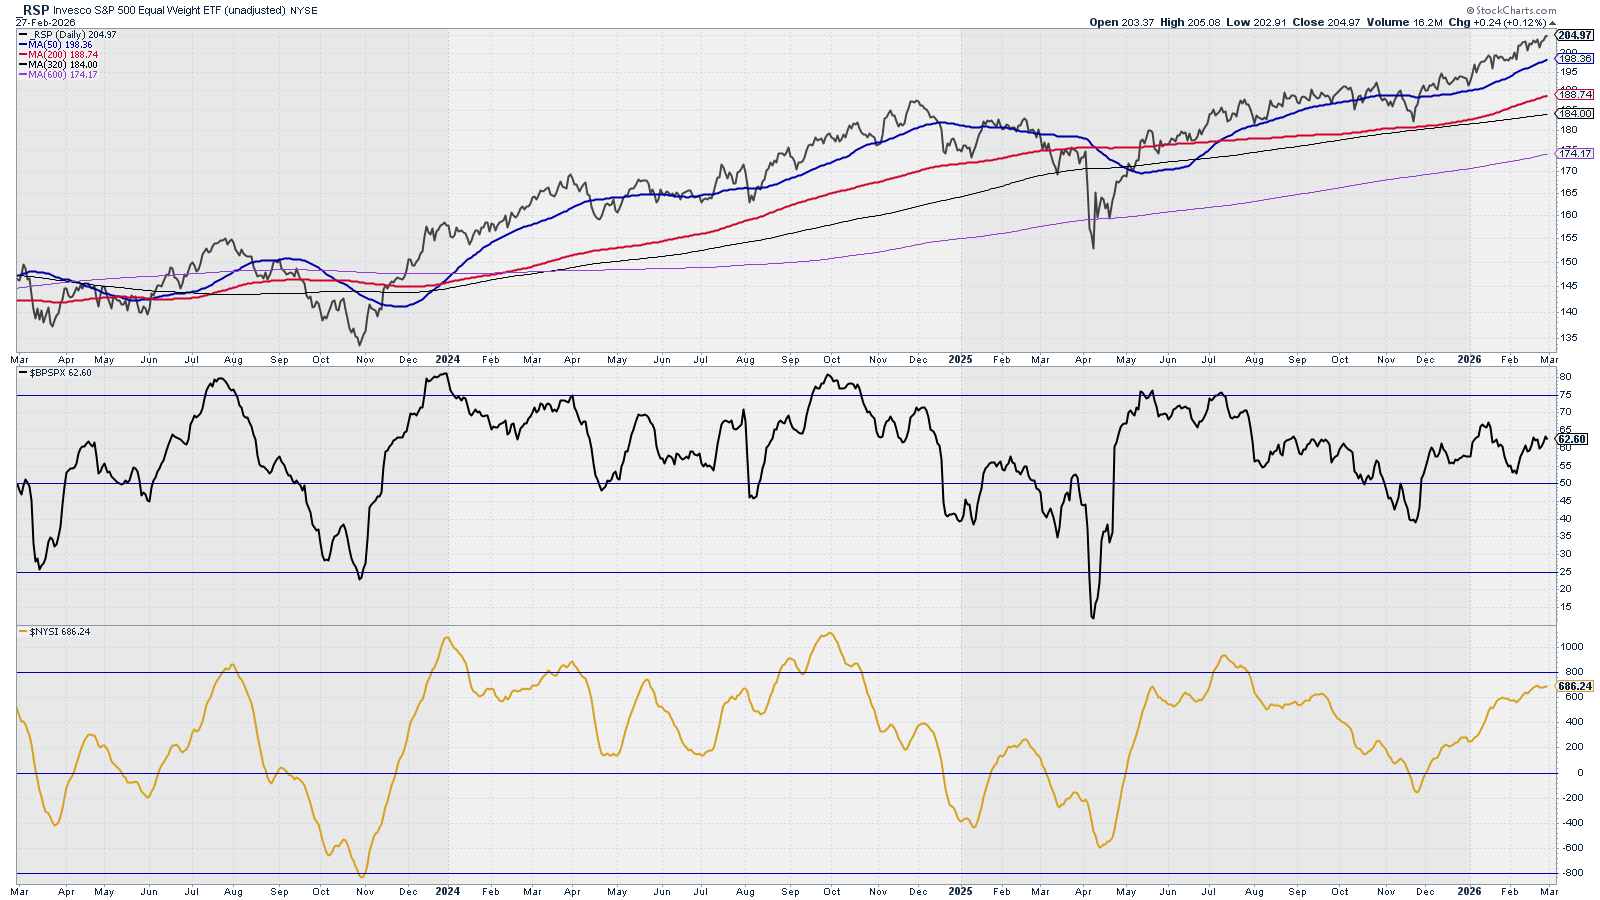
Analysis: Bullish Pct. Index above the 50% level and and just did a sharp up turn due mainly to Friday’s action. McClellan Summation Index above the 50% level and holding.
Are we in a similar situation like in August 2024? Are we going to see the market melt up to new all-time highs (SPX above 7000, reaching up to 7200) for later retrace back to a key support level (SPX back to 7000).
Outlook: Bullish
What is happening? – Level 2
Breadth & Volatility: Ratio Low Volatility Stocks / SPY vs. SPY & RSP
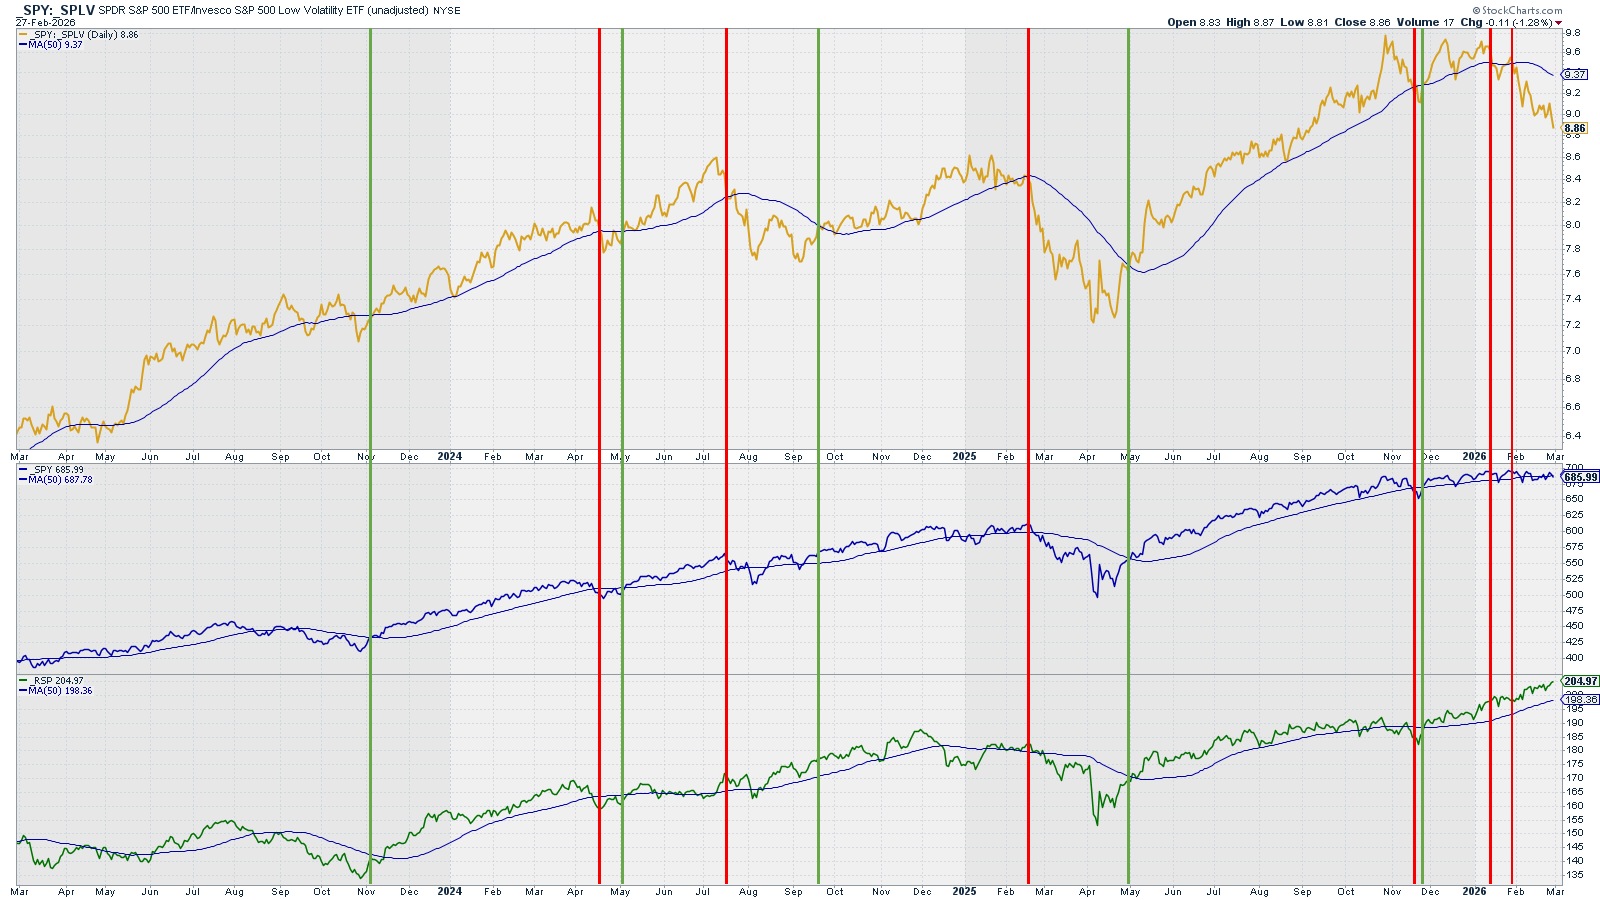
Analysis: Ratio crossed below its SMA50, triggering the bearish signal.
Outlook: Bearish
What is happening? – Level 2
Breadth & Volatility: New Highs vs. SPY & RSP
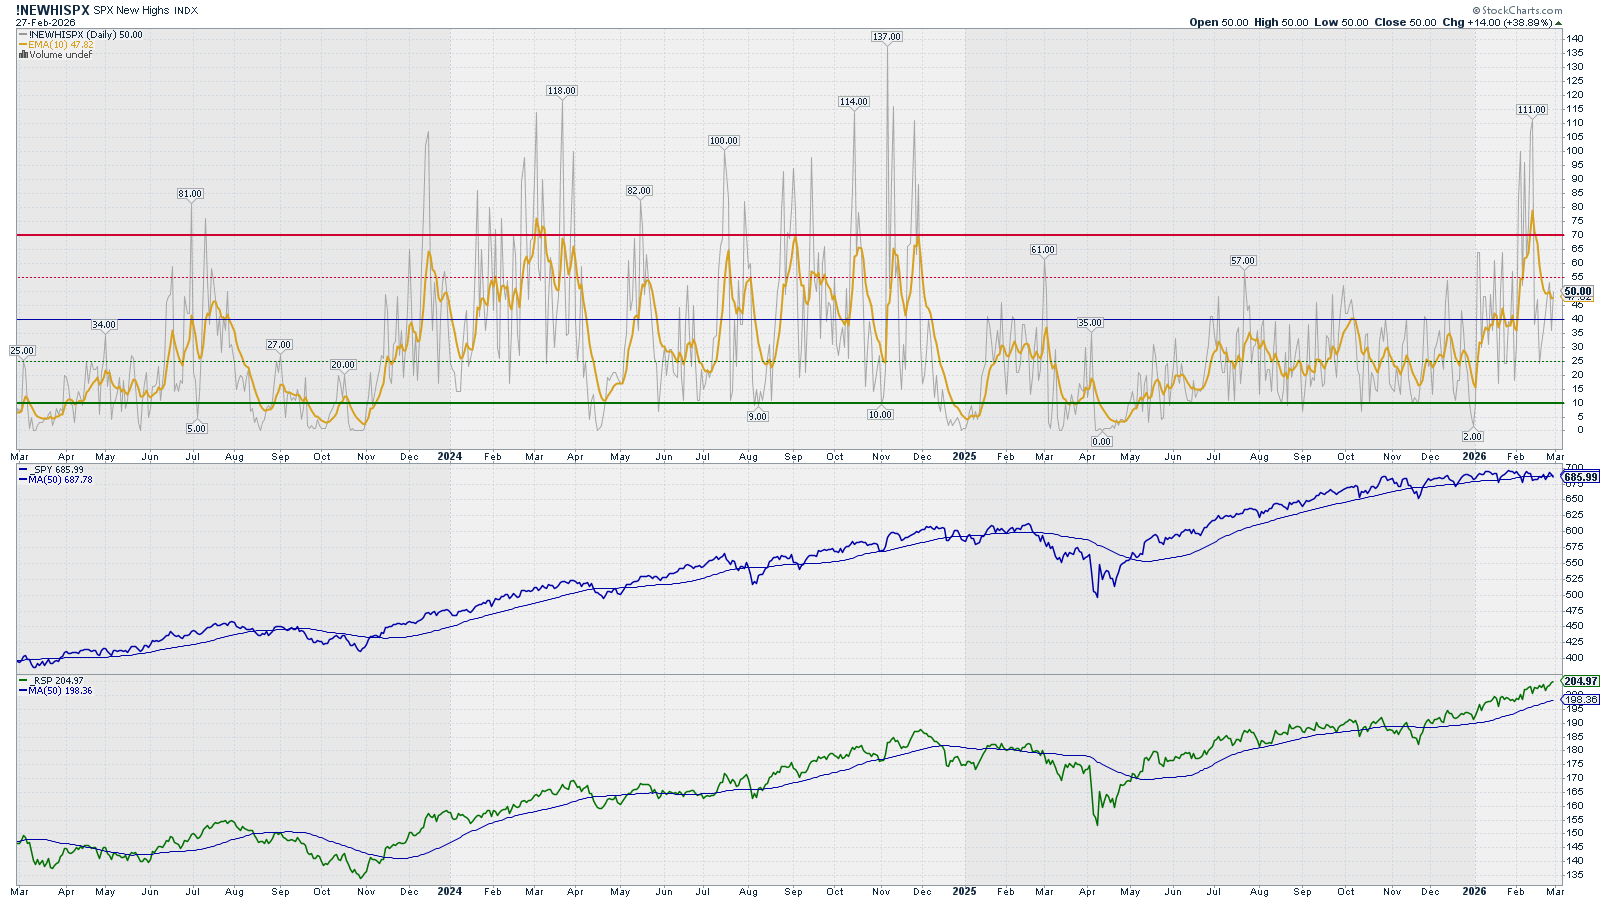
Analysis: New Highs reached a peak level last week, triggering a Bearish signal.
Outlook: Bearish
What is happening? – Level 2
Breadth & Volatility: VIX vs. SPY & RSP
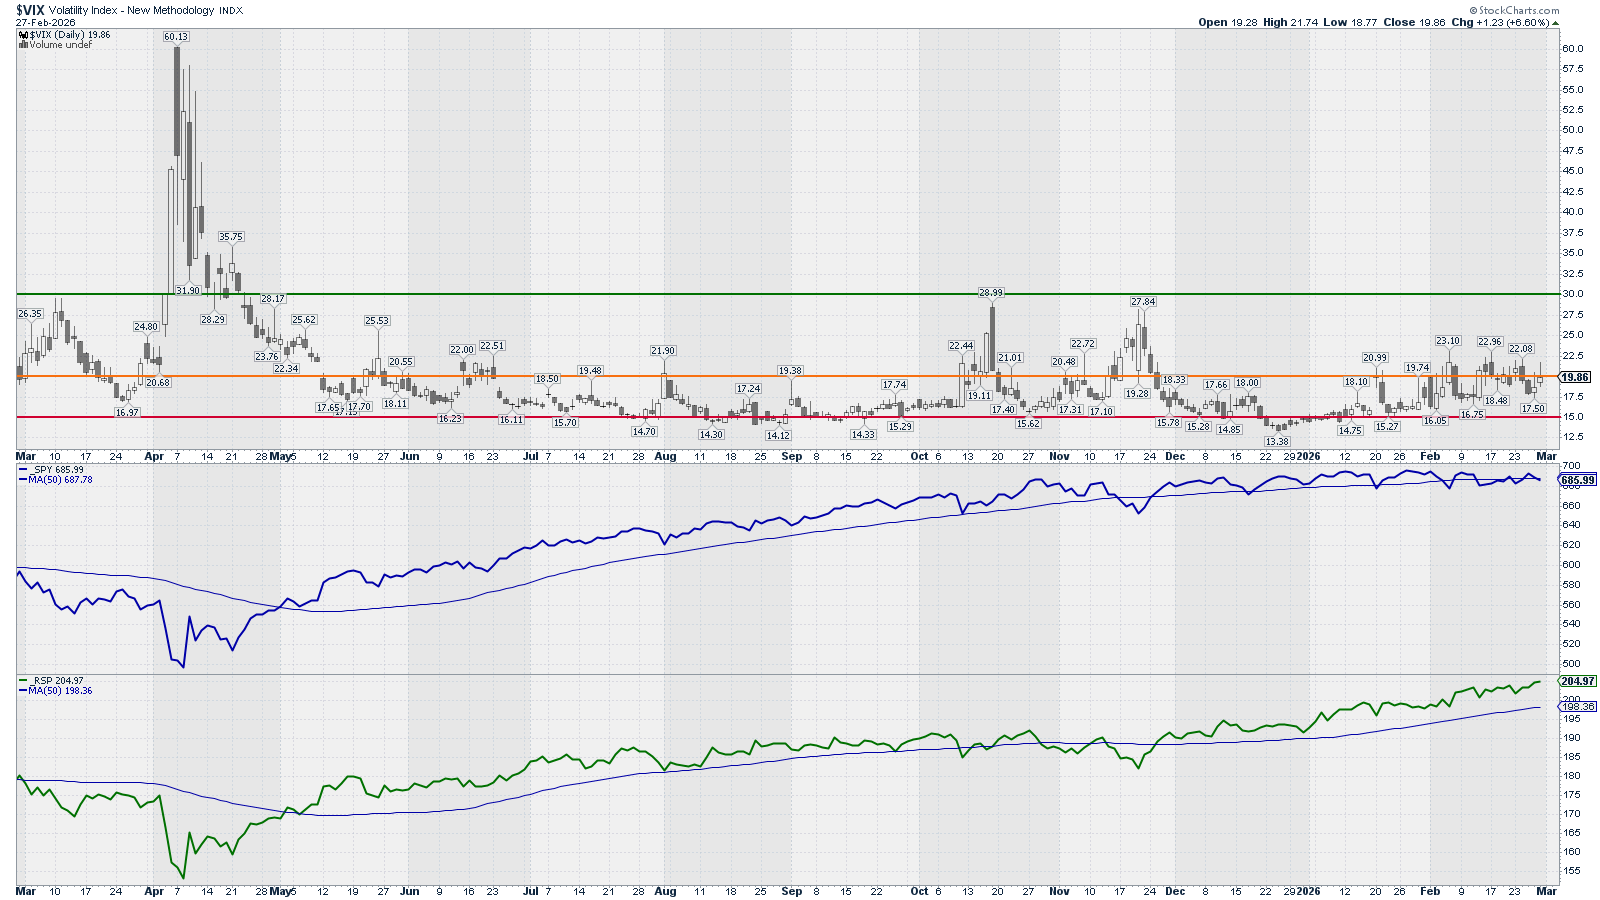
This chart is mainly to detect market bottoms.
Analysis: VIX hovering around level 20.
Outlook: Expect mild volatility
What is happening? – Level 2
Options: (Inverted) Put/Call Ratio vs. SPY
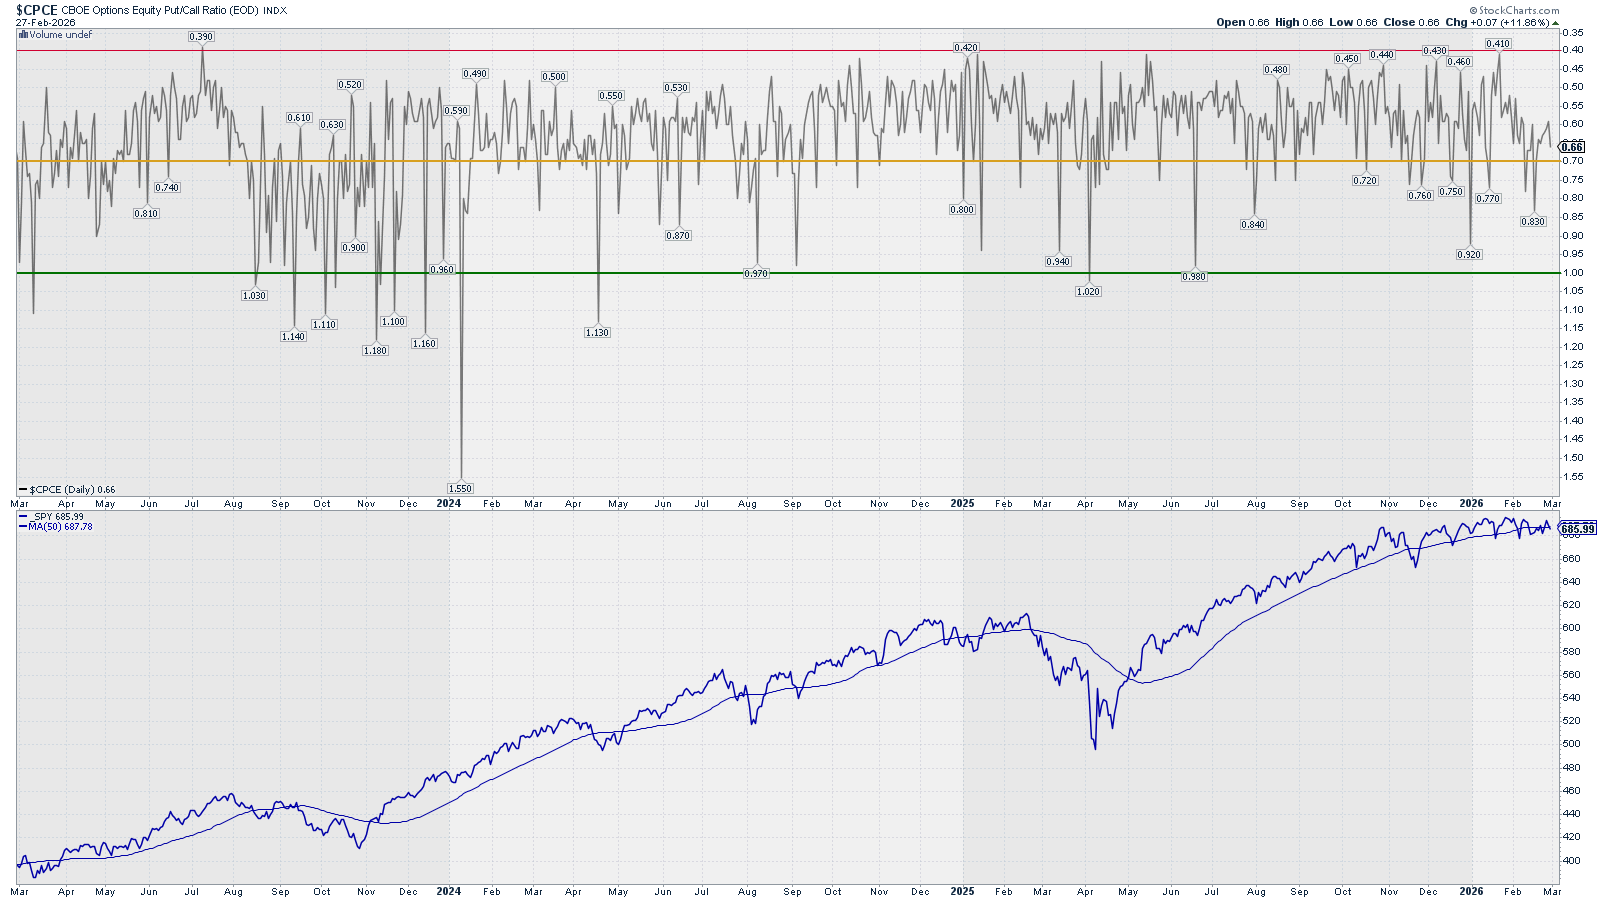
Analysis: P/C ratio in middle ground. Not too bearish not too bullish.
Outlook: Neutral (expect choppiness)
What is happening? – Level 2
Options: Gamma Exposure – SPX
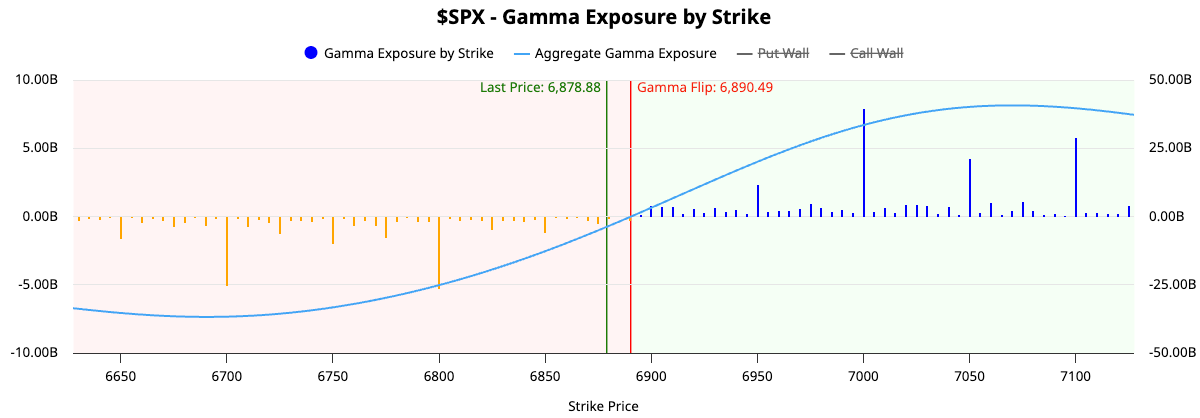
Analysis: In negative GEX (expect higher volatility). Walls at 6800 and 7000.
Outlook: Neutral
Level 2 Summary
Price Action: Bullish to Neutral
Breadth & Volatility: Breadth is Bullish, Volatility is Bearish
Options: Neutral
What is happening? – Level 3
Bulls vs. Bears: RSP vs. RSPD (Cons. Disc. – Bulls) and RSPS (Cons. Sta. – Bears)
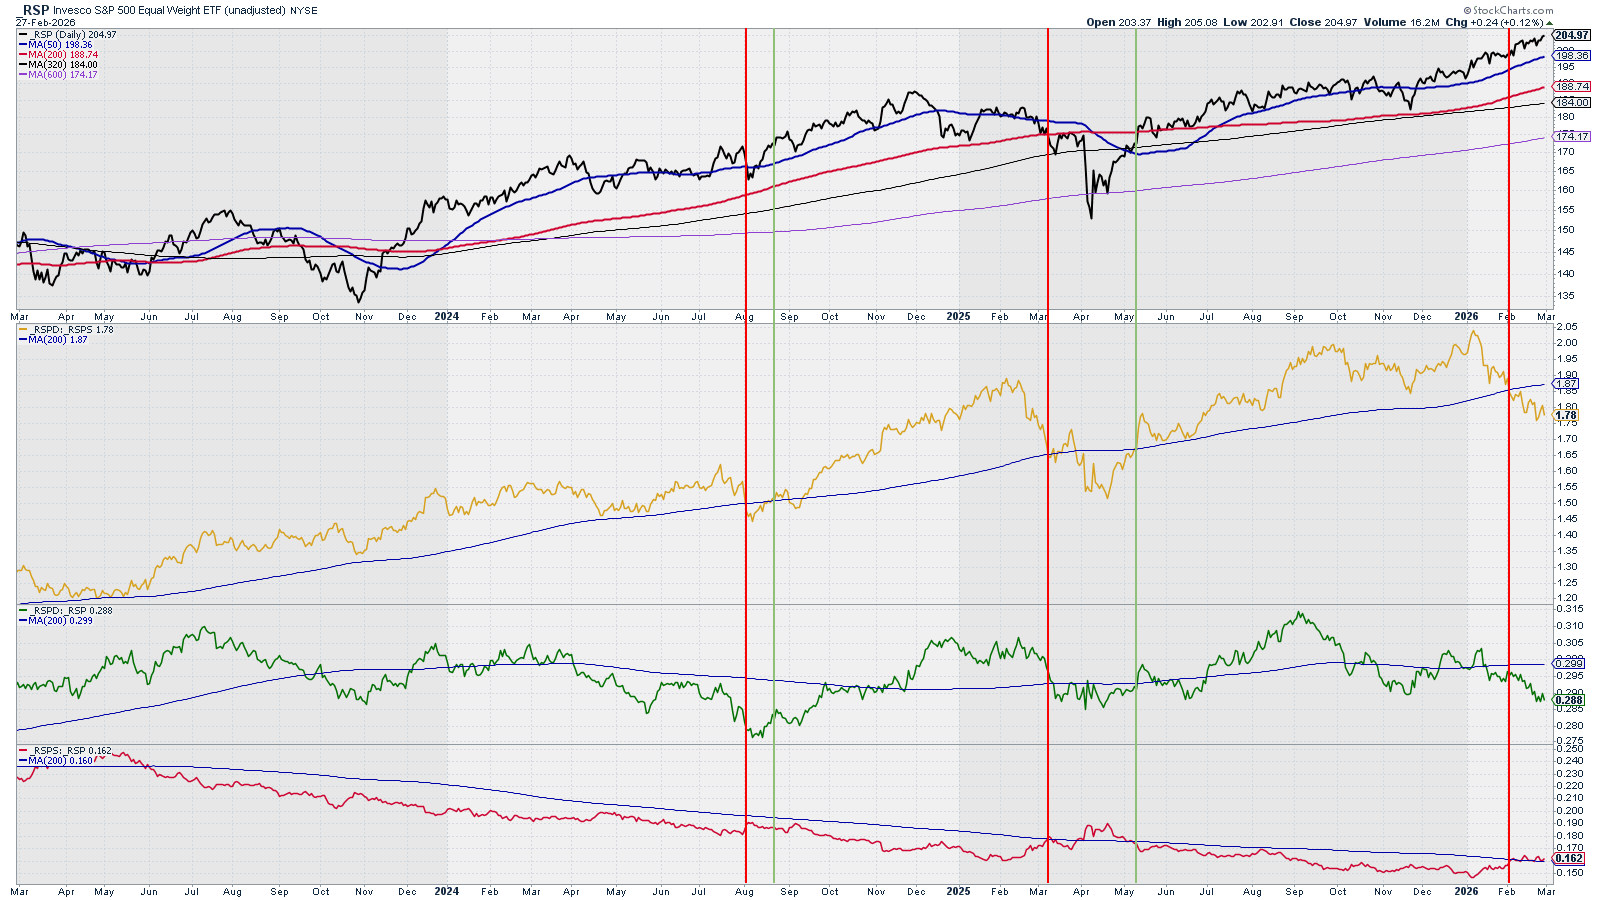
Analysis: Ratio below SMA200, triggering Bearish signal.
Outlook: Bearish
What is happening? – Level 3
Flows into High Beta ETF vs. RSP
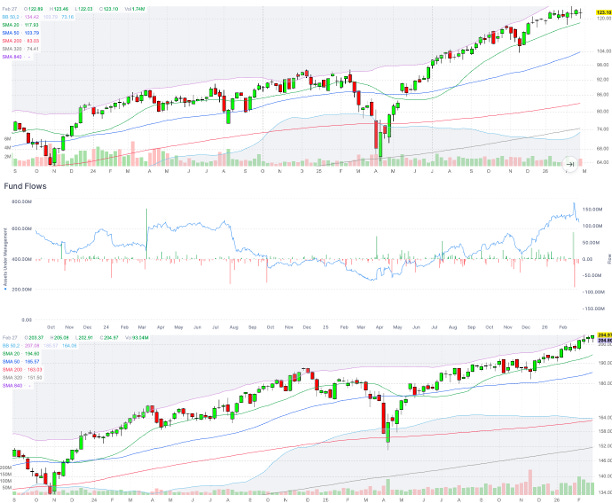
SPHB Fund Flows show the appetite for High Beta (risk on) positions. A decrease on flows is a bearish signal, while an increase in flows is a bullish signal.
Analysis: ASPHB fell sharply this week. Also they were on highly overbought level.
Outlook: Bearish
What is happening? – Level 3
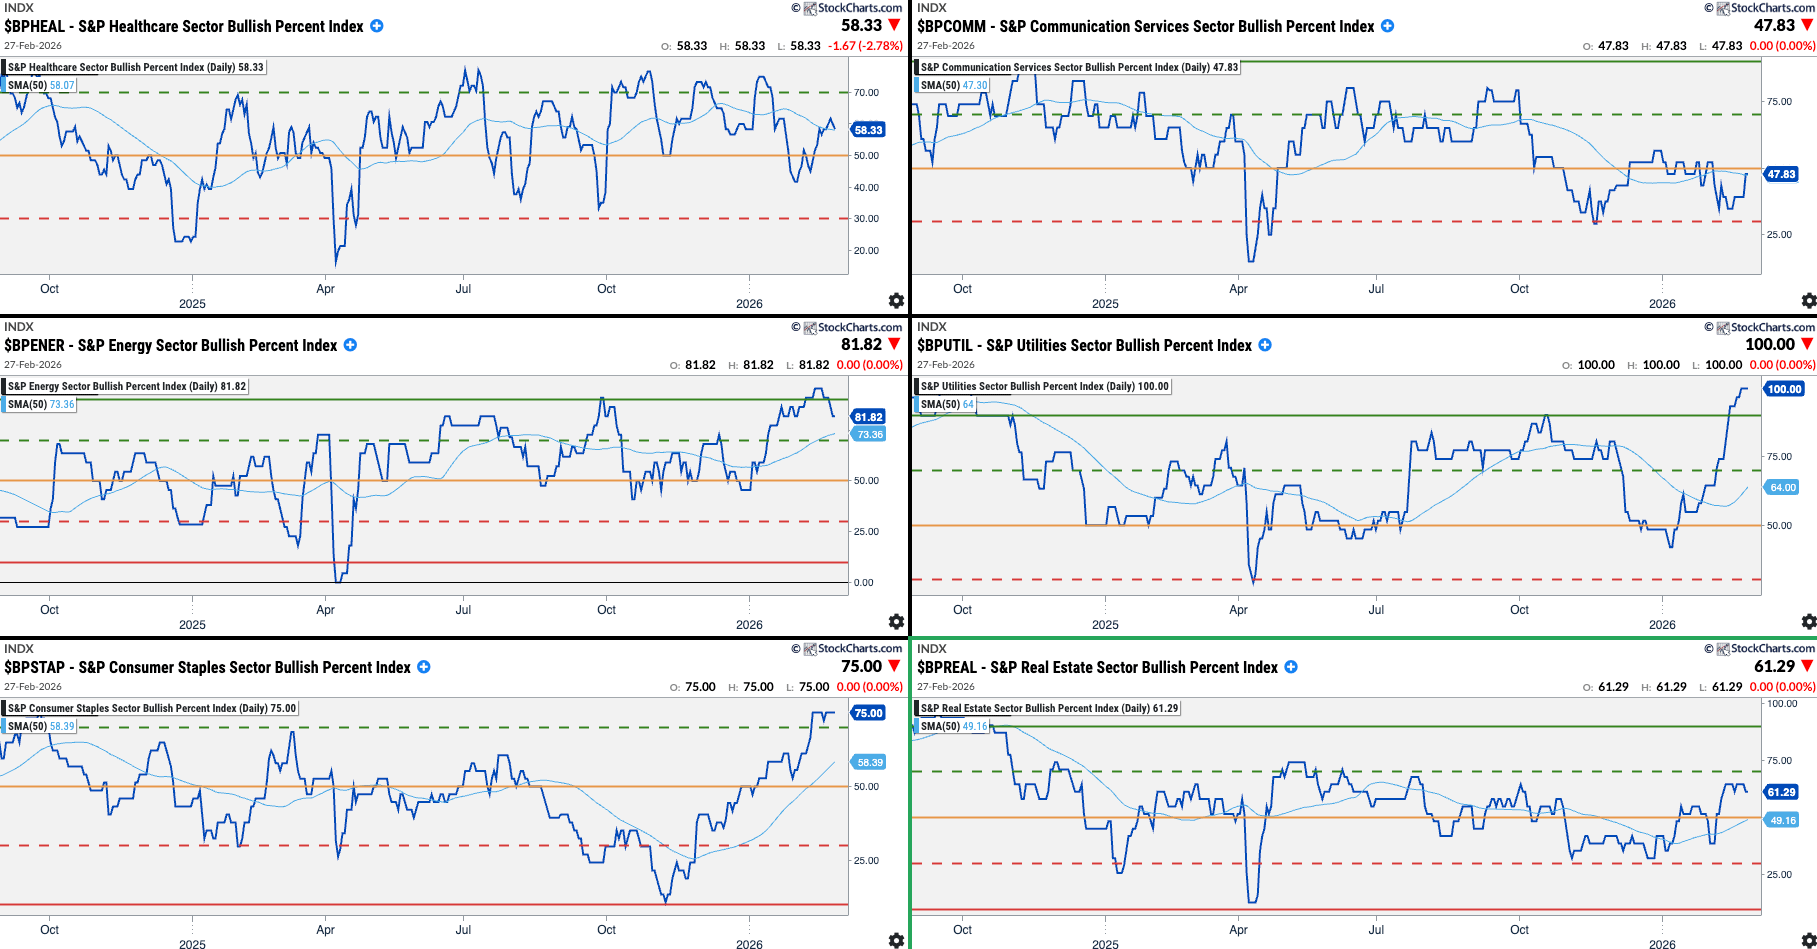
Sectors Bullish Percent Index
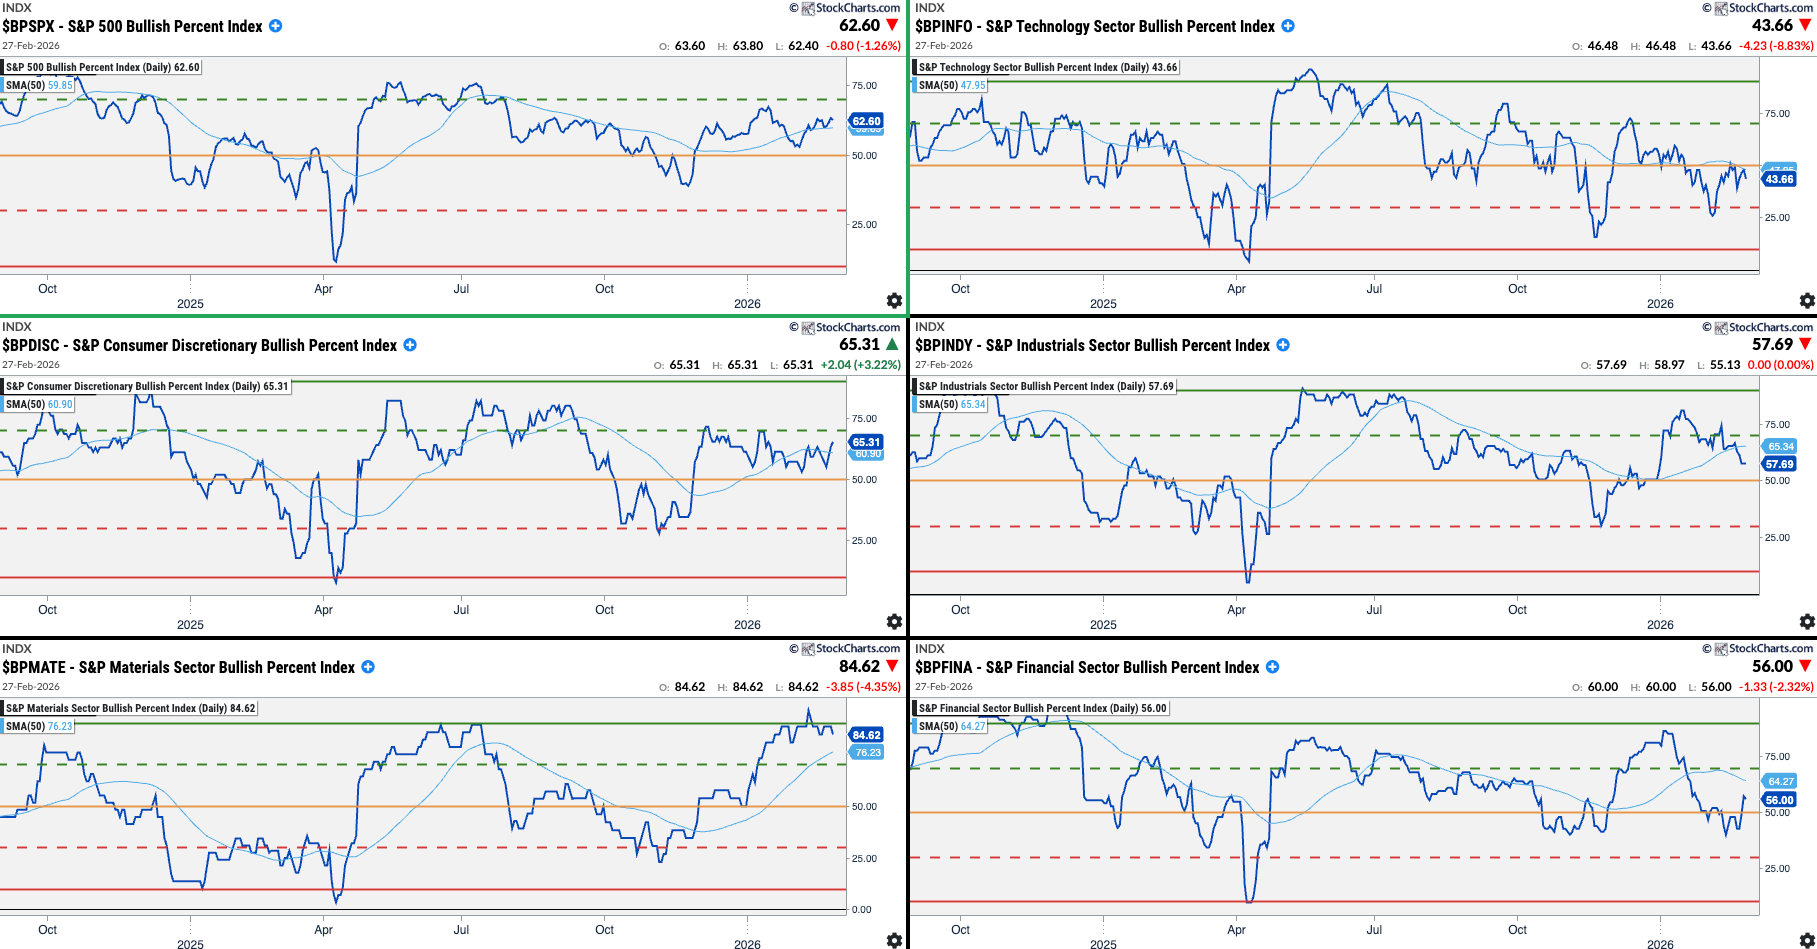
US Sectors order by ISM PMI Correlation
Growth - shall outperform when the market is bullish:
XLK: Technology (71%)
XLY: Cons. Discretionary (67%)
XLI: Industrials (66%)
XLB: Basic Materials (66%)
XLF: Financials (59%)
Value (shall outperform when the market is bearish):
XLV: Healthcare (55%)
XLC: Communications (49%)
XLE: Energy (44%)
XLU: Utilities (35%)
XLP: Cons. Staples (30%)
XLRE: Real Estate (16%)
Analysis:
Reduce exposure to: Materials, Energy, Staple, Utilities
Increase exposure to: Financials
Level 3 Summary
Bulls vs. Bears: Bearish
High Beta Flows: Bearish
Sectors Bullish Percent Index: Bearish
All Levels Summary
Level 1 Summary
Economic Data: Bullish
USD & Interest Rates: Bullish
Investors Sentiment: Bearish
Level 2 Summary
Price Action: Bullish to Neutral
Breadth & Volatility: Breadth is Bullish, Volatility is Bearish
Options: Neutral
Level 3 Summary
Bulls vs. Bears: Bearish
High Beta Flows: Bearish
Sectors Bullish Percent Index: Bearish