


In ‘AMAT Methodology’ page pinned in the homepage (top buttons bar), I introduced the AMAT Market Cycle Clock:
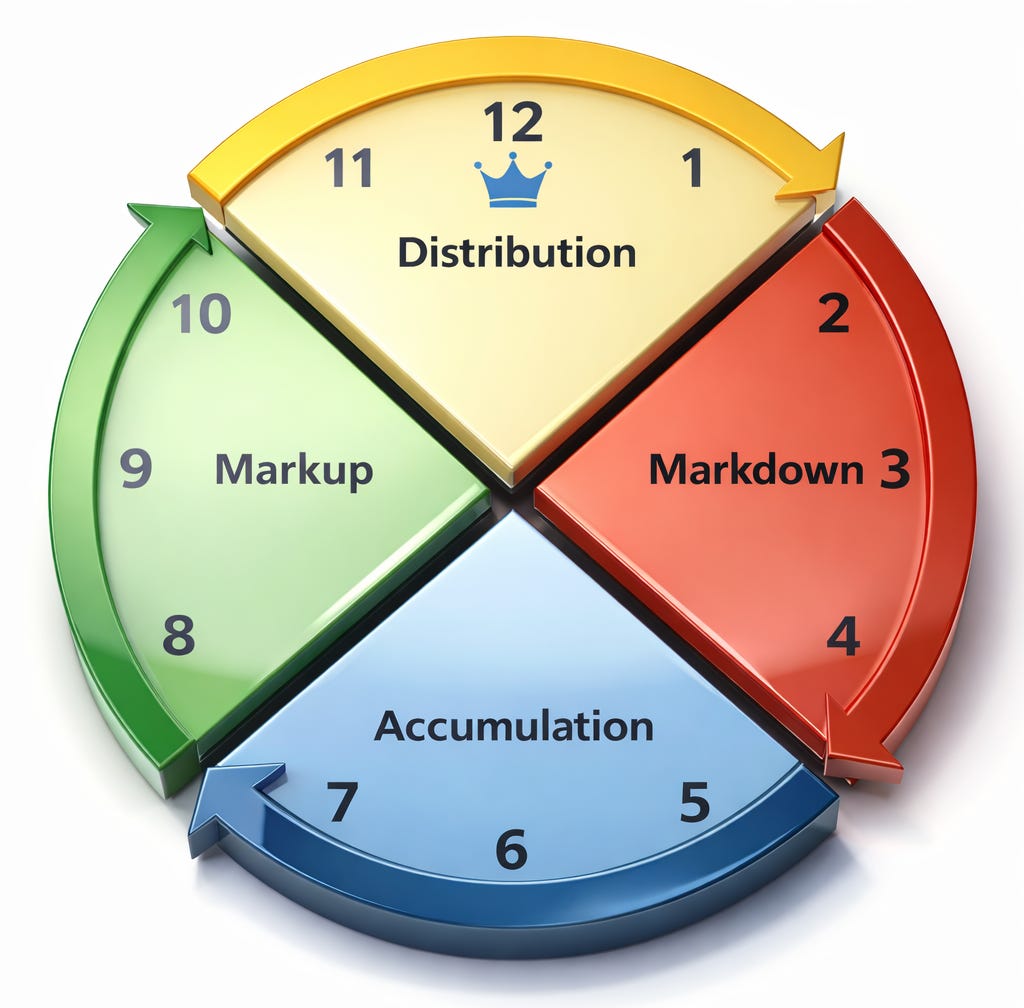
The AMAT Clock is derived from the Wyckoff market cycle. Please read the full explanation here: AMAT Market Cycle Clock.
Using the AMAT Clock provides several advantages:
It provides a finite number of possibilities to define the current state of the market (maximum 12 possible positions), and eases the communication of your view on the market by simply saying at what hour you think the market is.
It establishes the 4 main phases to any market. It is at the bottom accumulating (around 6 o’clock); it is raising (around 9 o’clock); it is at the top distributing (around 12 o’clock); or it is falling (around 3 o’clock).
It gives an expected sequence of events where the market cycles from accumulation (6) to markup (9), then to distribution (12), after that to markdown (3), and finally into accumulation (6) so the cycle can repeat again.
From now on, I will replace all market outlooks with the AMAT Cycle Hour (ACH) which provides a better thinking framework than the rather simplistic Bullish or Bearish readings.
Context: Why is it happening?
Economic Production: ISM PMI vs. SPX
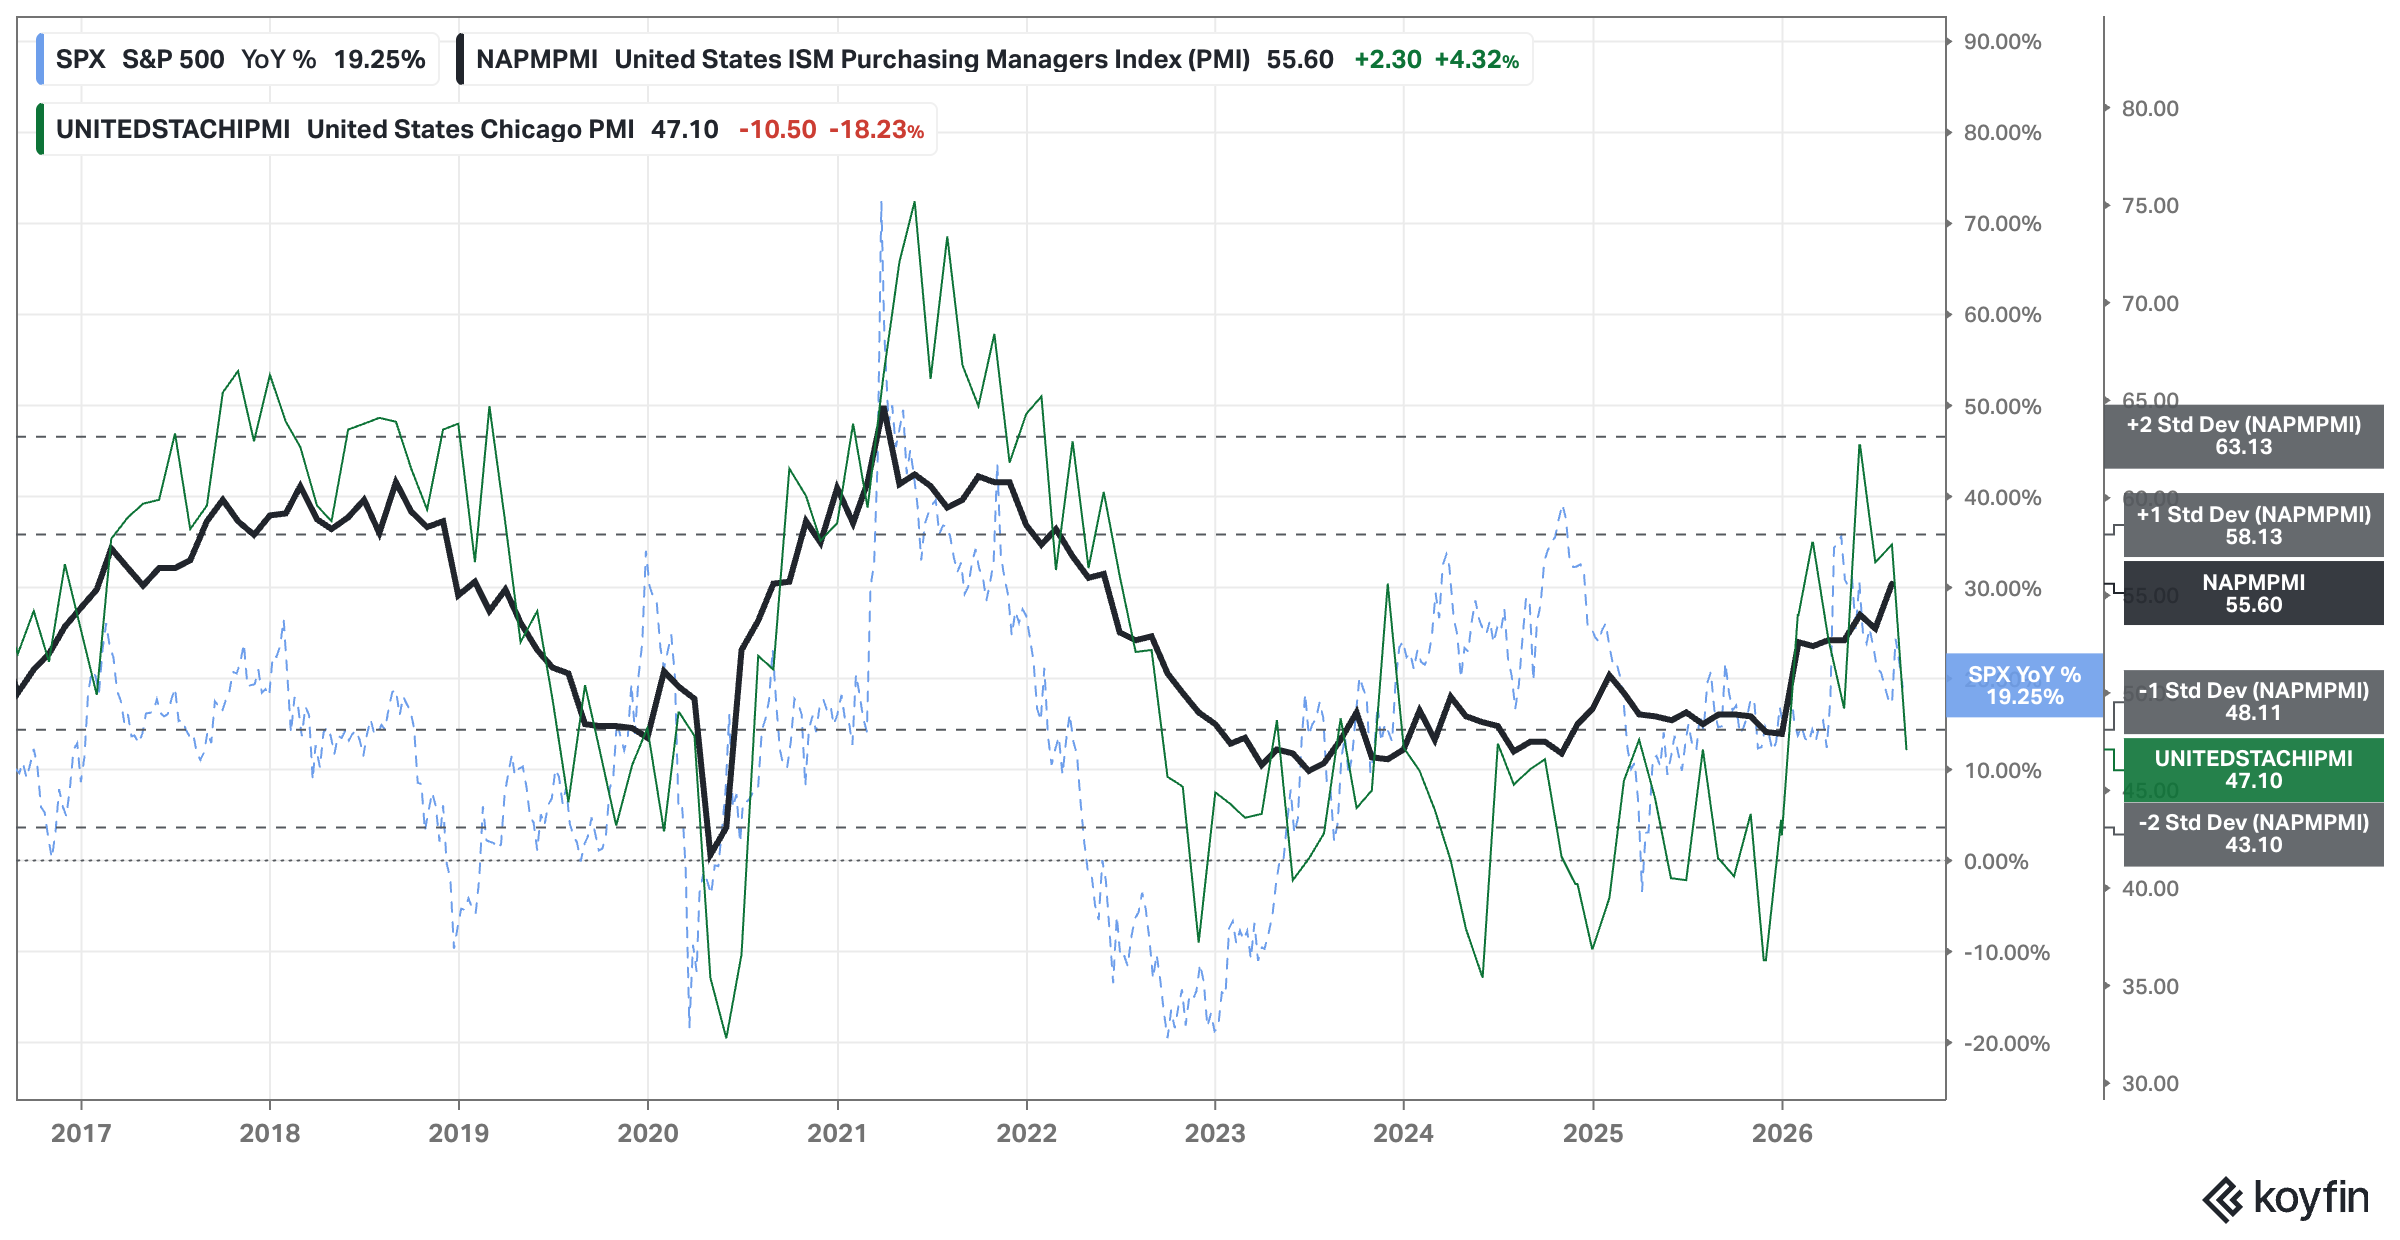
Analysis: Chicago’s PMI dropped sharply. This indicator is always a bit choppy but worth keeping an eye on it. Setting the AMAT Clock Hour (ACH) at 9 o’clock.
ACH: 9 o’clock
Economic Activity: Regional Banks Performance
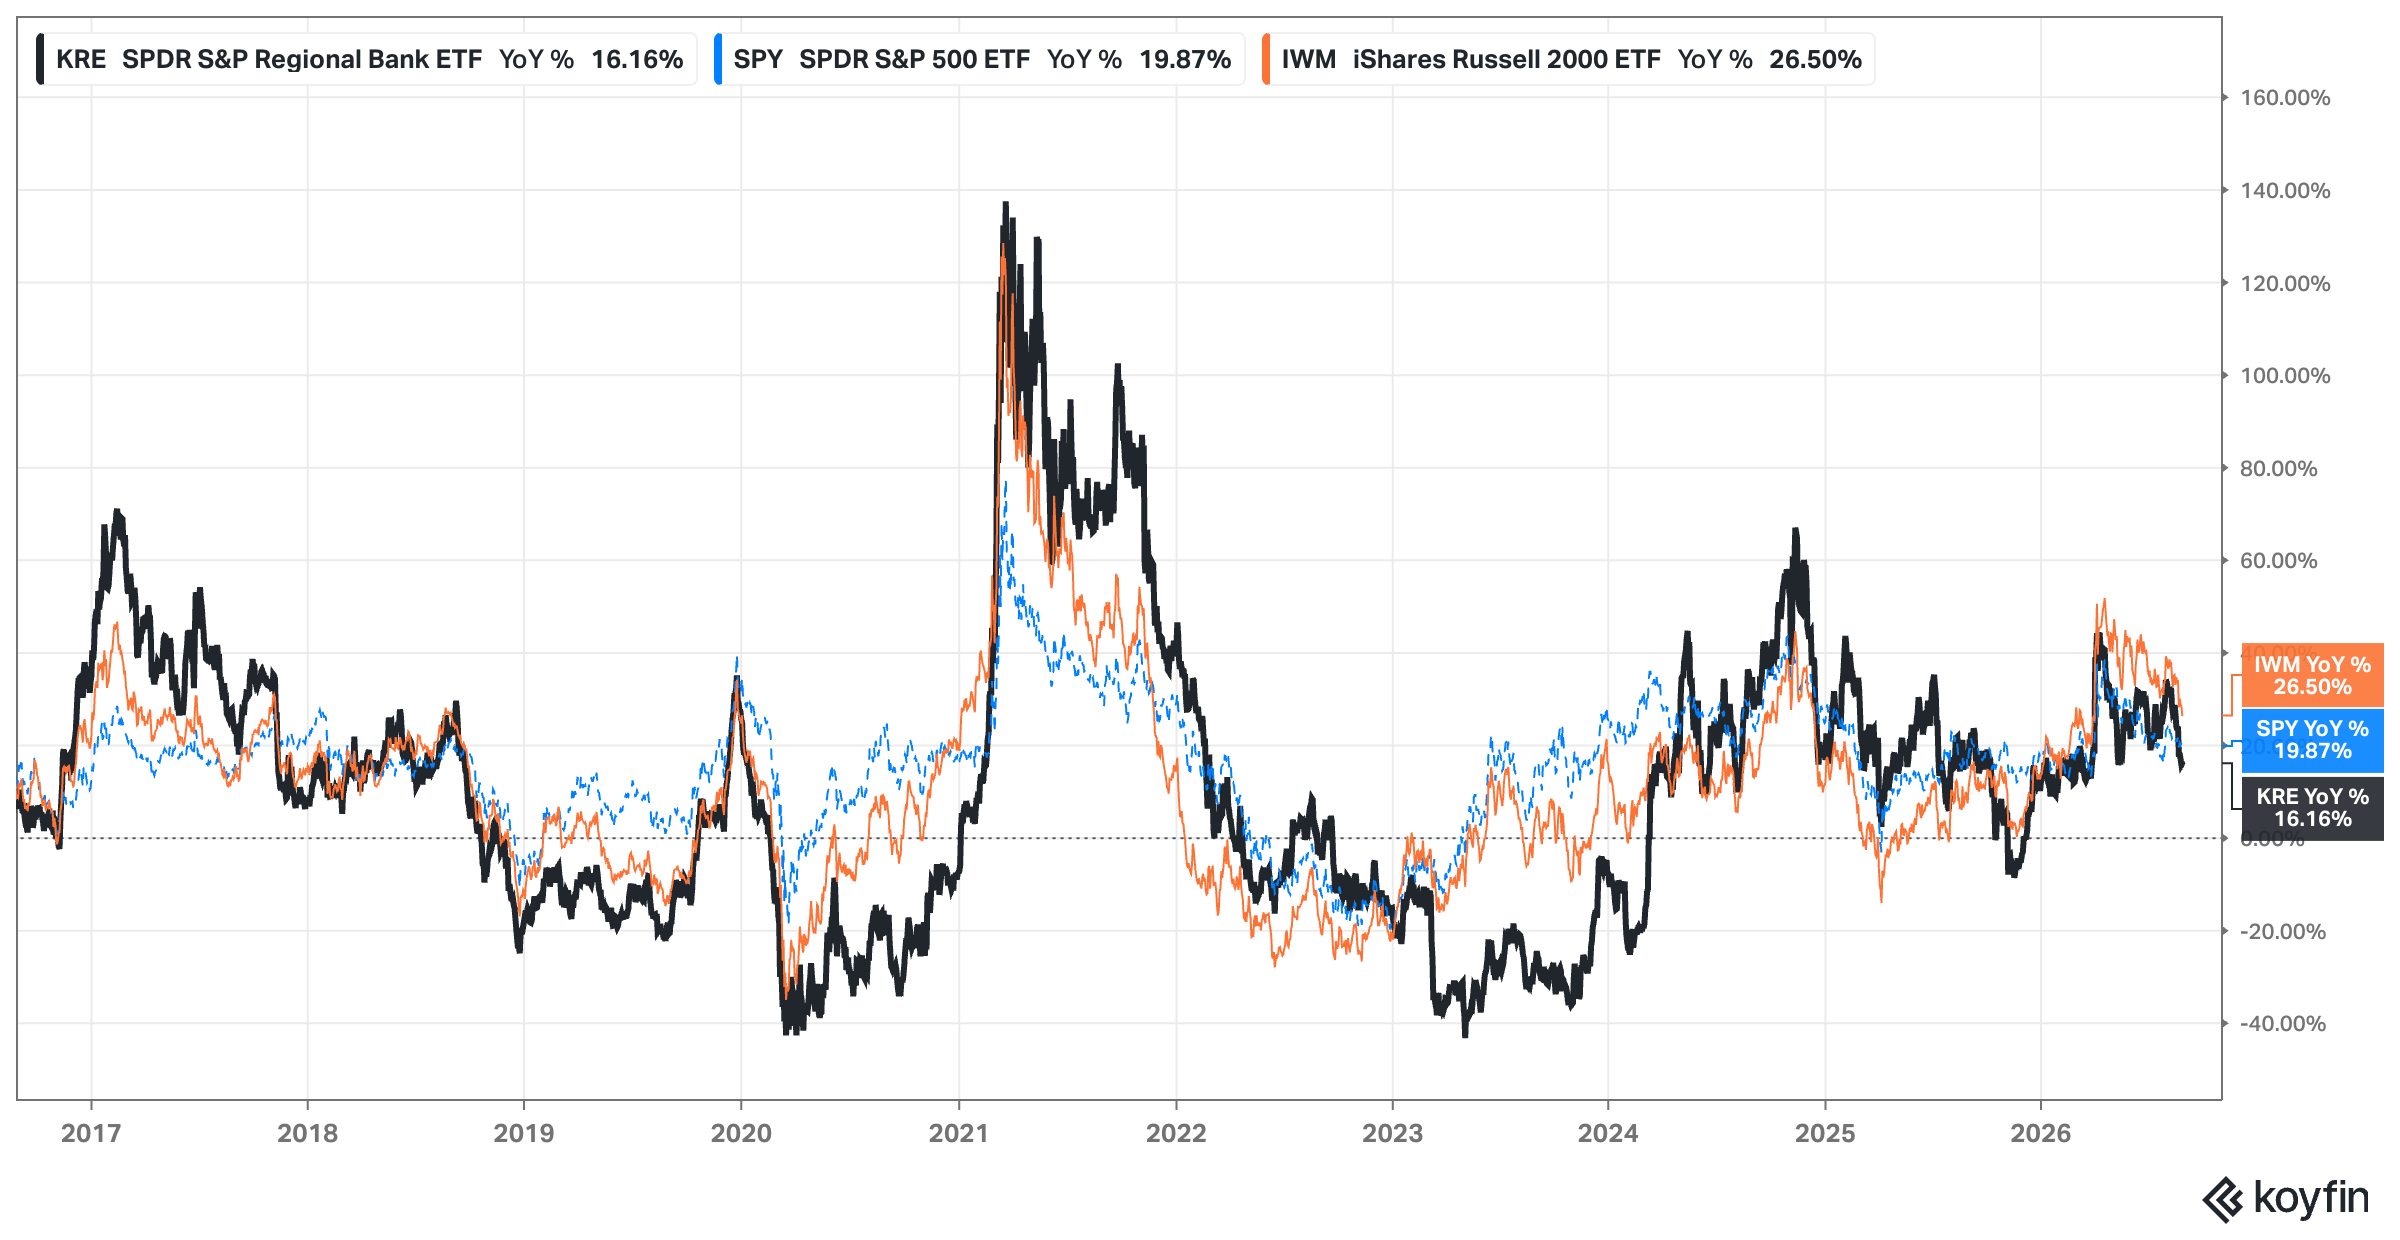
Analysis: KRE uptrend has been broken. Setting the AMAT Clock Hour (ACH) to 2 o’clock.
ACH: 2 o’clock
Interest Rates: FED, 2yr, 10yr, and 30yr Rates
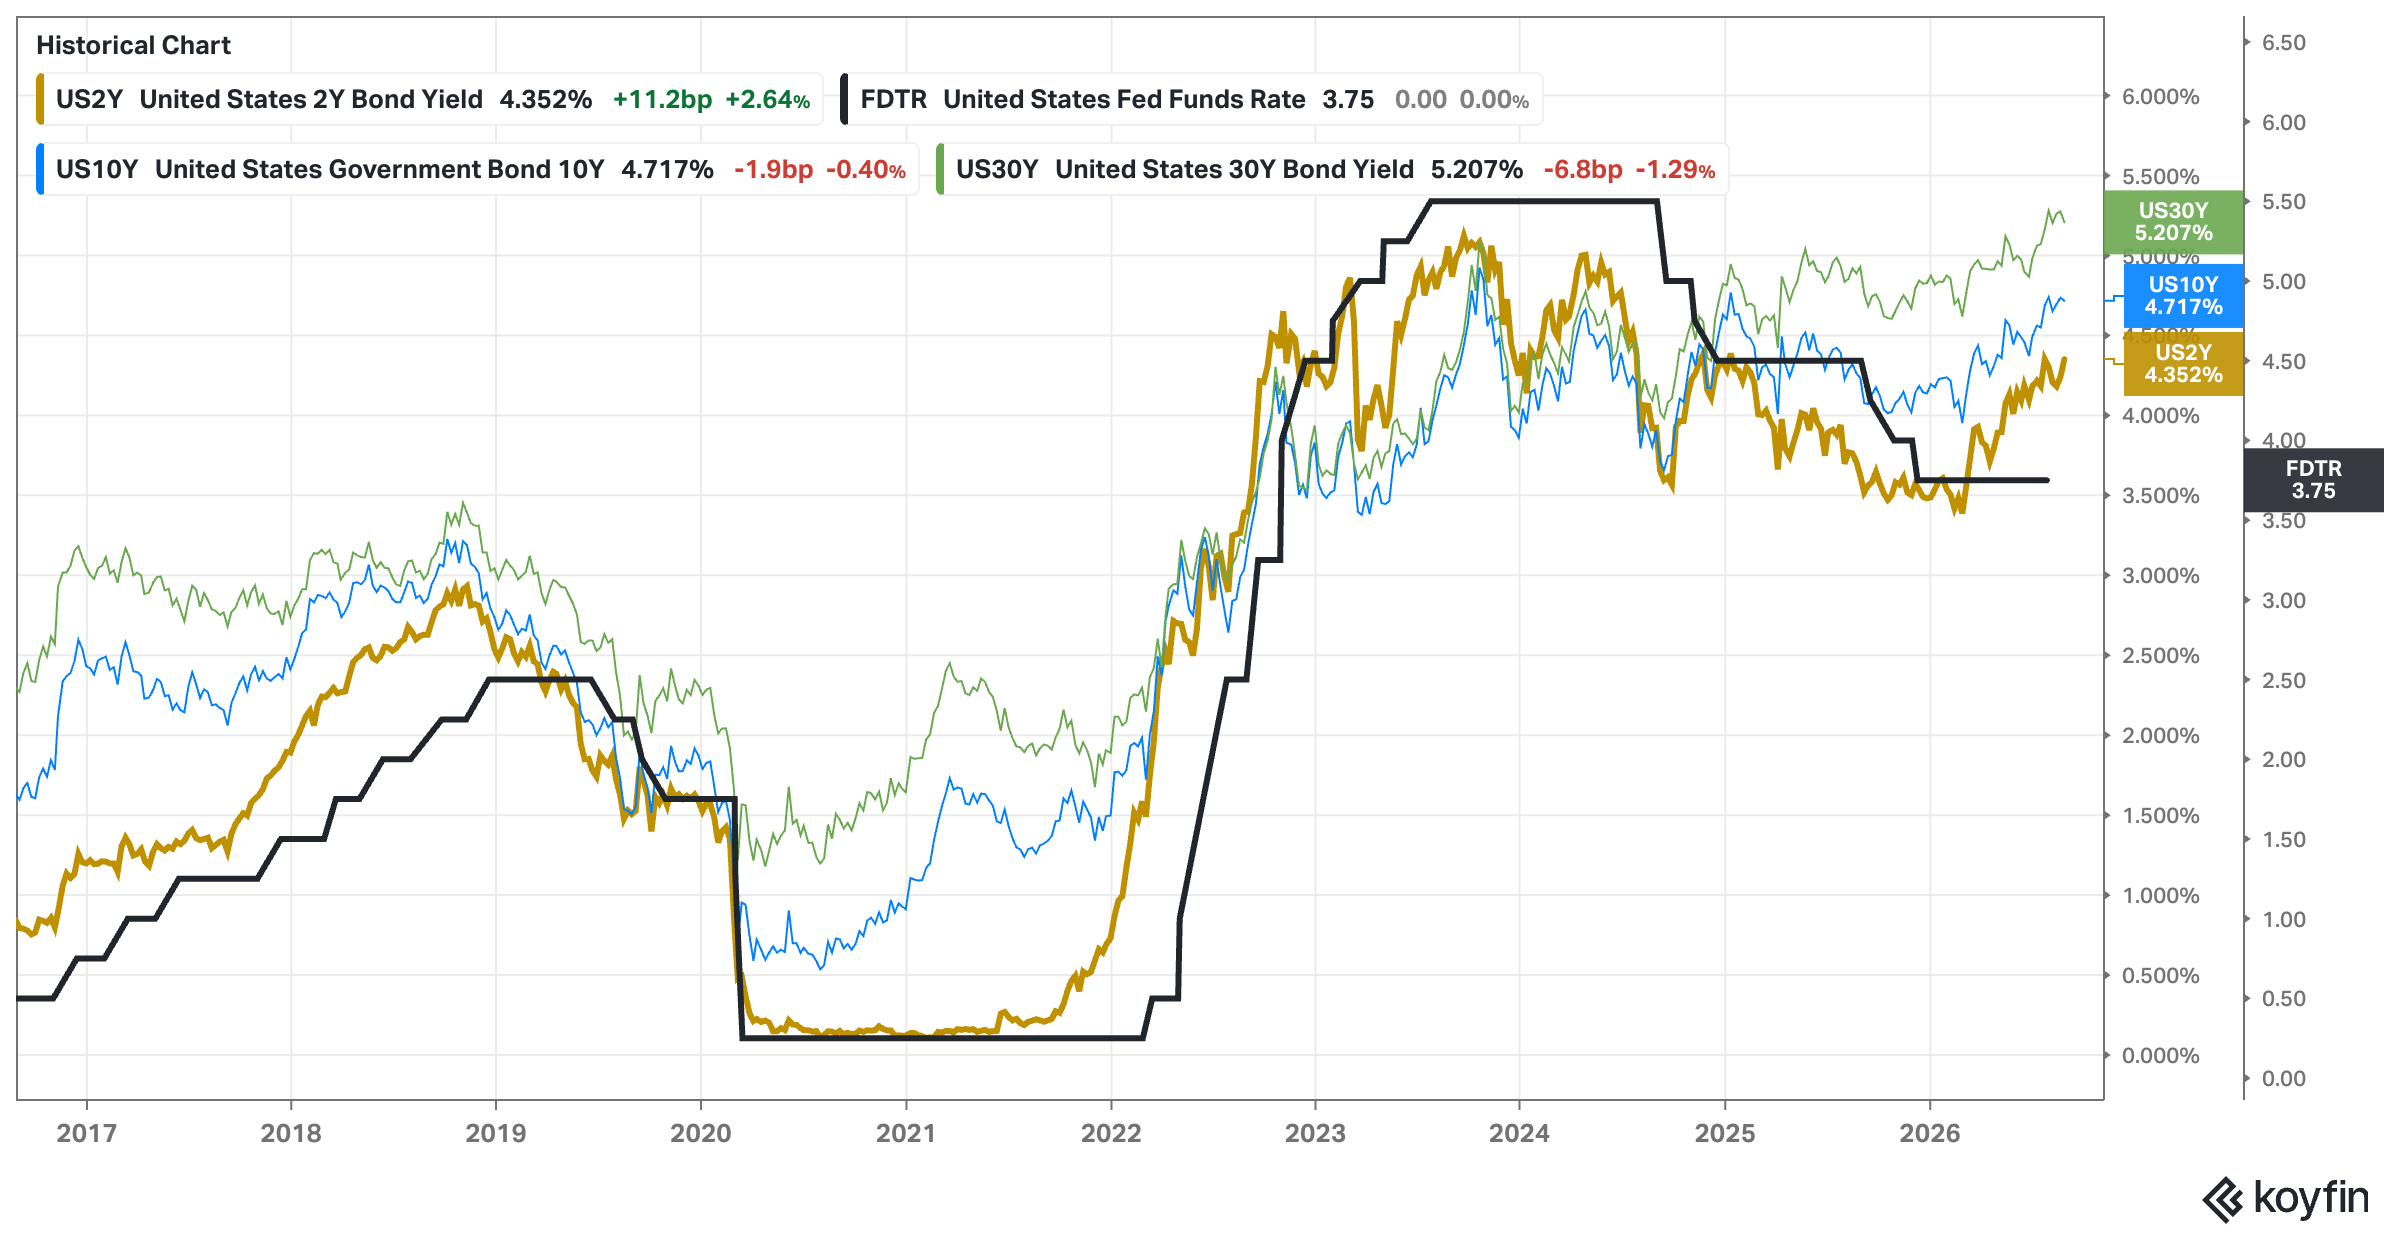
Analysis: Fed’s QE 2.0 didn’t work… this starts to get ugly… Setting the ACH to 11 o’clock but the color to blue as in the rates case the lower the better.
ACH (inverted color): 11 o’clock
Indexes: What is happening?
TA: Price Action, Trend, Momentum & Volume:
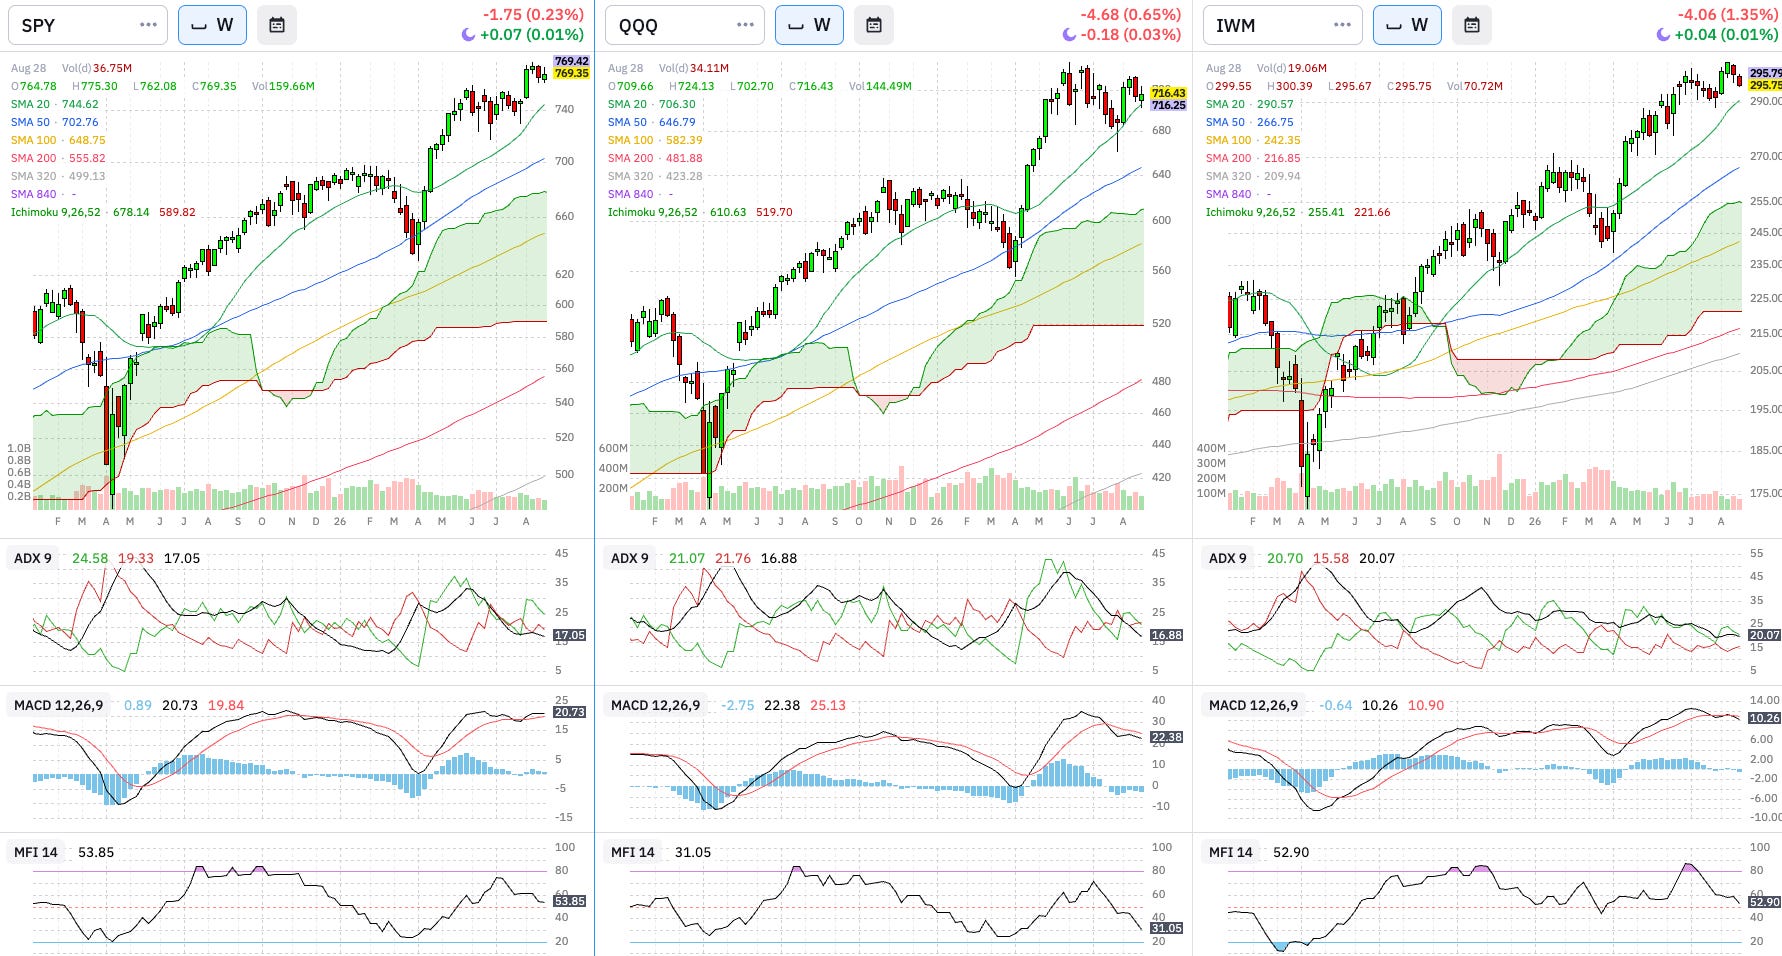
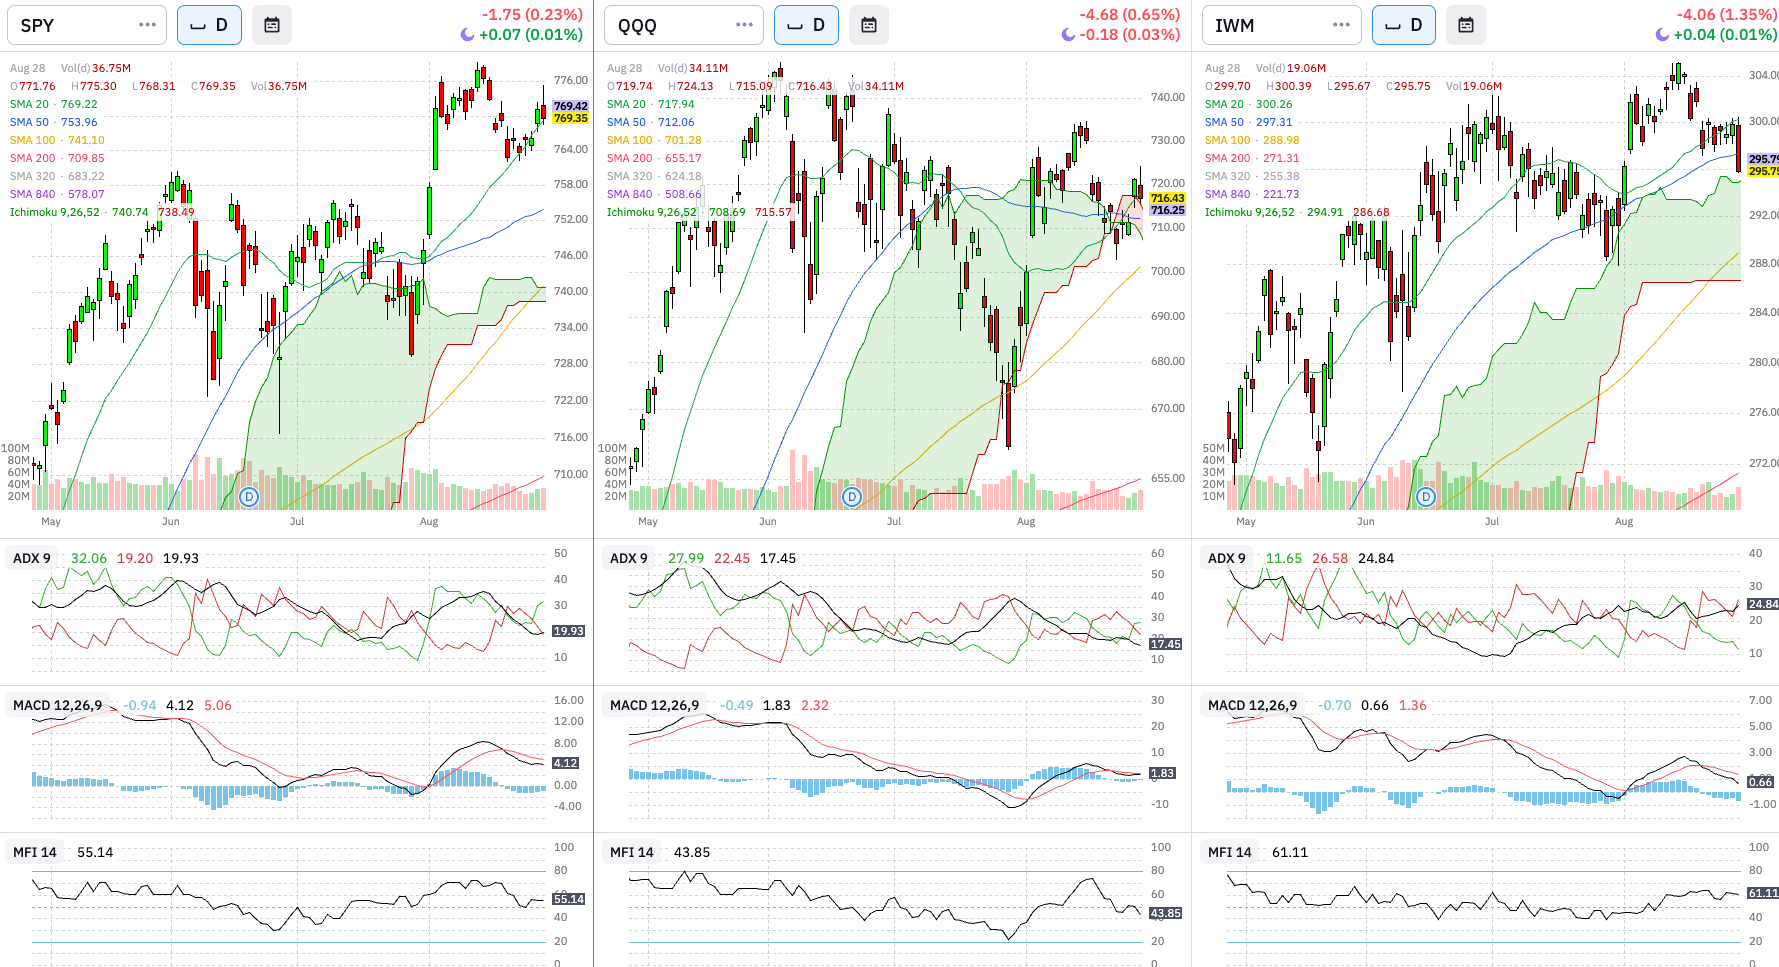
Weekly & Daily SPY, QQQ, and IWM
Technical Analysis:
Price (SMAs & Cloud): Weekly: All indices in an uptrend. Daily: SPY found support in the 20D SMA. QQQ crossed up and down both 20D and 50D SMAs and even went below the Cloud. IWM was in a weak uptrend until Friday due to Fed’s comments. ACH: 2 o’clock
Trend (ADX): Weekly: ADX strength very weak in all markets. Daily: ADX for SPY is very weak and for IWM is strong but towards a bearish trend. ACH: 2 o’clock
Momentum (MACD): Weekly: SPY at 12 o’clock, QQQ at 2 o’clock, and IWM at 1 o’clock with a bearish divergence. Daily: All in bearish divergences. ACH: 3 o’clock
Volume (MFI): Weekly: All indices have bearish divergences. Daily: SPY and QQQ on downtrends. IWM has no clear signal. ACH: 3 o’clock
Breadth: % Stocks above SMAs
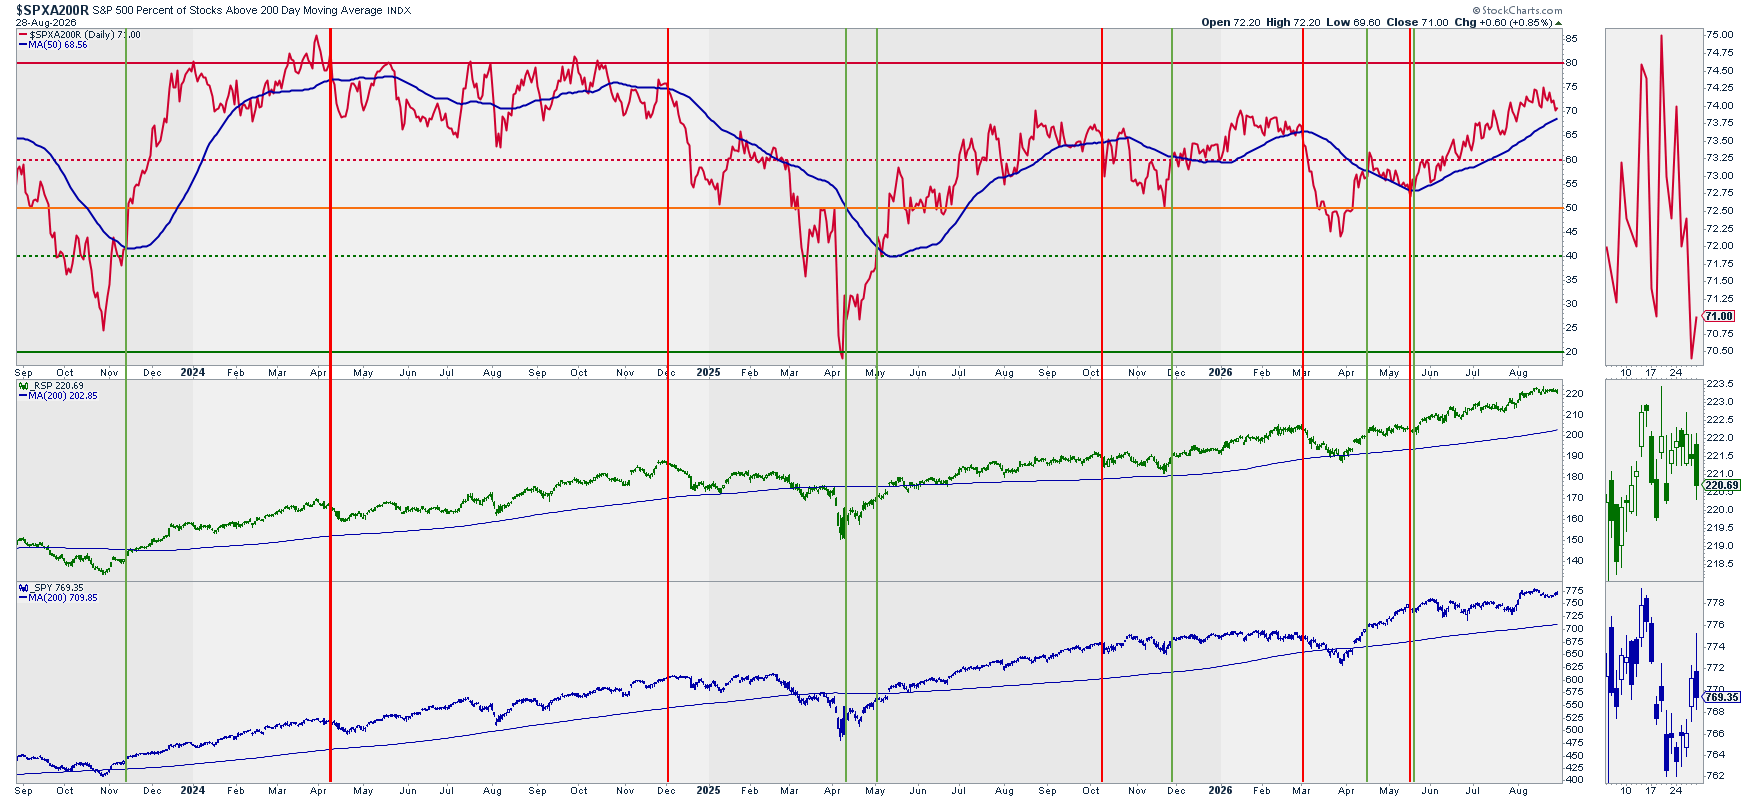
Above 200 Daily SMA
Above 20, 50, and 200 Daily SMAs vs. RSP
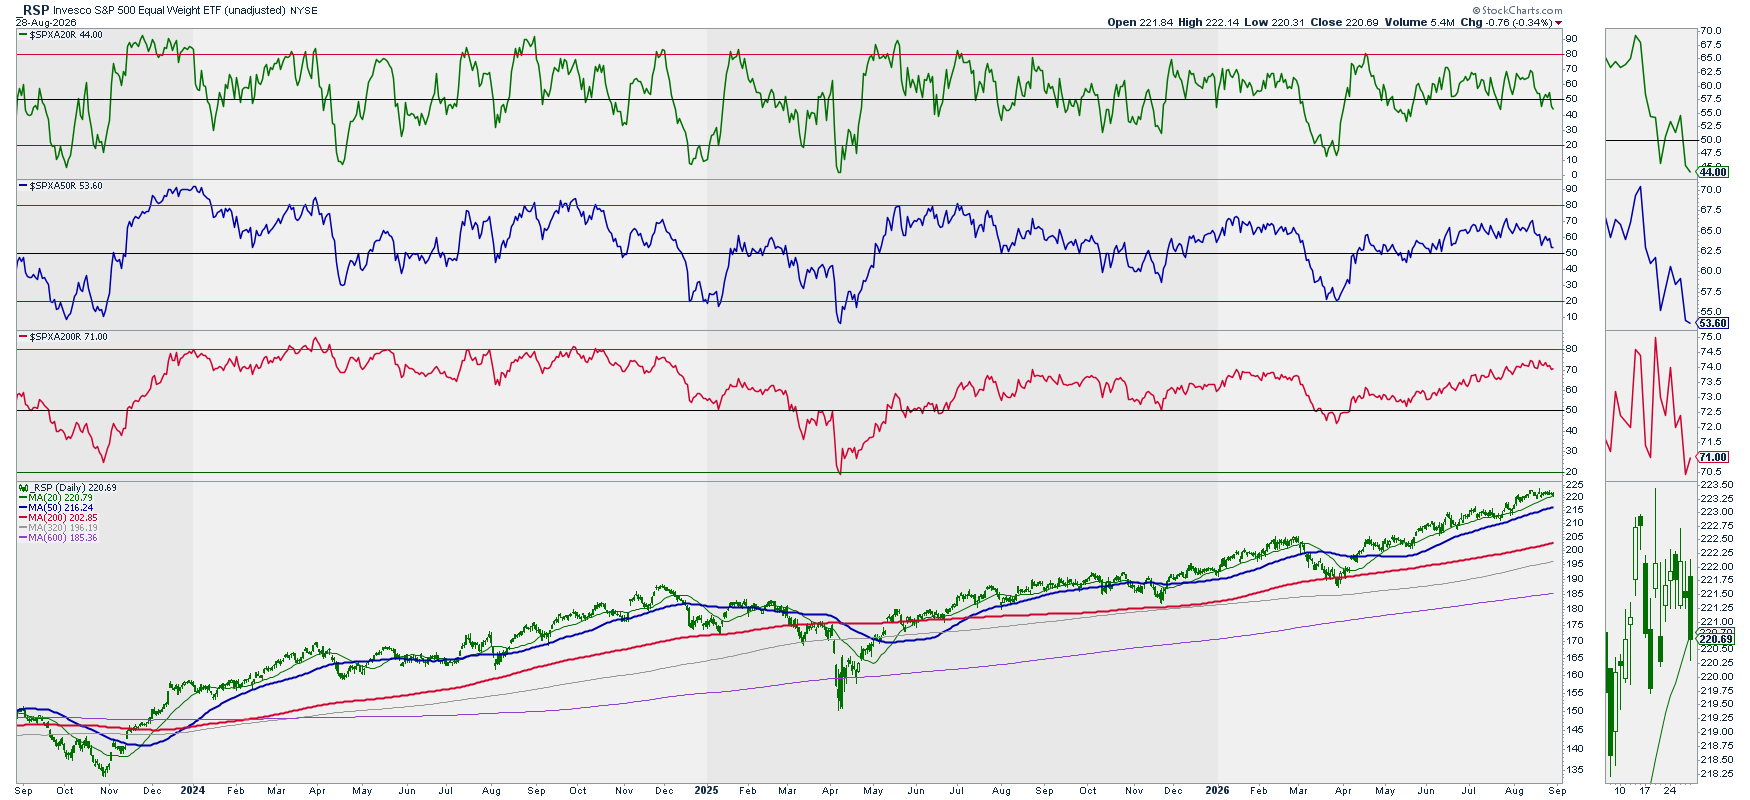
Analysis: % of stocks above their 20D SMA crossed below level 50 and we can also see a bearish trend in the % of stocks above their 50D SMA. 200D SMA is still above the signal line but with a clear downtrend as well.
ACH: 2 o’clock (200D at 1 o’clock; 50D at 2 o’clock; 20D at 3 o’clock)
Volatility: Ratio Low Vol. Stocks / SPY vs. RSP & SPY
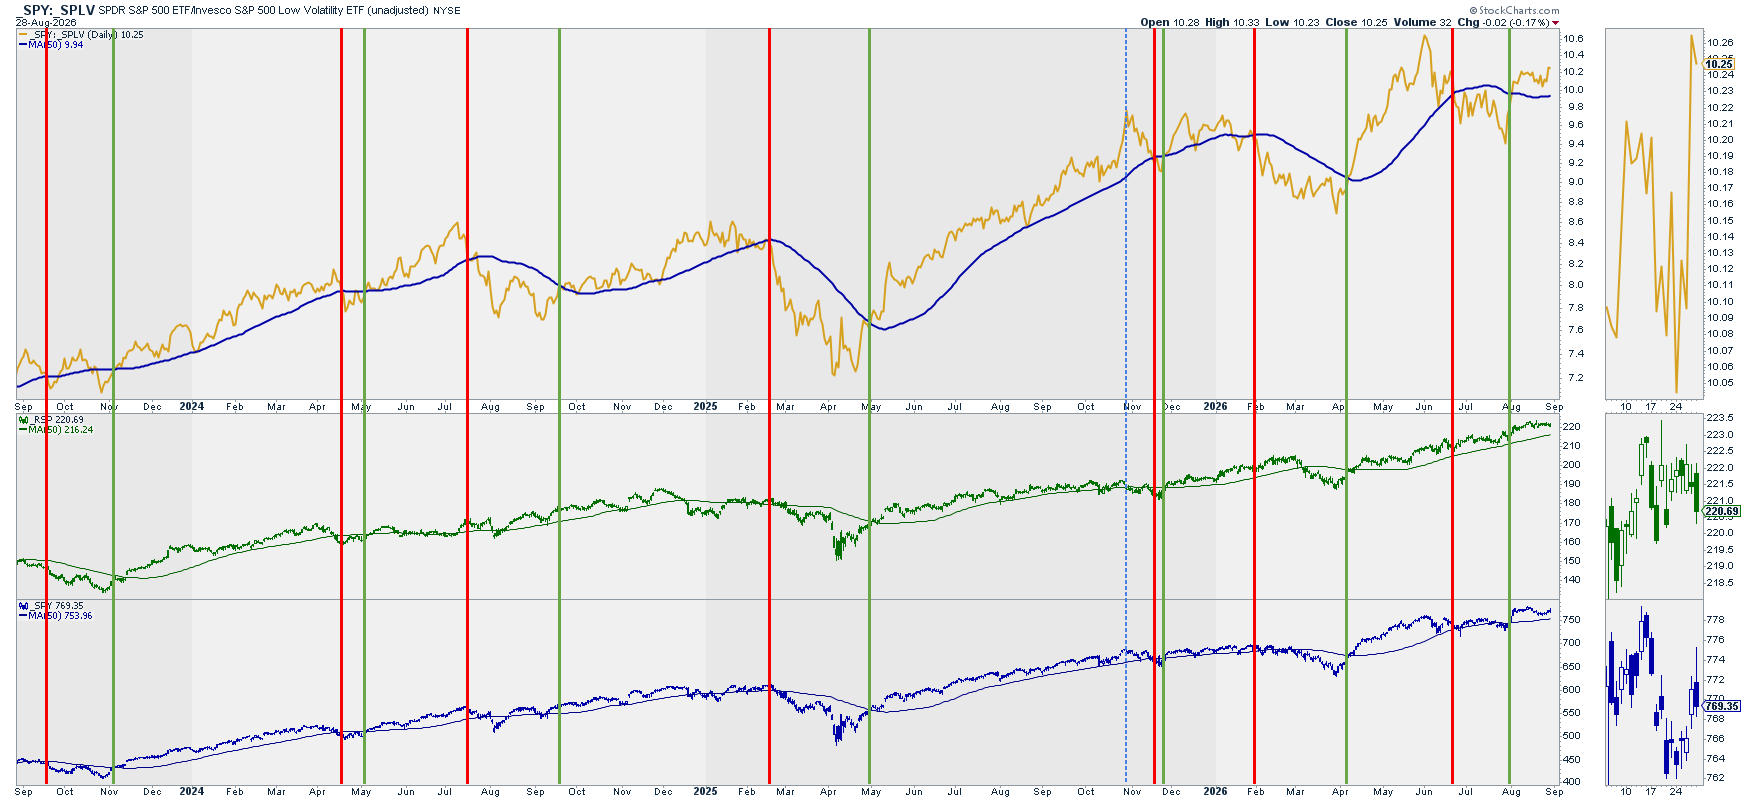
Analysis: Ratio remains above the signal line (50D SMA).
ACH: 9 o’clock
Volatility: (Inverted) VIX vs. SPY
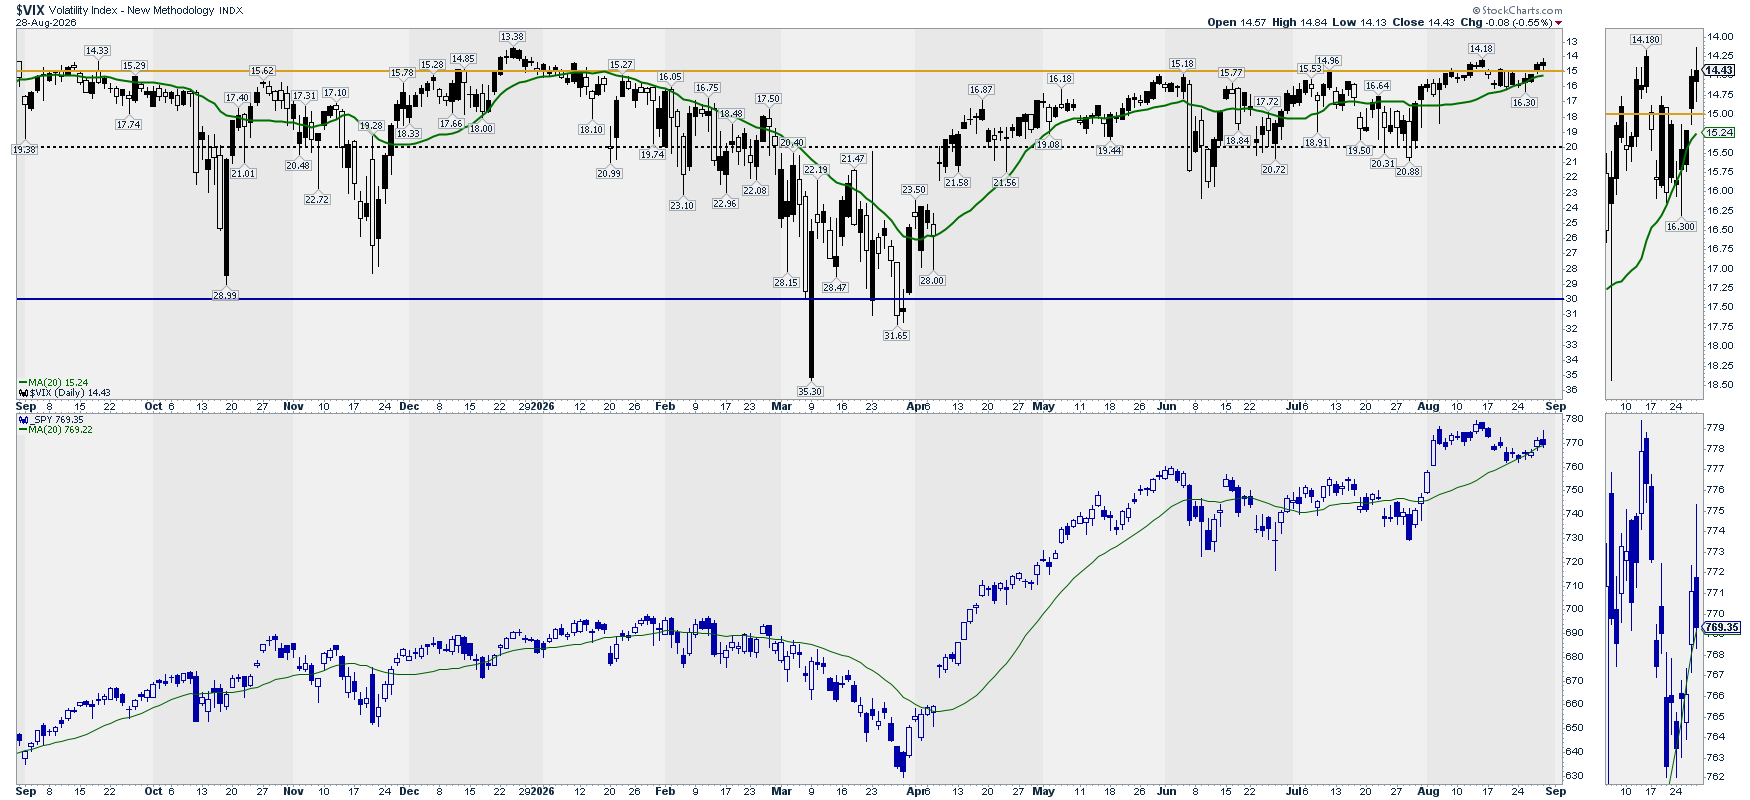
Note: This chart is mainly to detect extreme volatility situations that, once they reverse, offer great long opportunities in the market.
Analysis: Low VIX readings in quite a flat trend. There is no much signal here.
ACH: 12 o’clock
Options: (Inverted) Put/Call Ratio vs. SPY
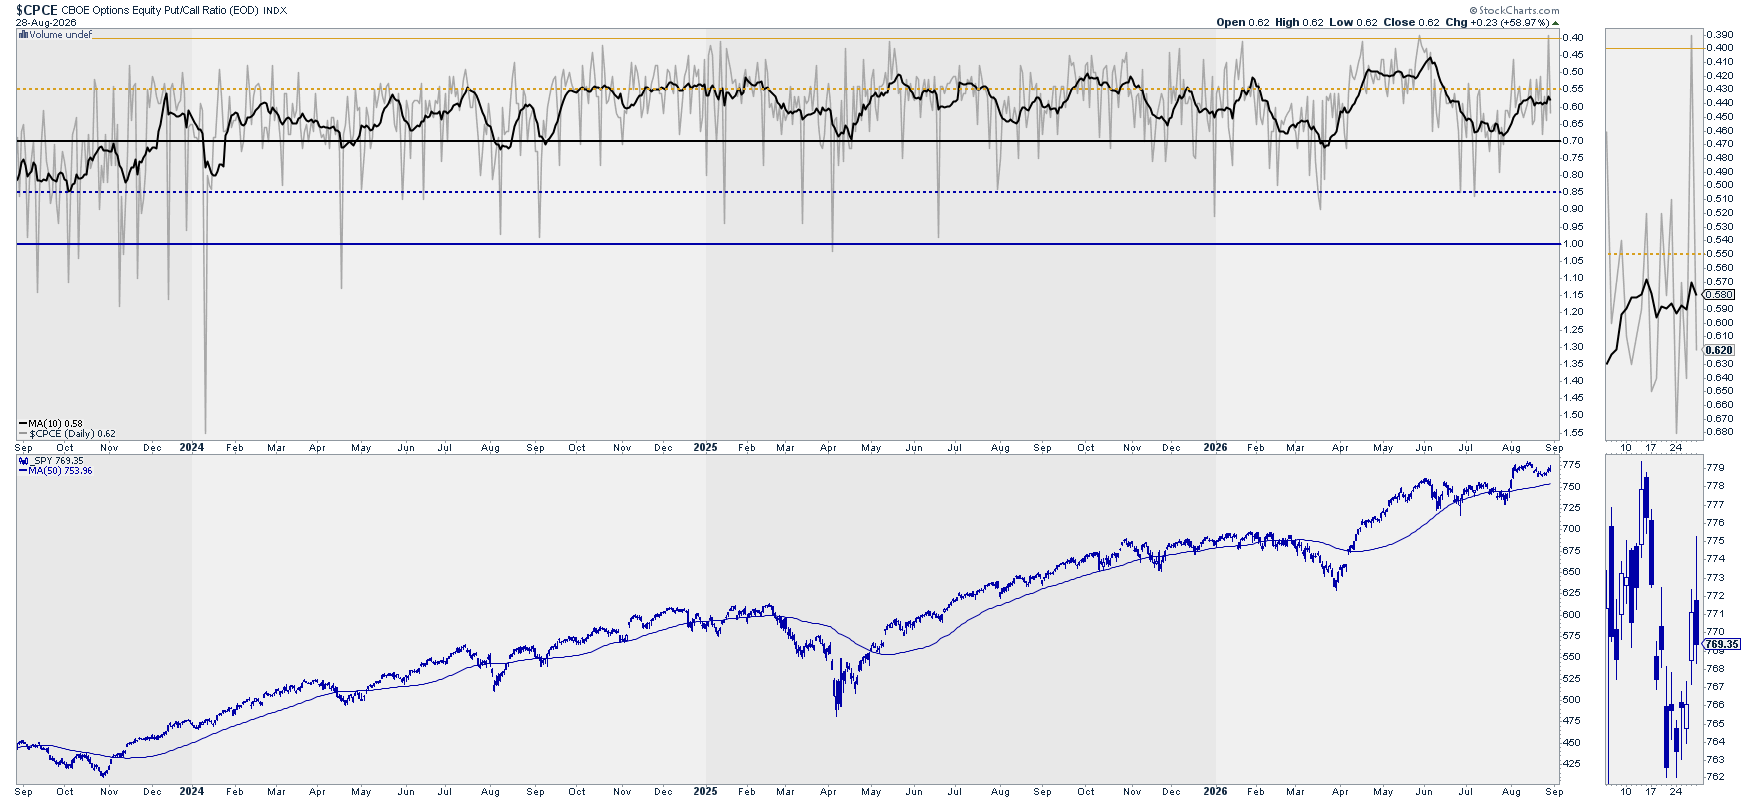
Analysis: P/C ratio uptrend continues.
ACH: 9 o’clock
Options: Gamma Exposure – SPY
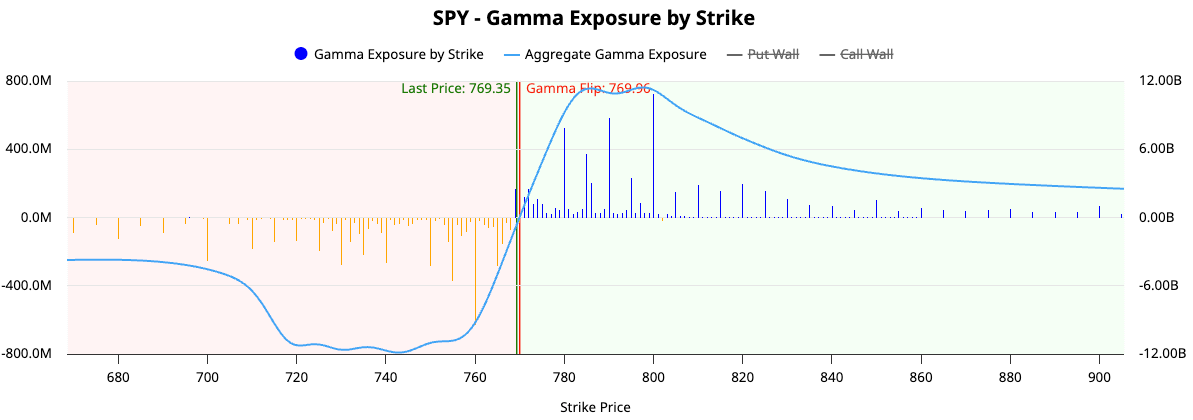
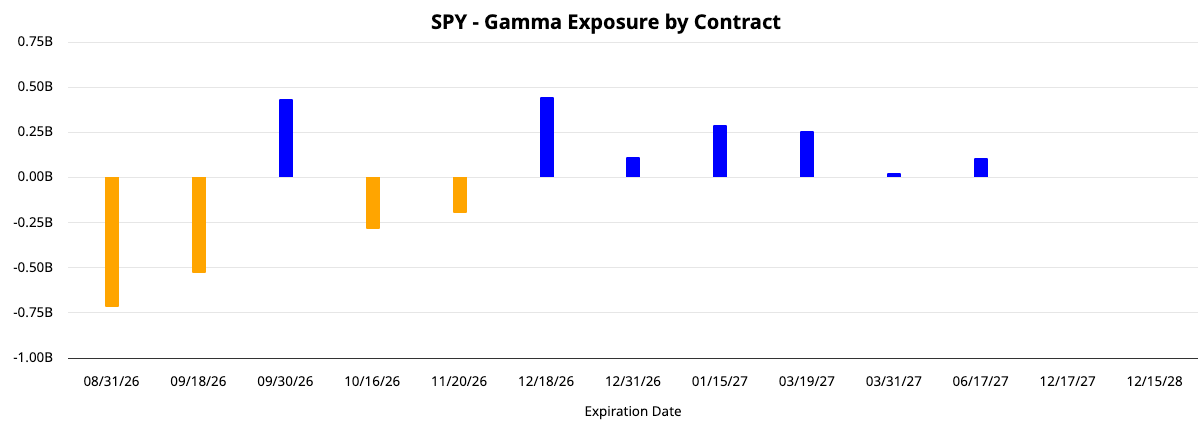
Analysis: After evaluating GEX for many months, I realized that for us does not have any forecast ability beyond showing where the “option walls” are. So GEX will not have outlook not AMAT Cycle Hour.
Upper wall(s): 780 & 800
Lower wall(s): 760
Sectors: Where is it happening?
Sectors Rotation
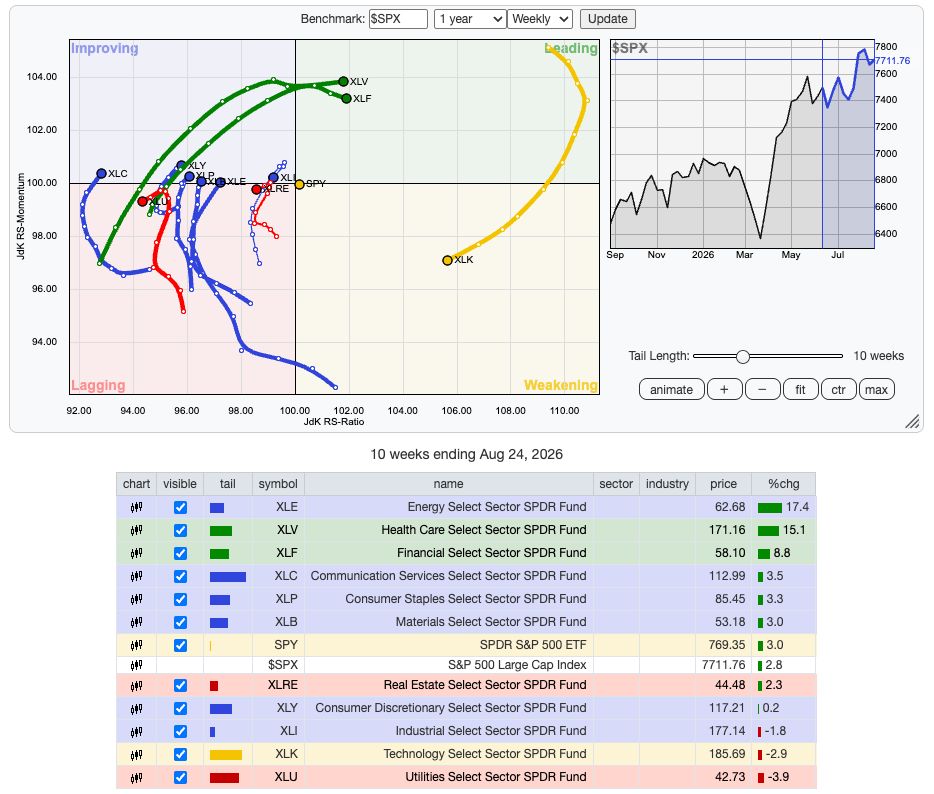
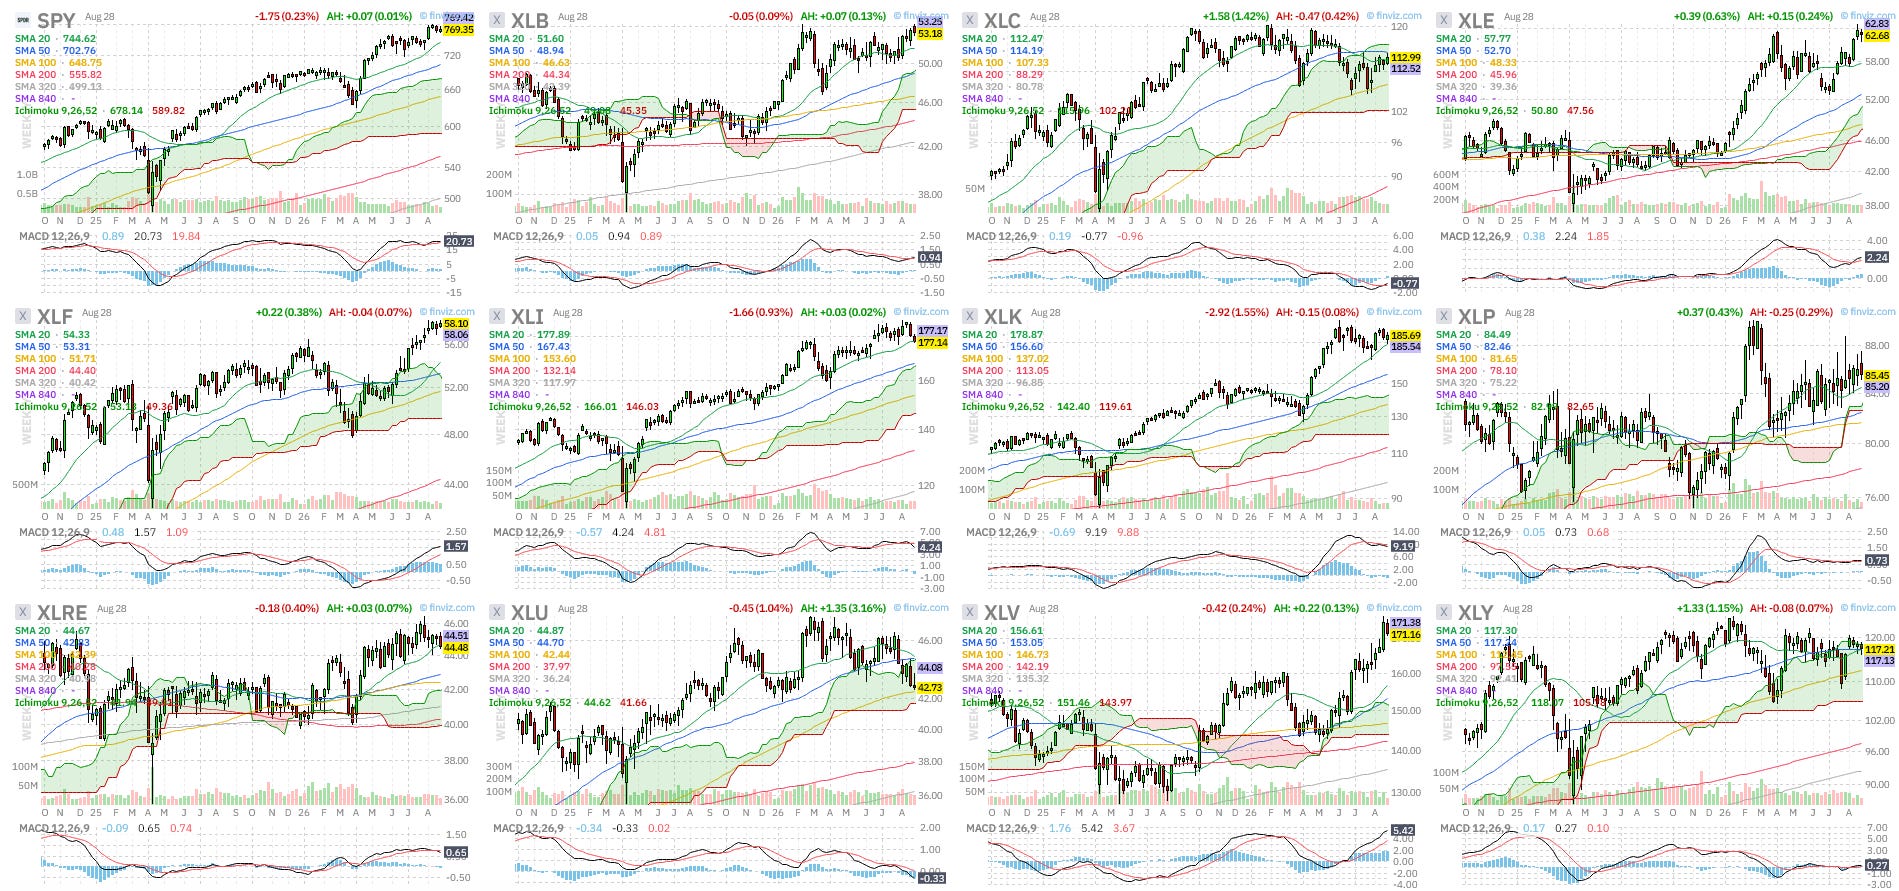
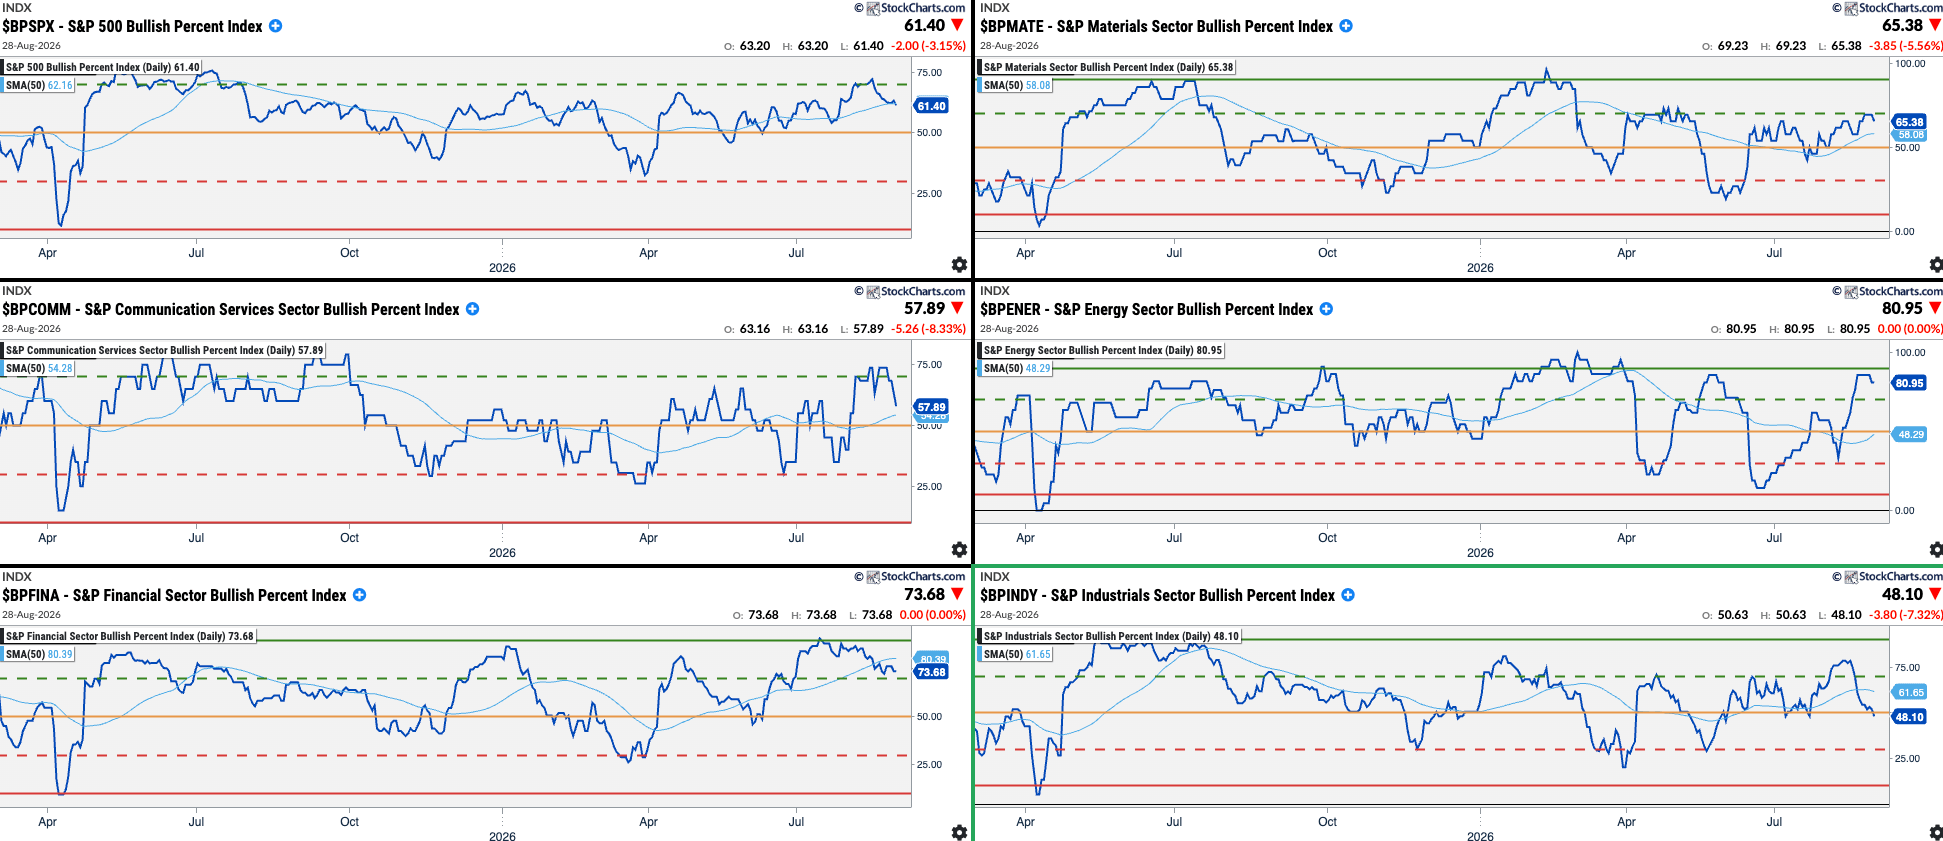
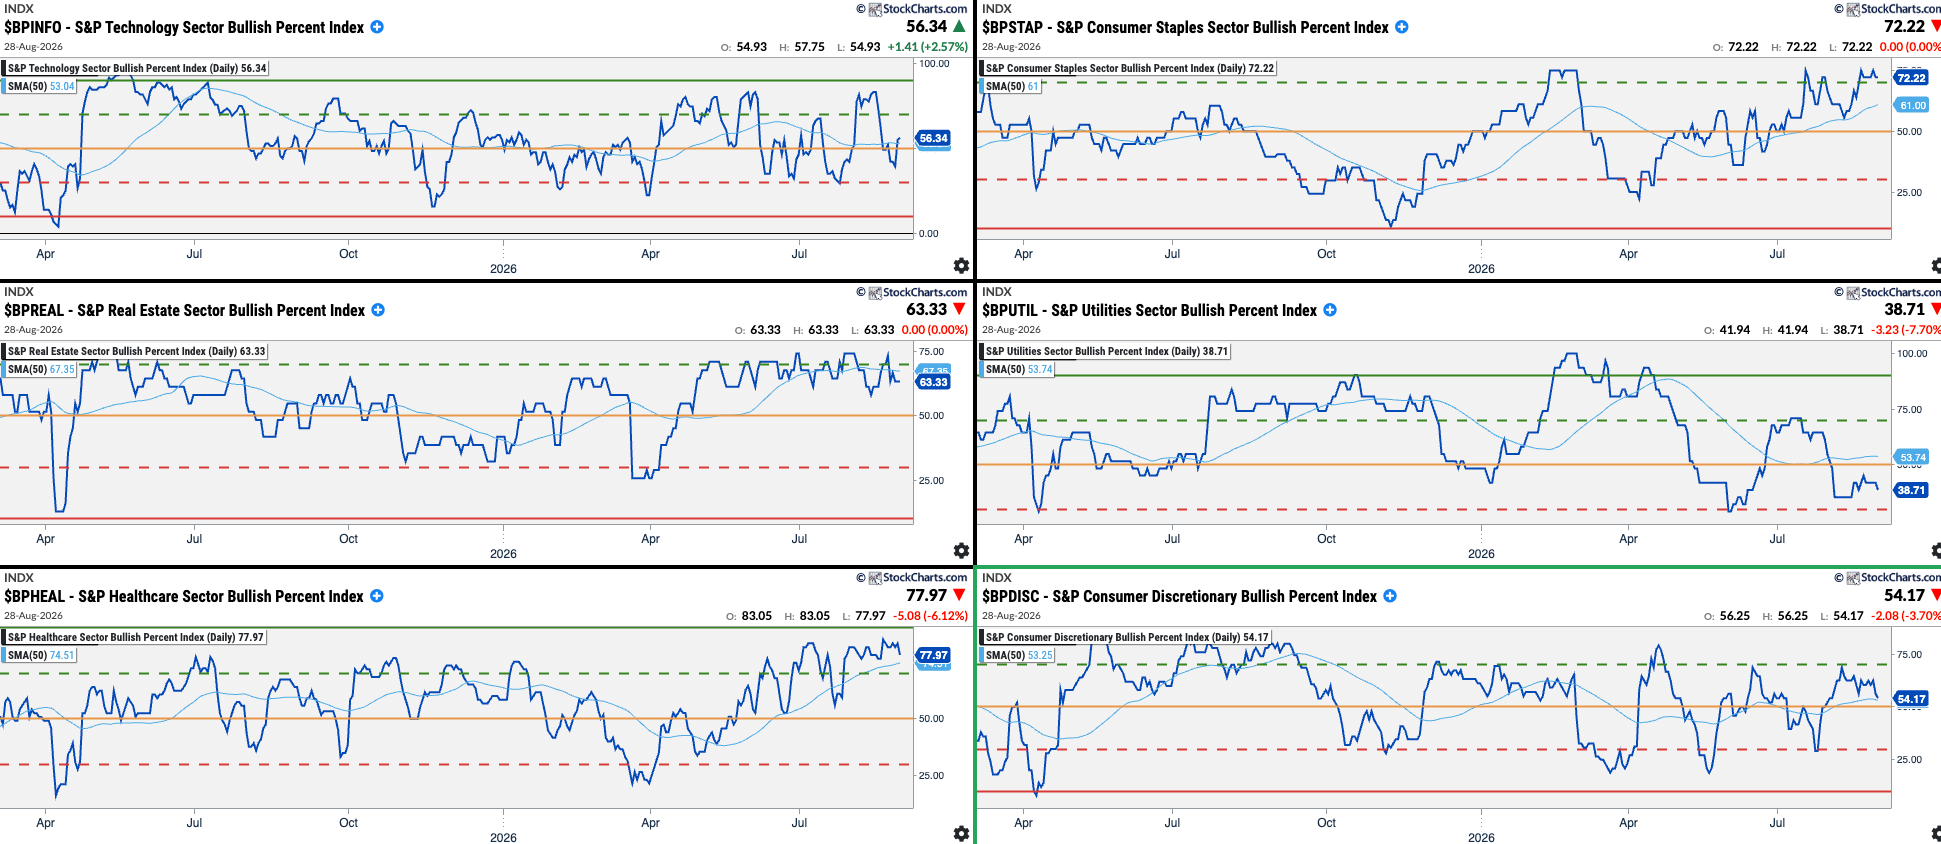
Summary:


Last Word
About the US Rates
Those of us that follow the US market, living or not there, sometimes make the mistake to think that they are the only markets in the world. Zooming out, looking at other markets, can provide a much necessary perspective in times when we need to better understand market behaviour (or misbehaviour).
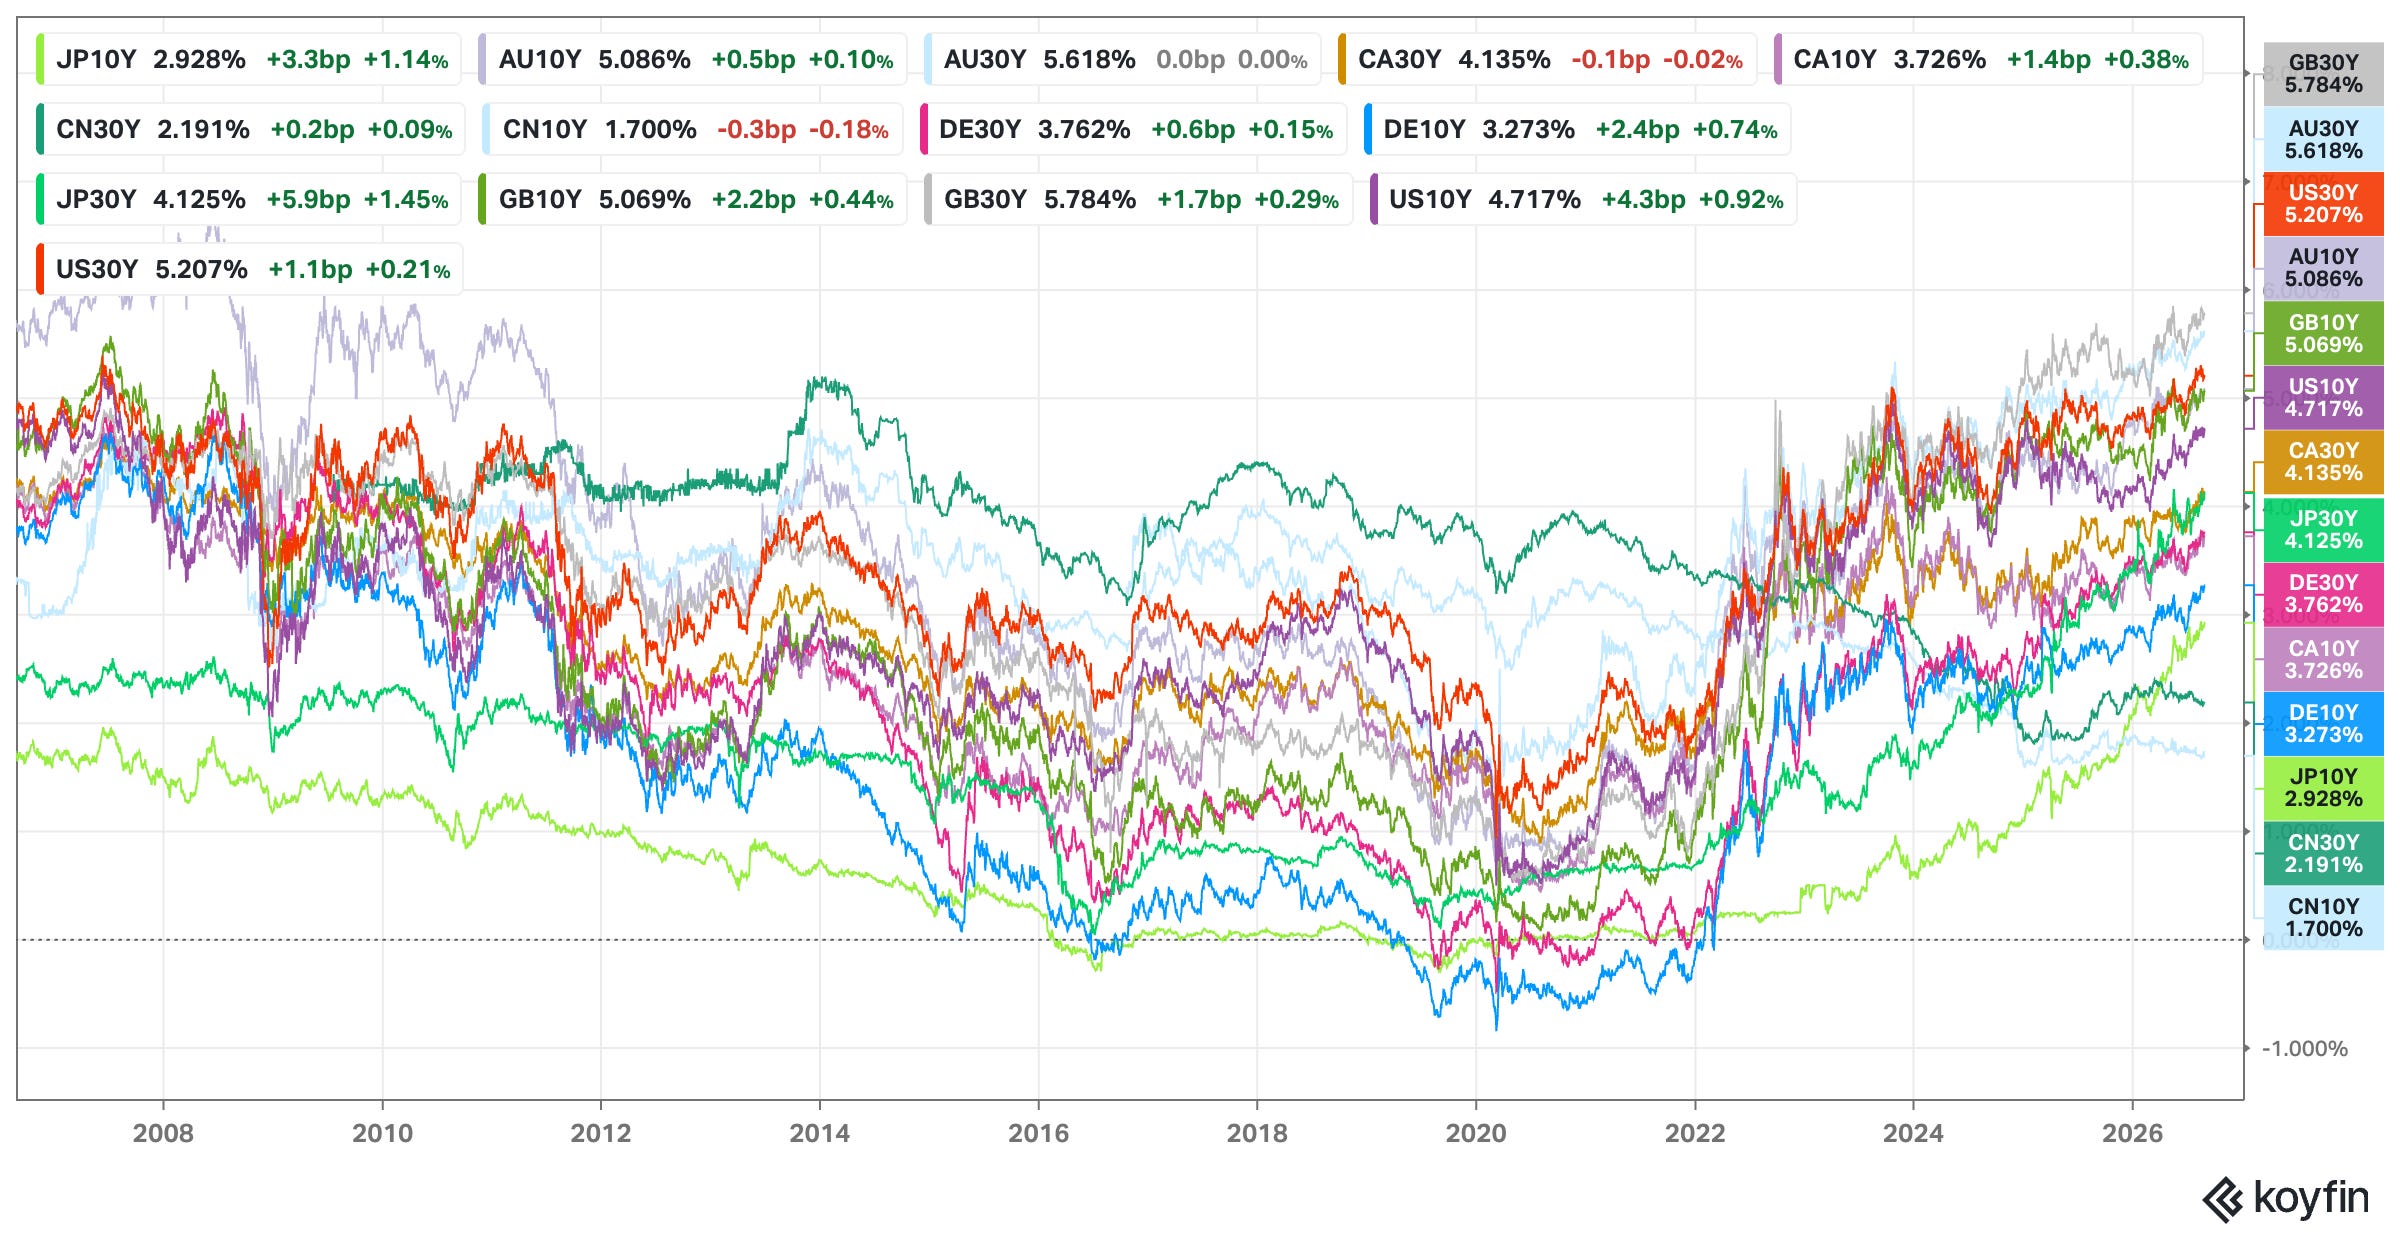
When it comes to US debt rates is worth to do the same. Raising long-term rates is not a unique event happening in the US but globally with the exception of China. Both UK and Australia have higher 30-year rates.
20 years of historical data:
10 years:
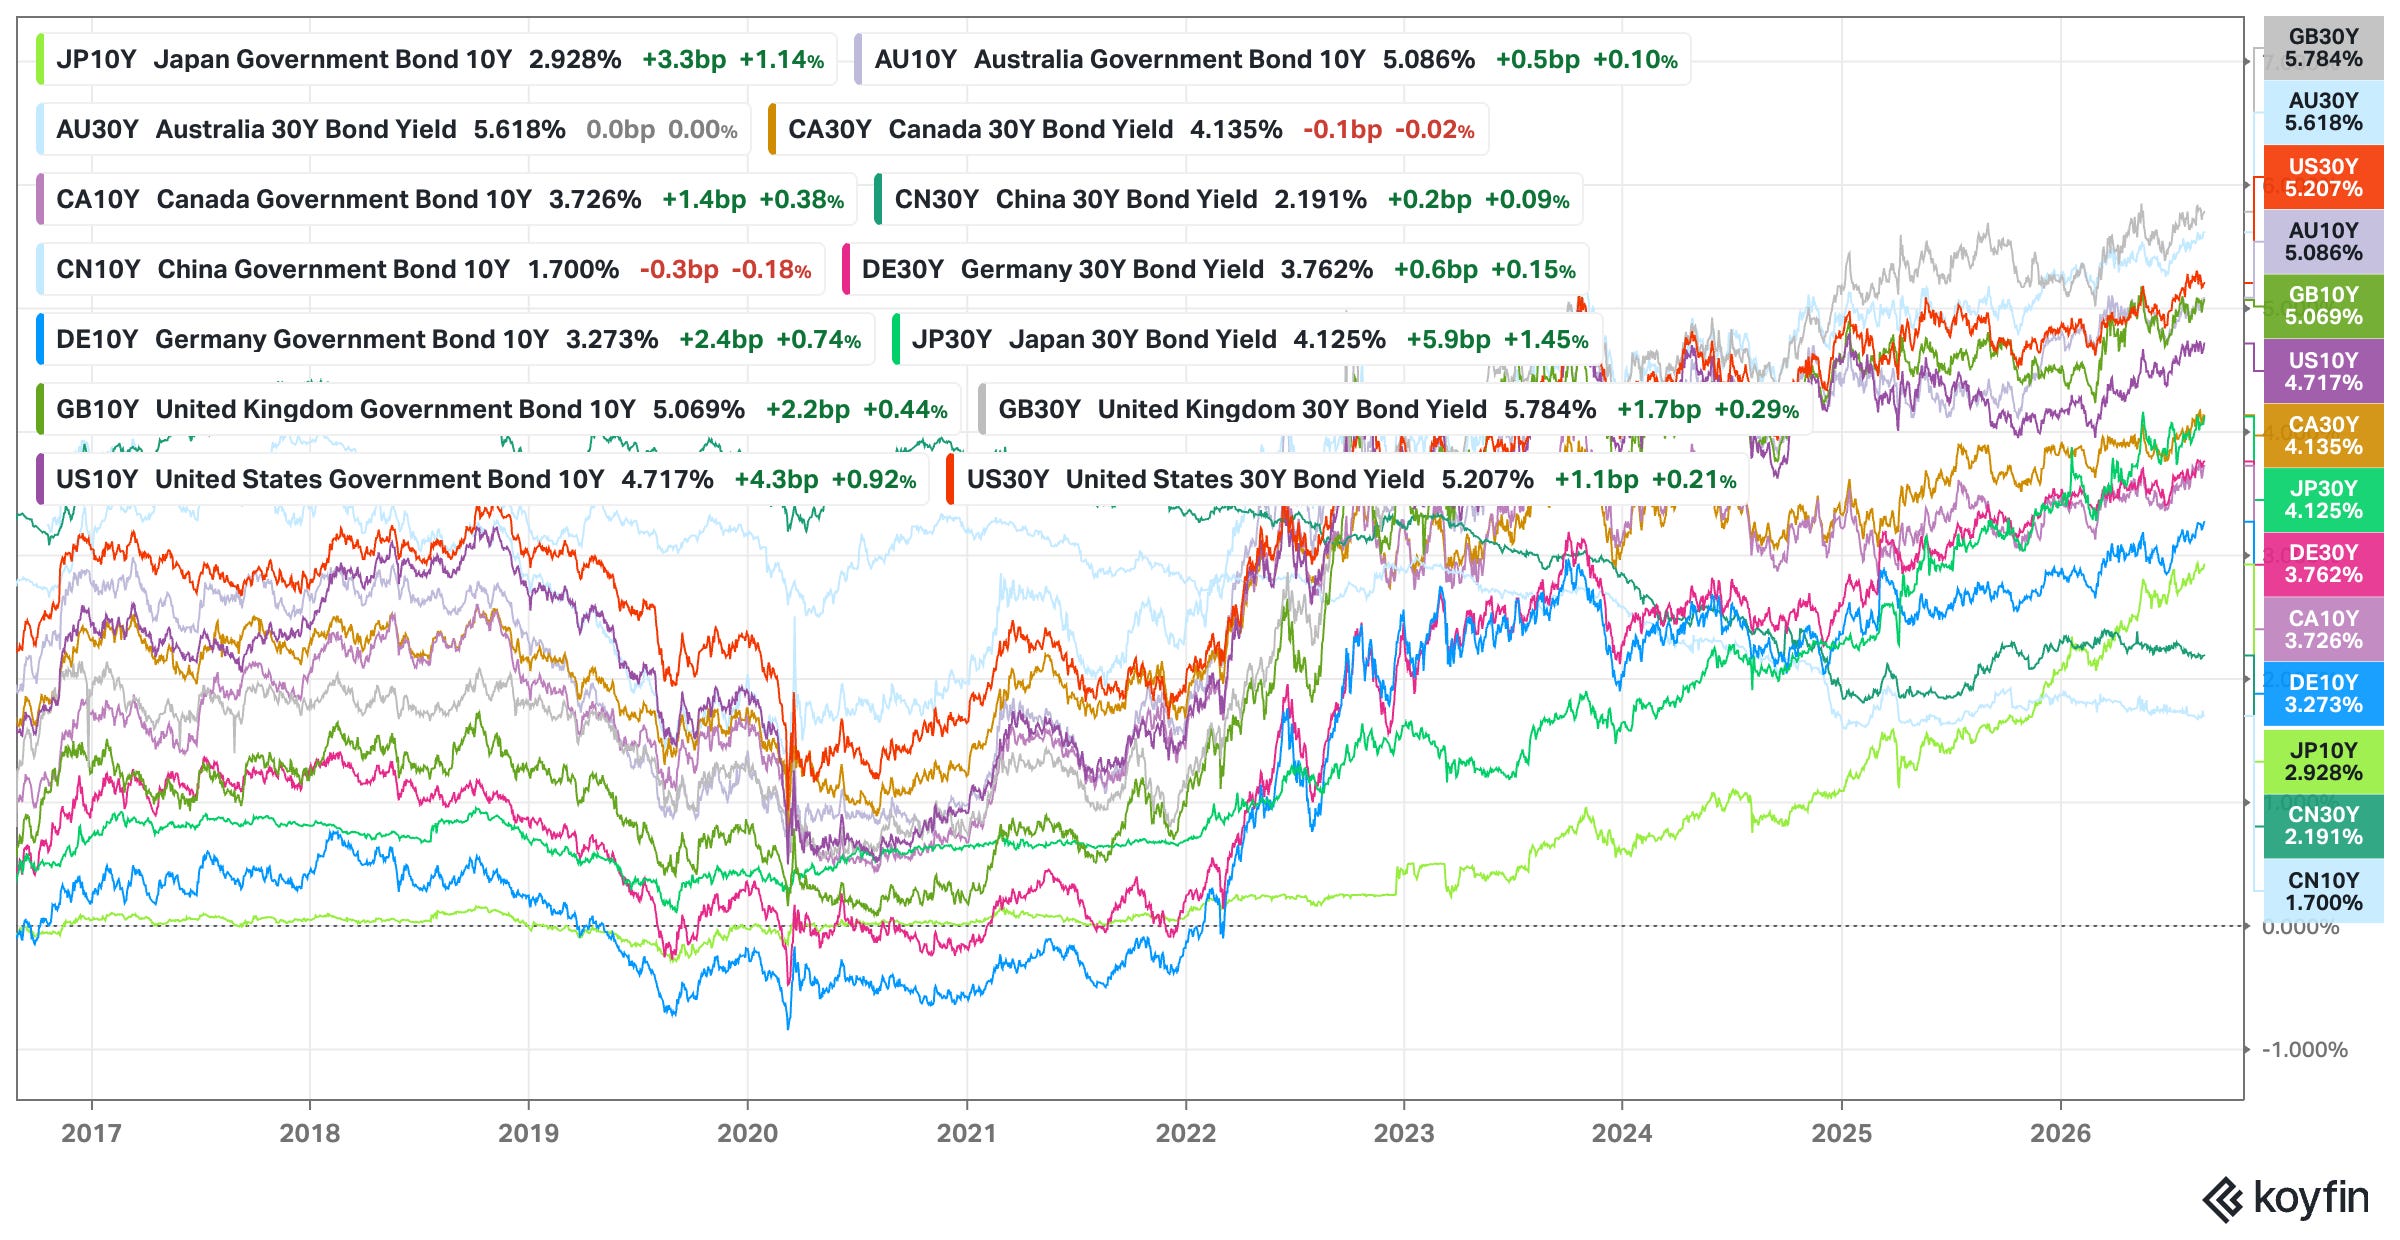
This does not reduces the severity of ever increasing debt and ever increasing debt repayment budget. Let’s say that misery loves company, and knowing that the US is not alone in this phenomenon provides some context to the actual situation.
The key question here is to know if rates increase because money prefers other areas of investment (AI, Biotech…), or increases due to the lack of trust in the issuing governments (does money trust China more than the US??)? Most probably the answer is ‘all of the above and more’, yet the question is in which percentages? growing at what speed? where is the ceiling? can the US do some sort of financial engineering to remediate this? We will see…
Disclaimer: The content on AMAT Investing is strictly for educational and learning purposes. The author is not a licensed financial advisor and holds no formal financial education. This post does not constitute professional financial advice. All investing involves risk of loss. Always conduct your own research and consult a licensed professional before making any investment decisions.