Context: Why is it happening?
Economic Production: ISM PMI vs. SPX
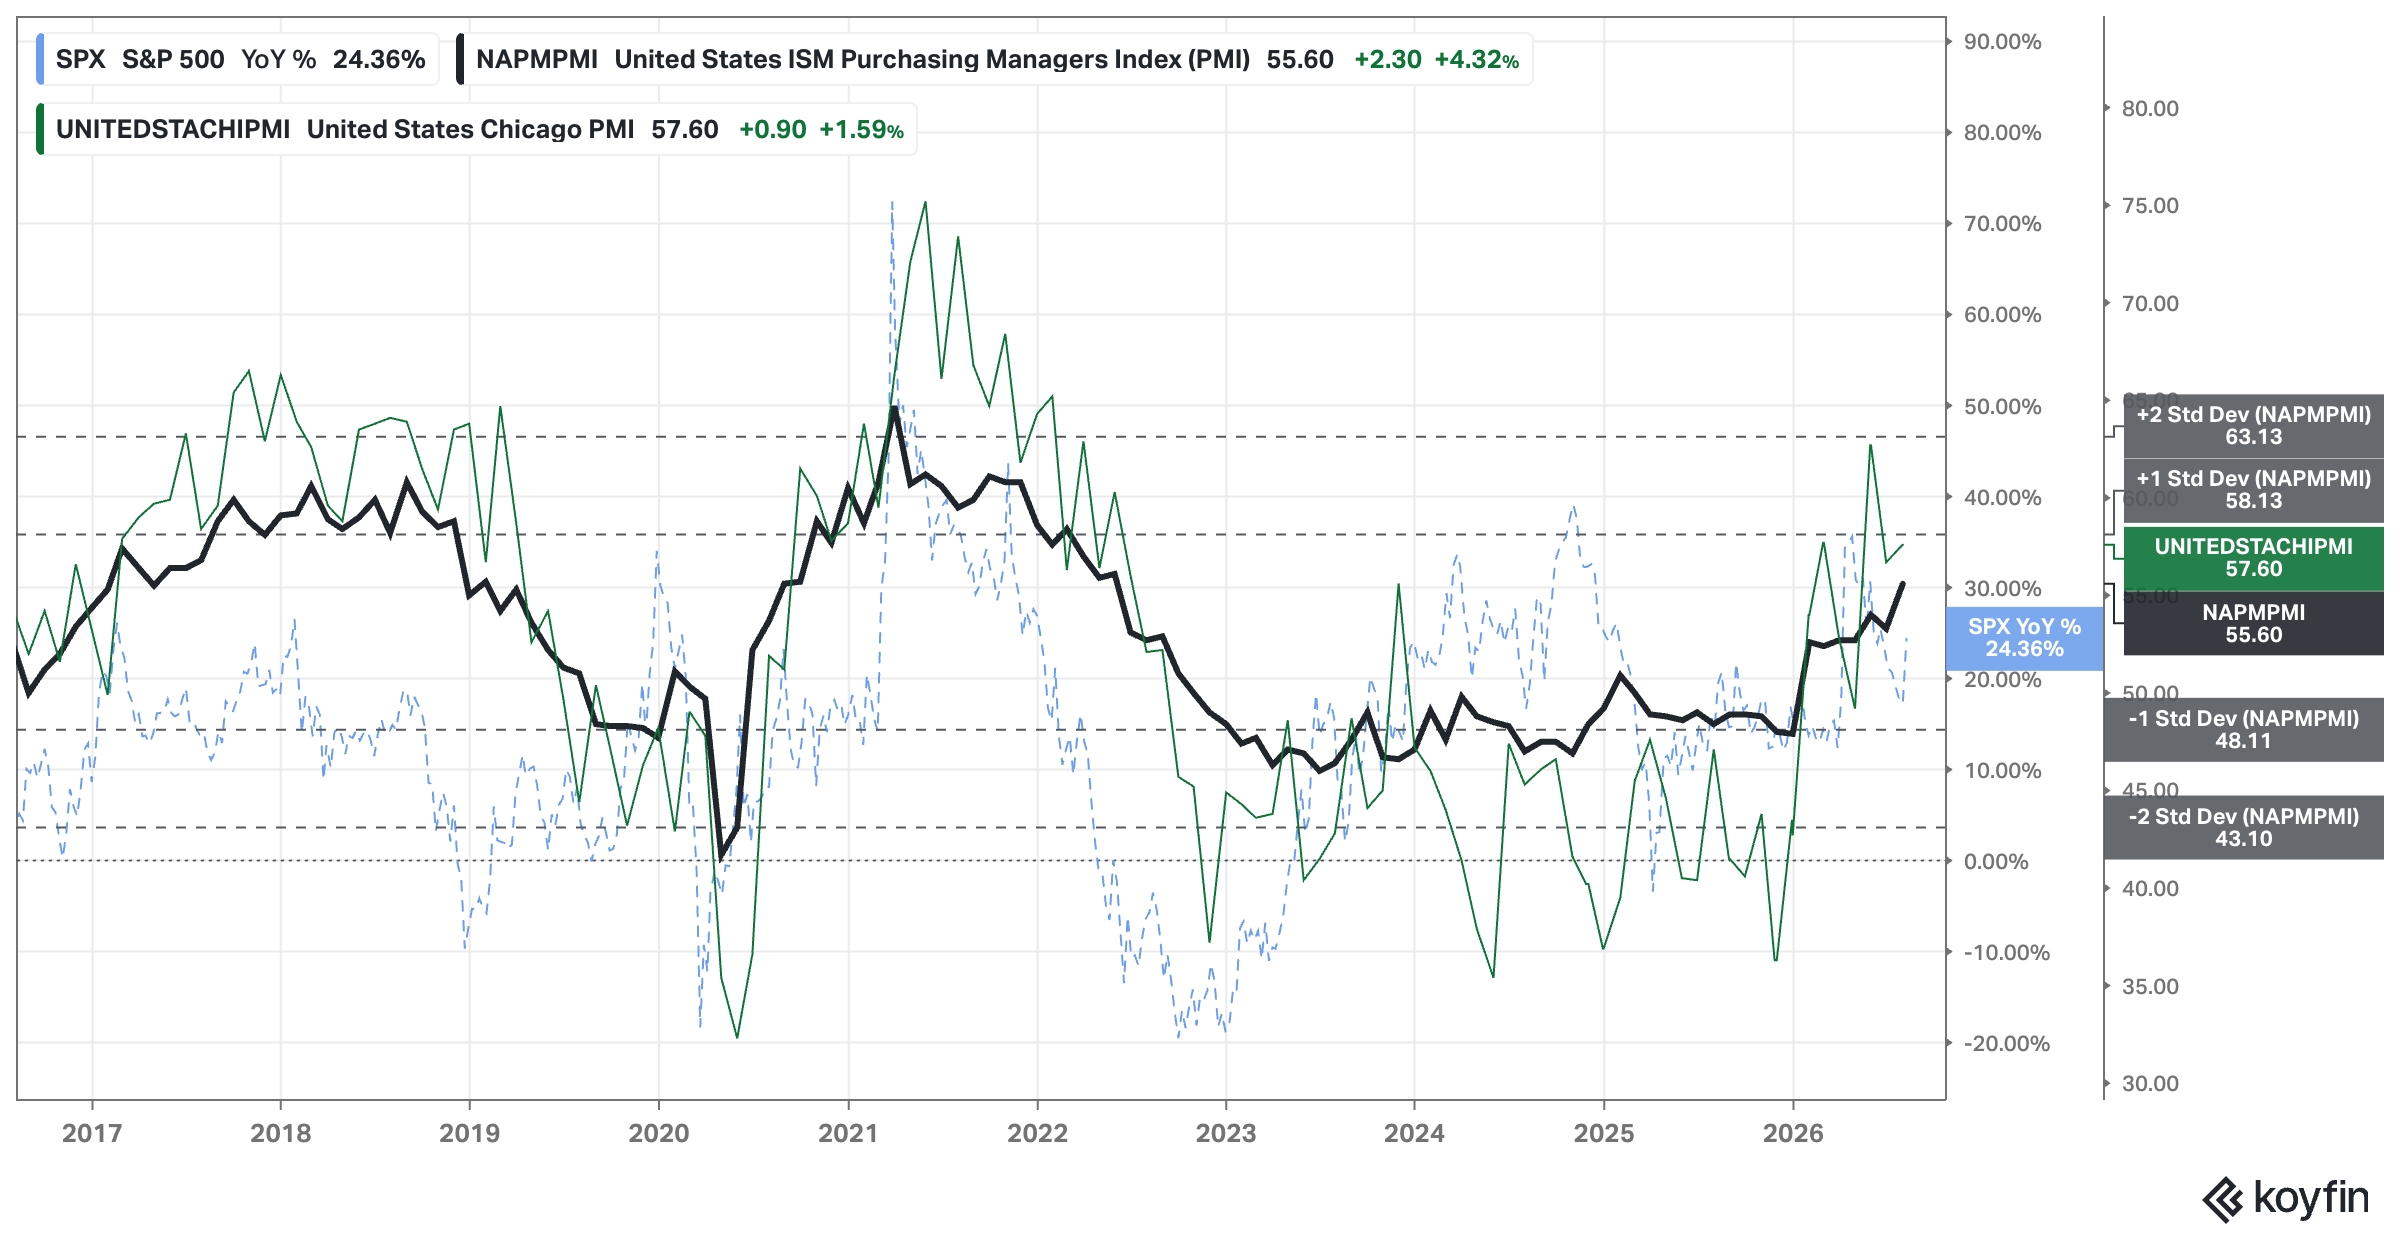
Analysis: No changes since last week.
Outlook: Bullish
Economic Activity: Regional Banks Performance
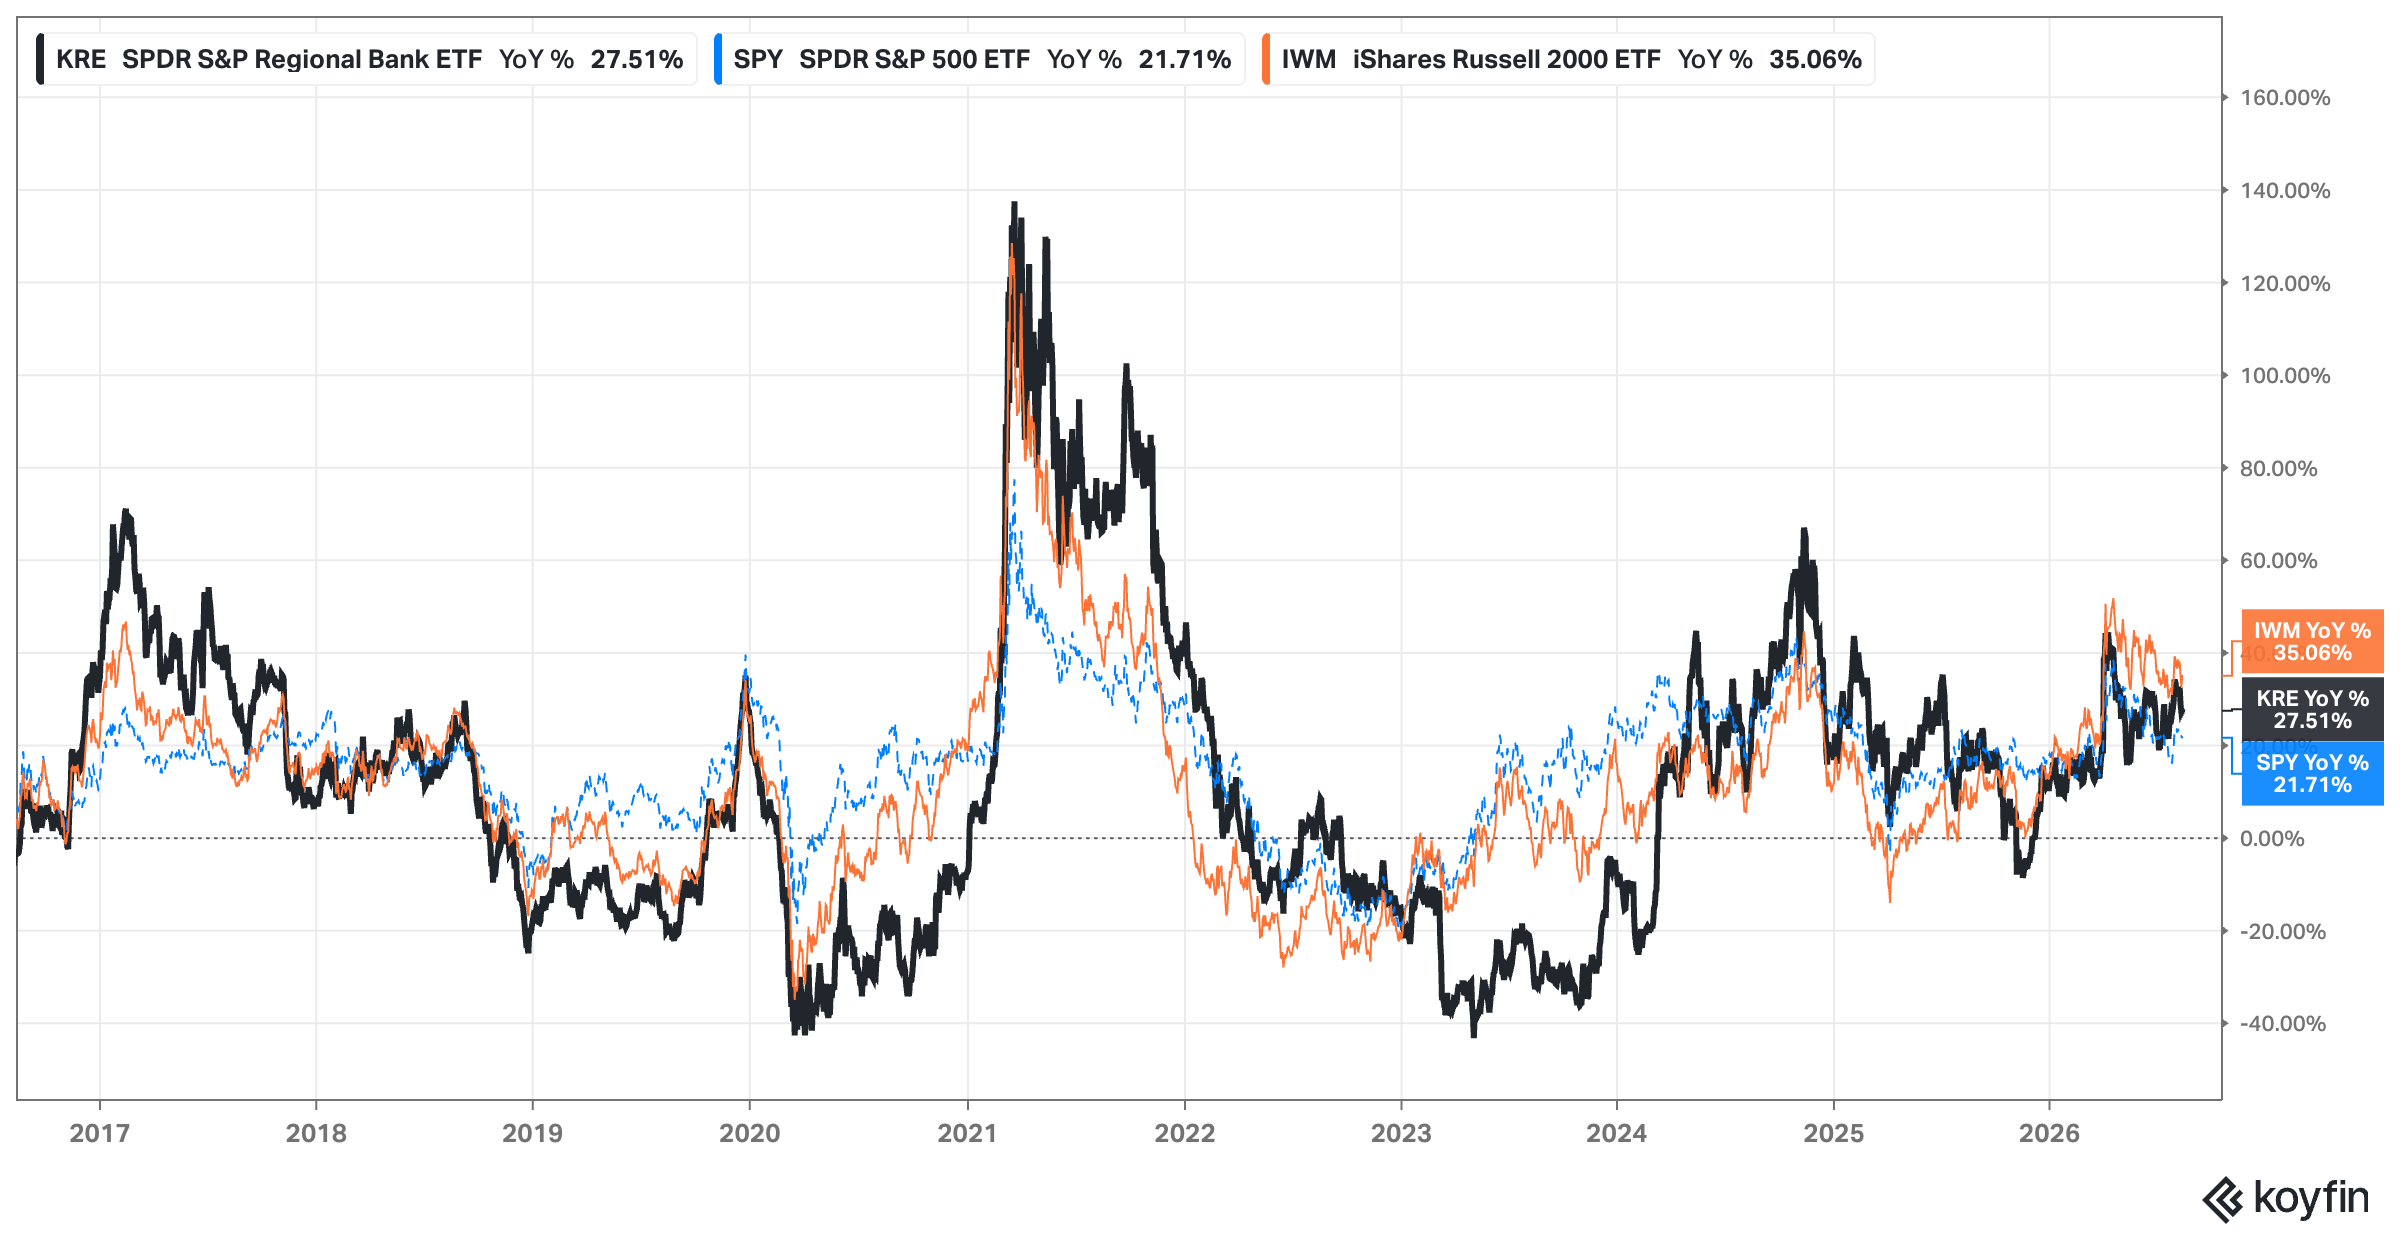
Analysis: KRE uptrend continues.
Outlook: Bullish
Interest Rates: FED, 2yr, 10yr, and 30yr Rates
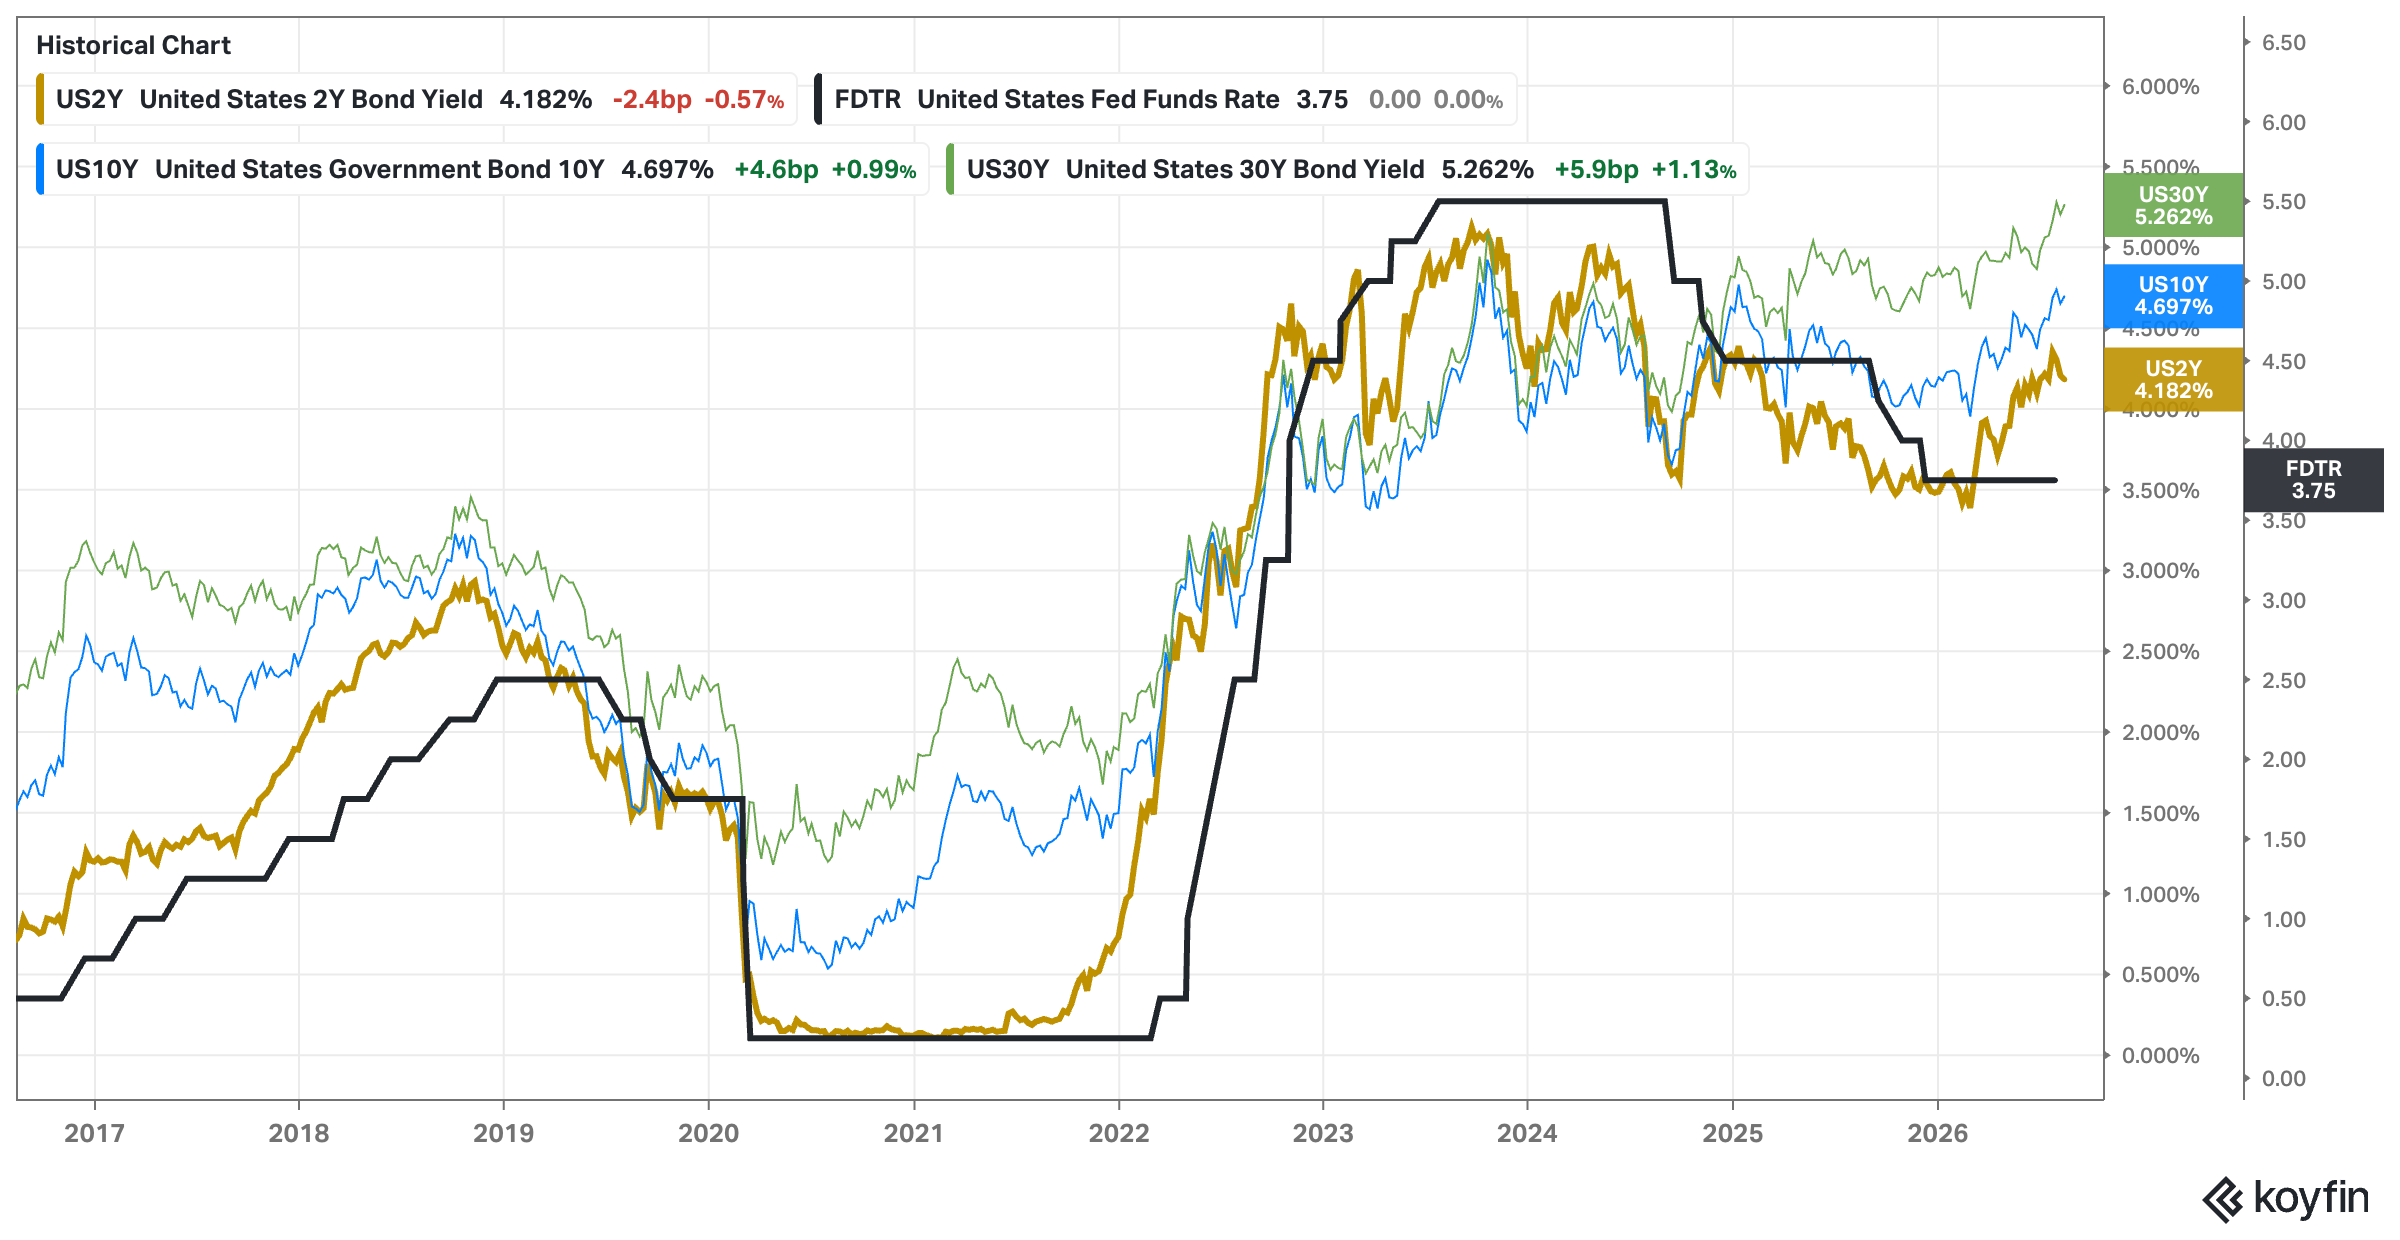
Analysis: Inflation expectations are cooling down, yet long-term rates seem not to notice that much.
Outlook: Neutral
Indexes: What is happening?
TA: Price Action, Trend, Momentum & Volume:
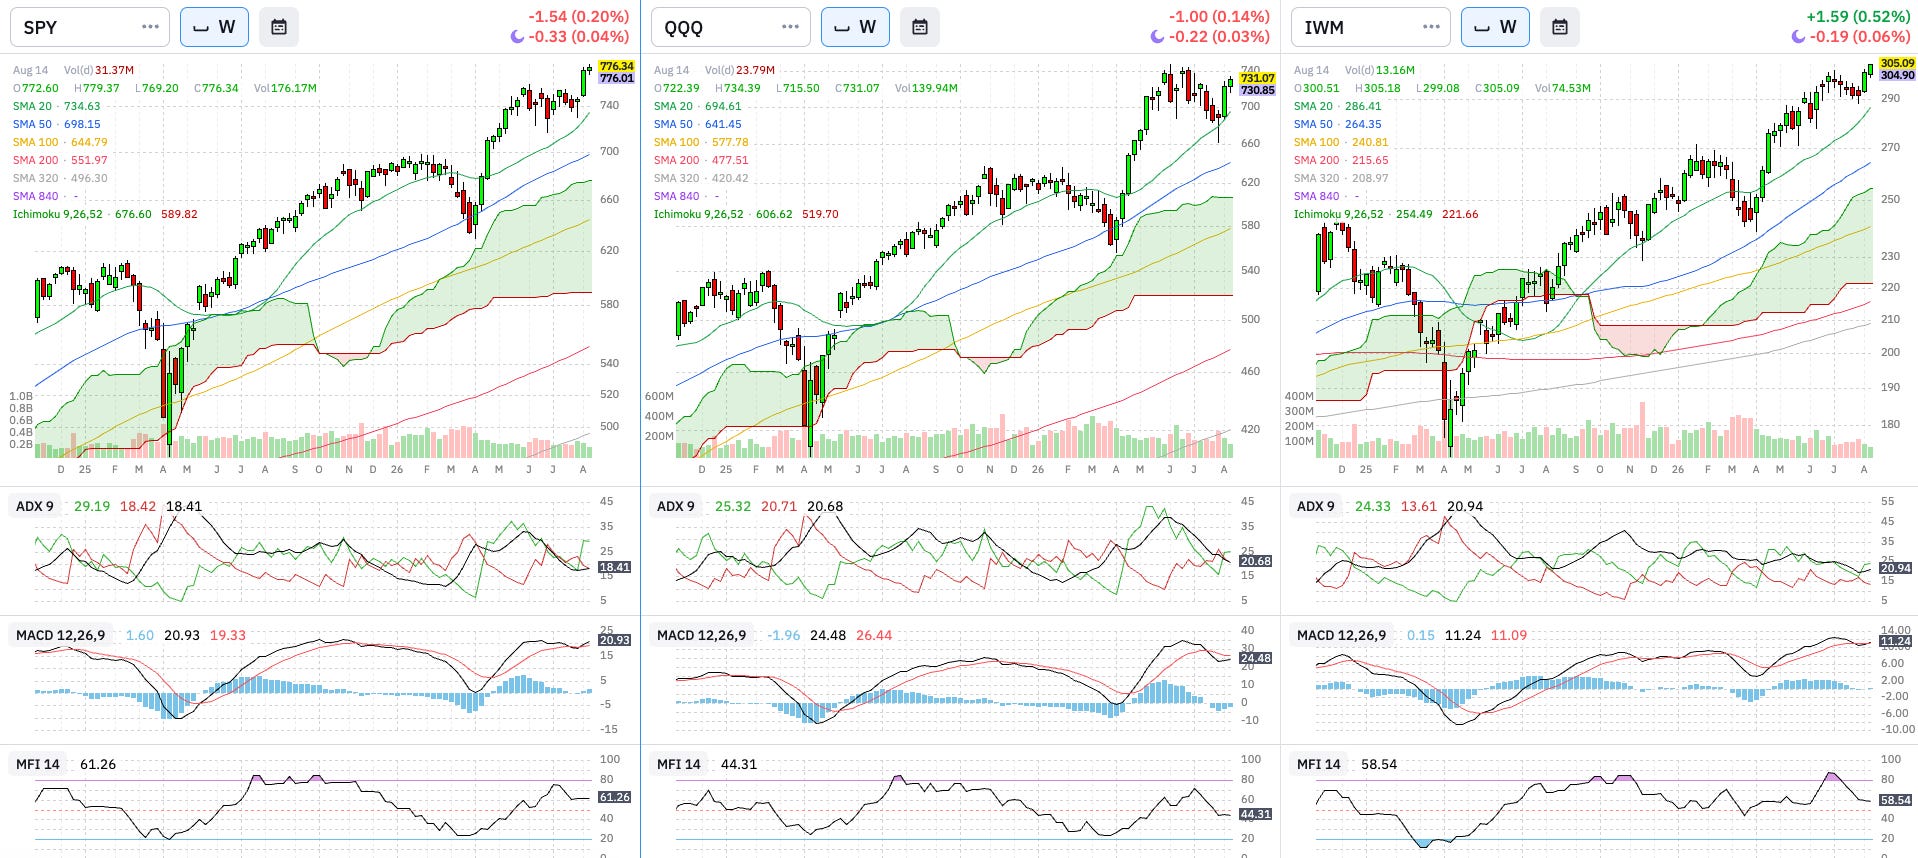
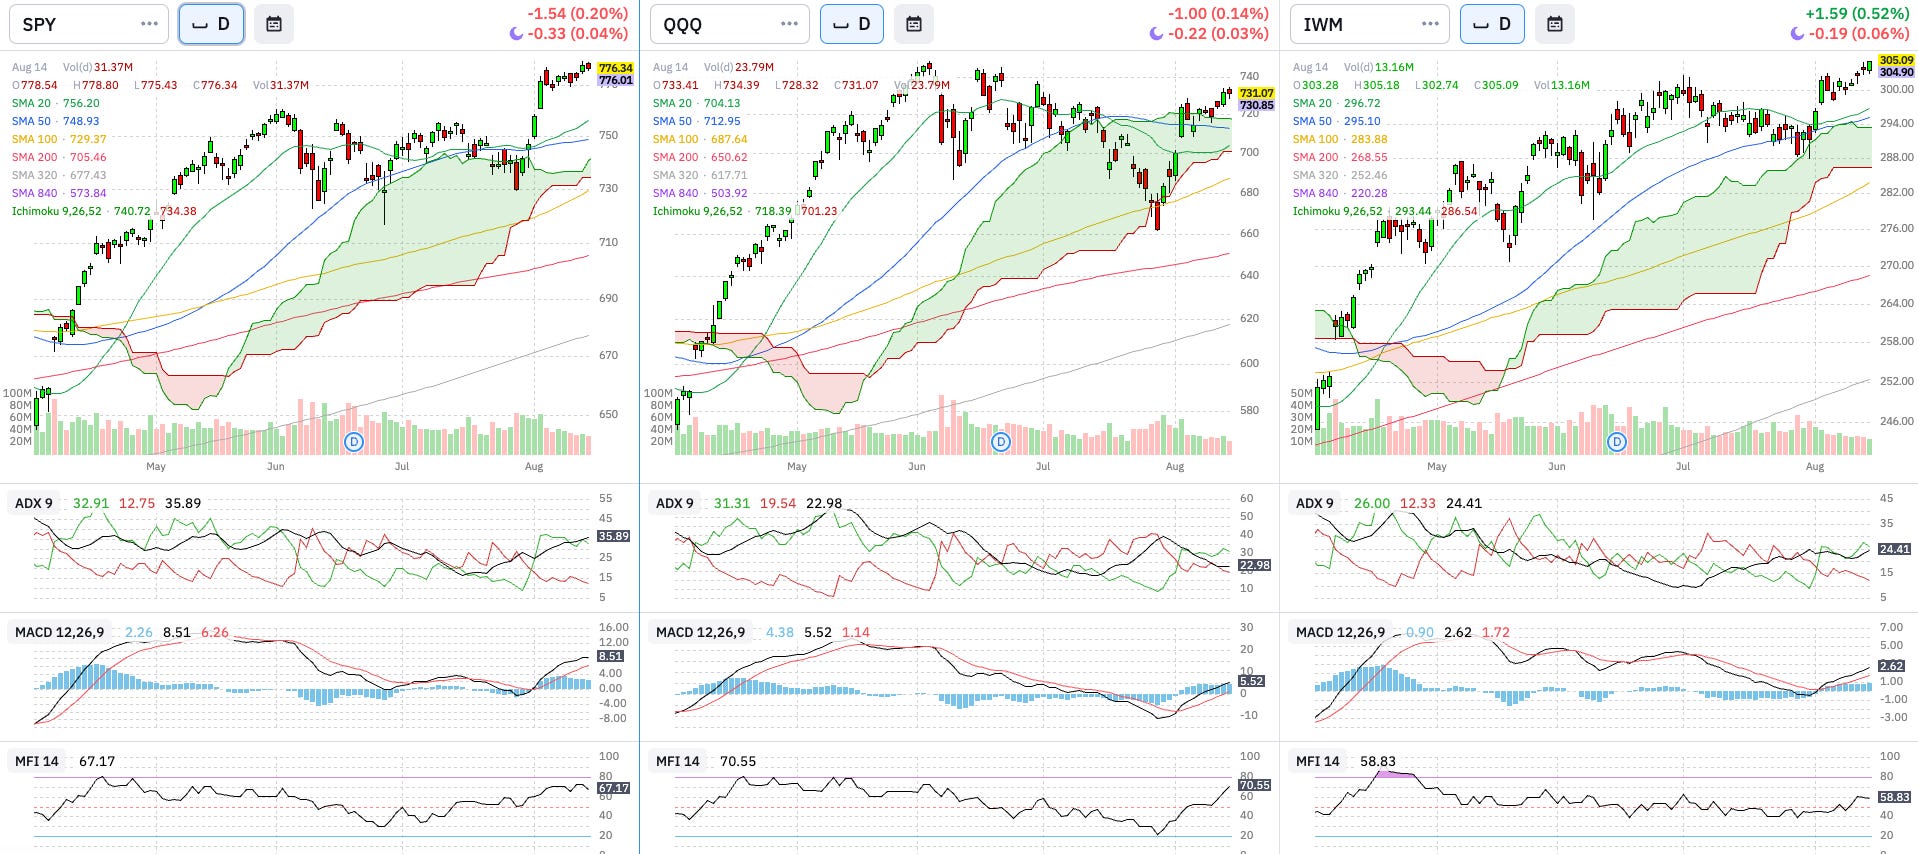
Weekly & Daily SPY, QQQ, and IWM
Technical Analysis:
Price (SMAs & Cloud): SPY and IWM broke to ATHs. Daily QQQ broke above the cloud upper level. Outlook: Bullish
Trend (Cloud & ADX): All indexes with bullish trends. Outlook: Bullish
Momentum (MACD): Daily MACDs are pointing to an uptrend. Weekly MACDs are not aligned with daily indicators, signaling a possible downtrend or short-lived uptrend. Outlook: Neutral (due to Weekly readings)
Volume (MFI): Daily readings are bullish but weekly readings seem to be forming a bearish divergence. Outlook: Neutral
Outlook: Neutral to Bullish
Breadth: % Stocks above SMAs
Above 200 Daily SMA
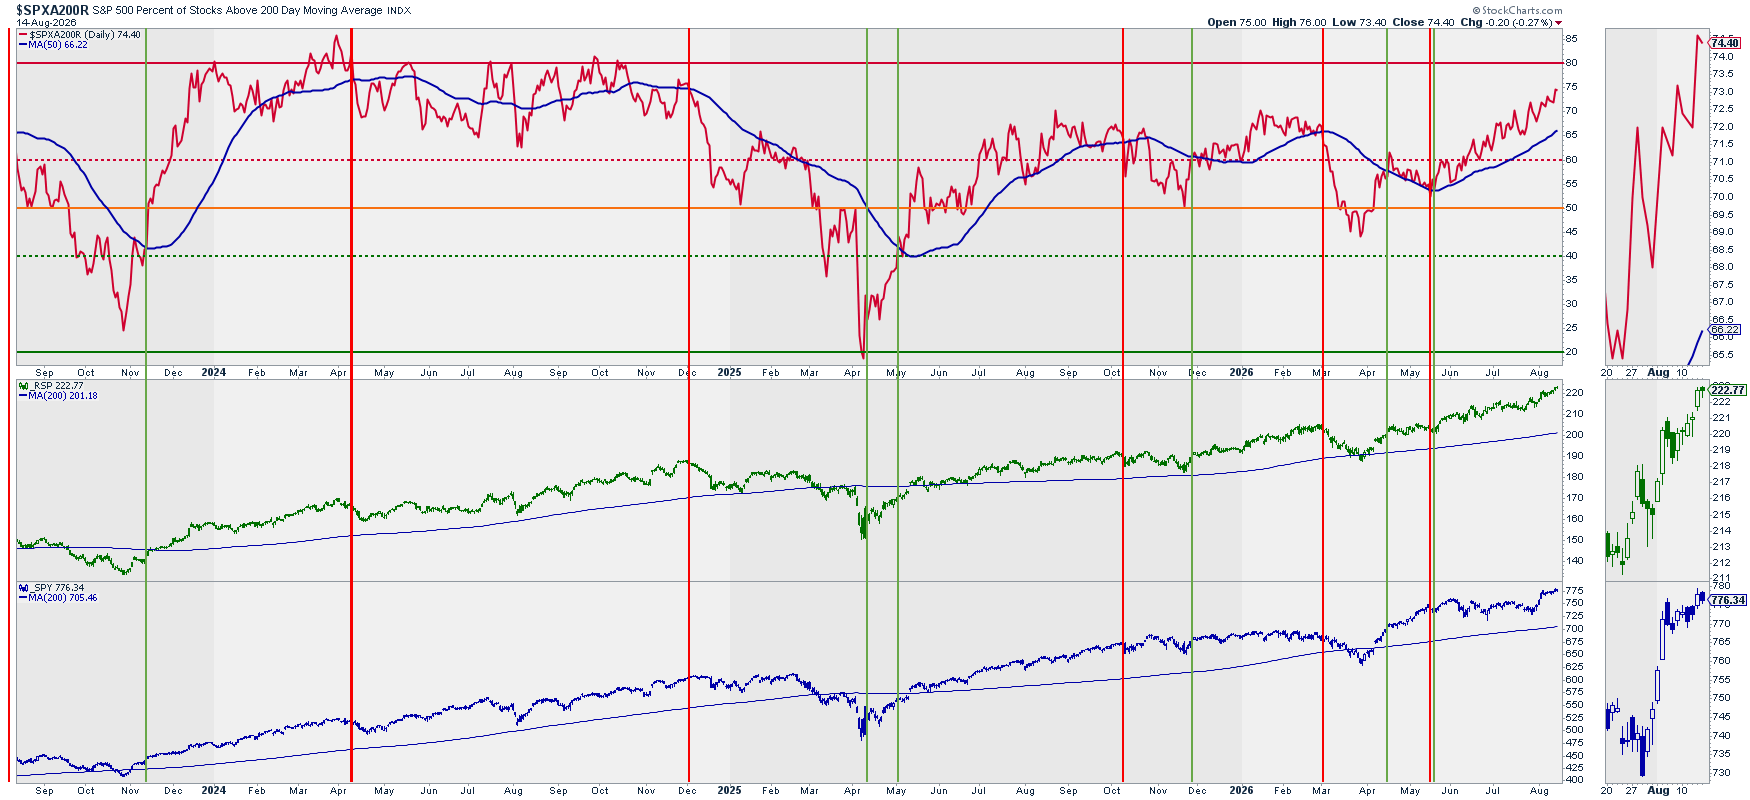
Above 20, 50, and 200 Daily SMAs vs. RSP
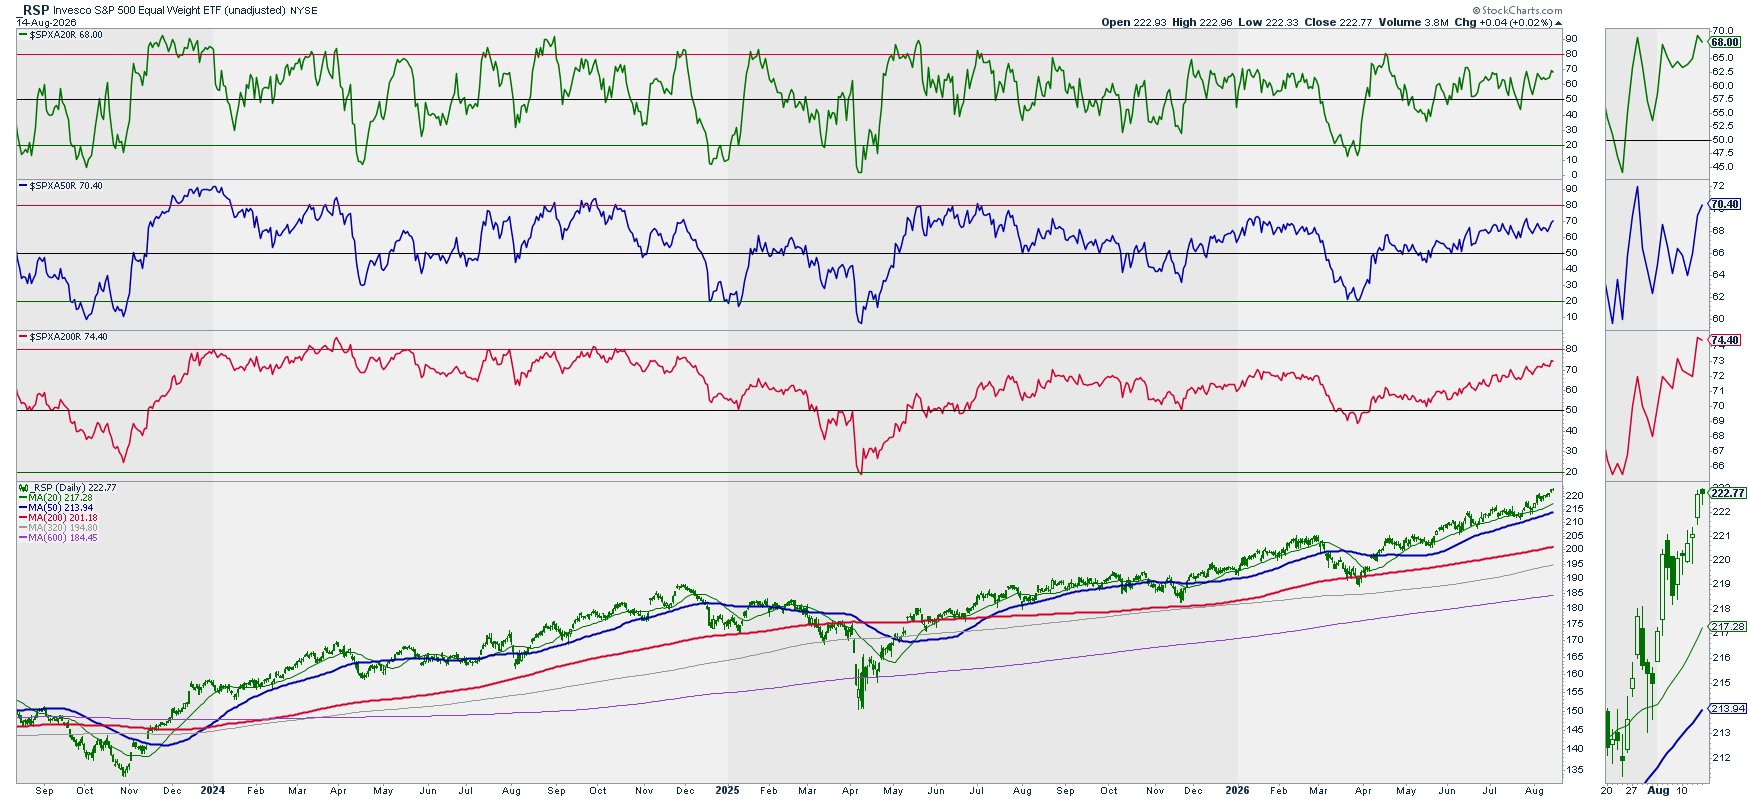
Analysis: All indicators show a bullish trend.
Outlook: Bullish
Volatility: Ratio Low Vol. Stocks / SPY vs. RSP & SPY
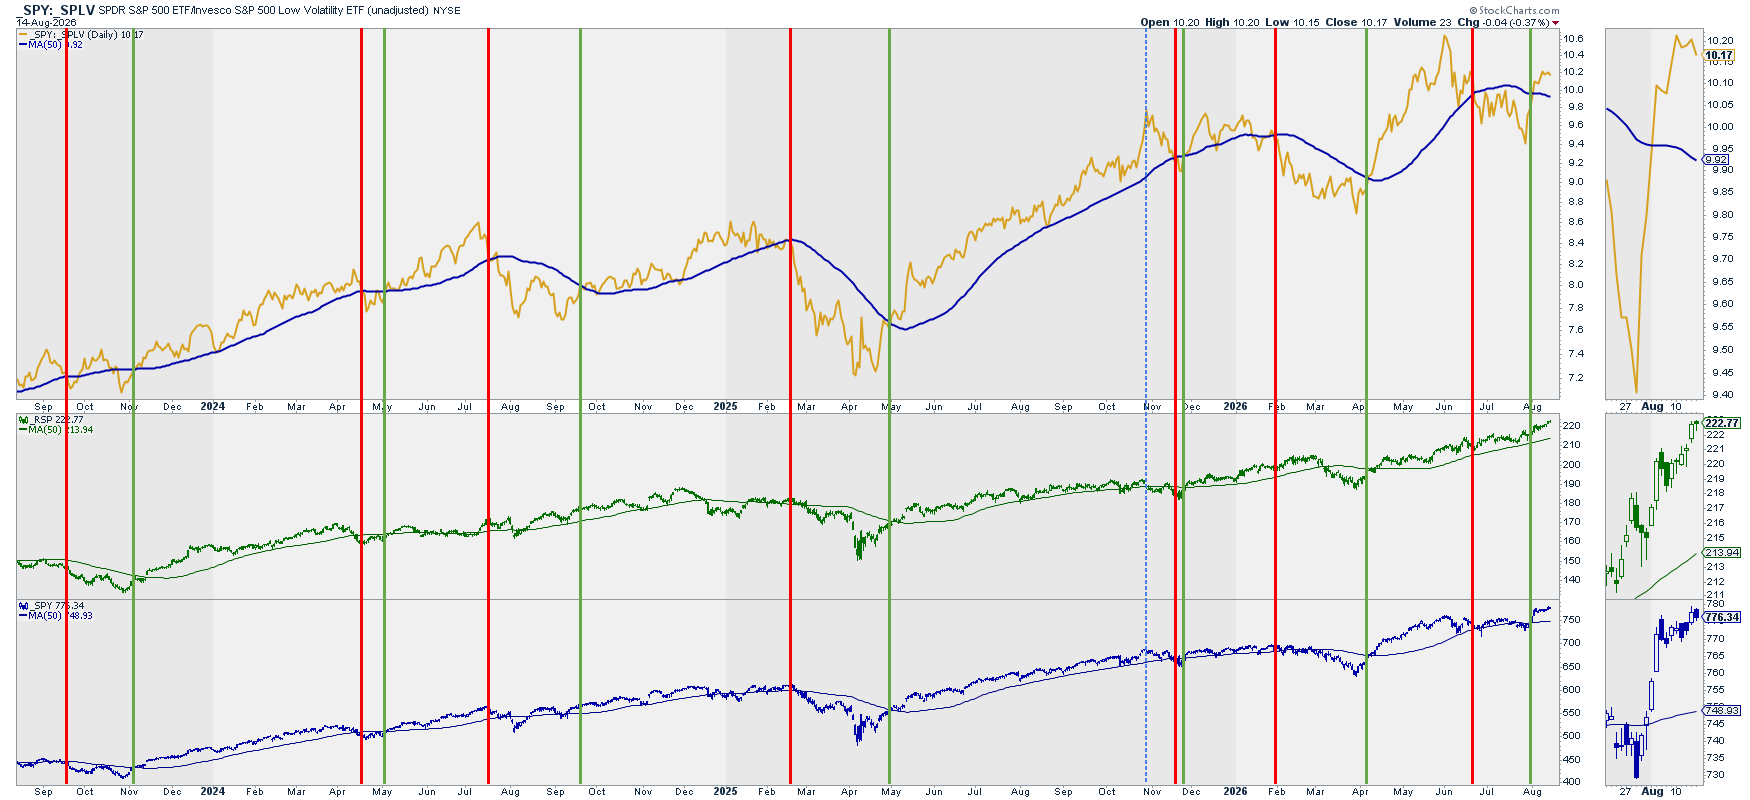
Analysis: Ratio remains above the signal line (50D SMA).
Outlook: Bullish
Volatility: (Inverted) VIX vs. SPY
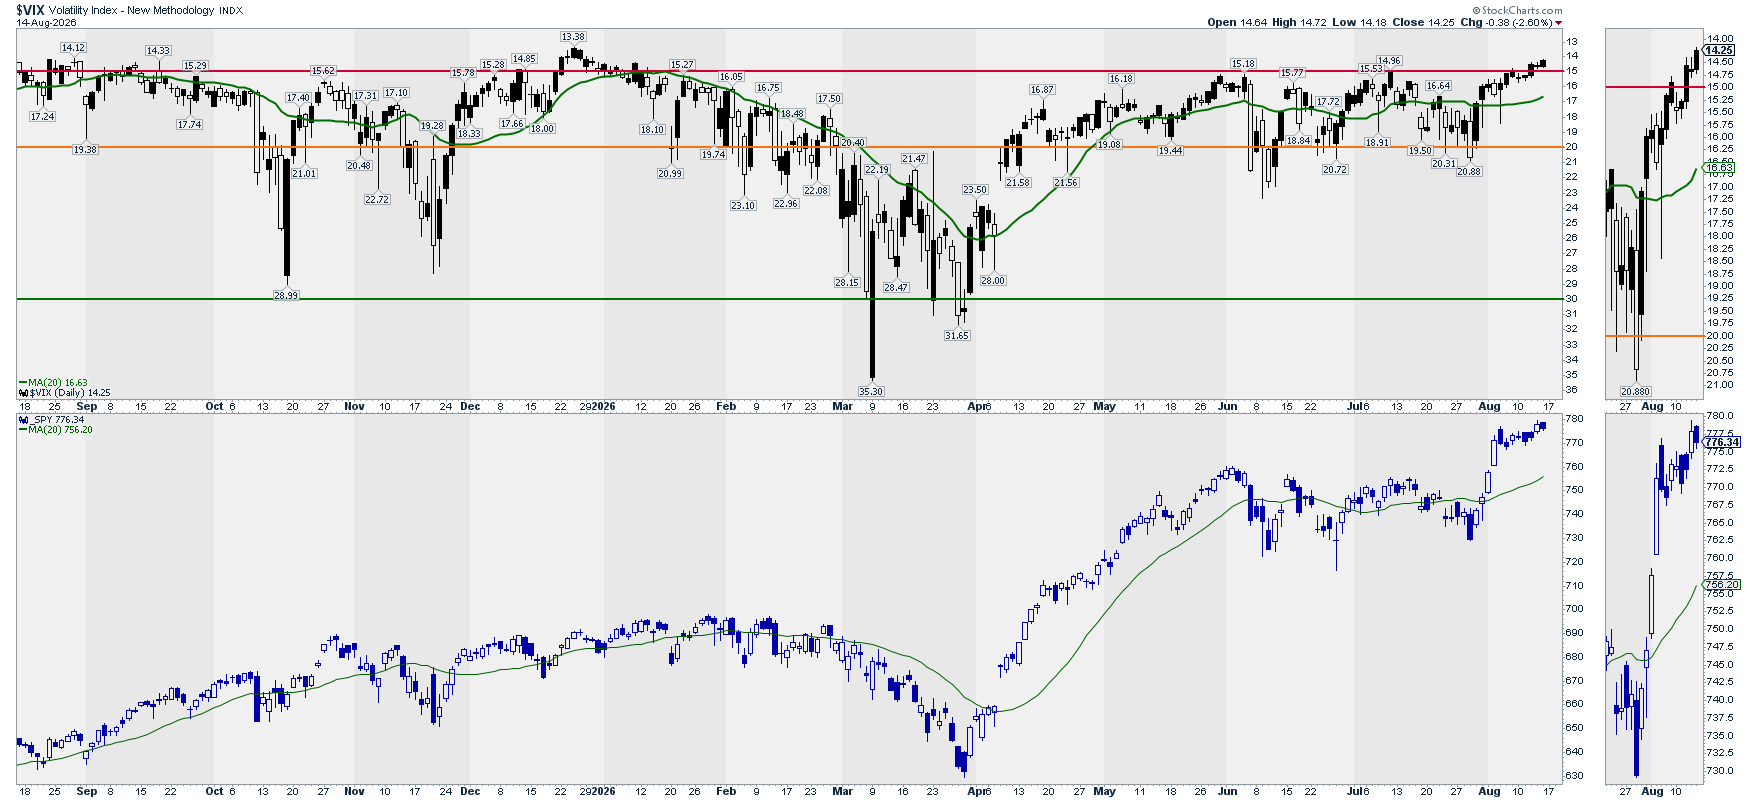
Note: This chart is mainly to detect extreme volatility situations that, once they reverse, offer great long opportunities in the market.
Analysis: With the recent market uptrend, the VIX dropped to the level 15 and the trend remains very stable since May.
Options: (Inverted) Put/Call Ratio vs. SPY
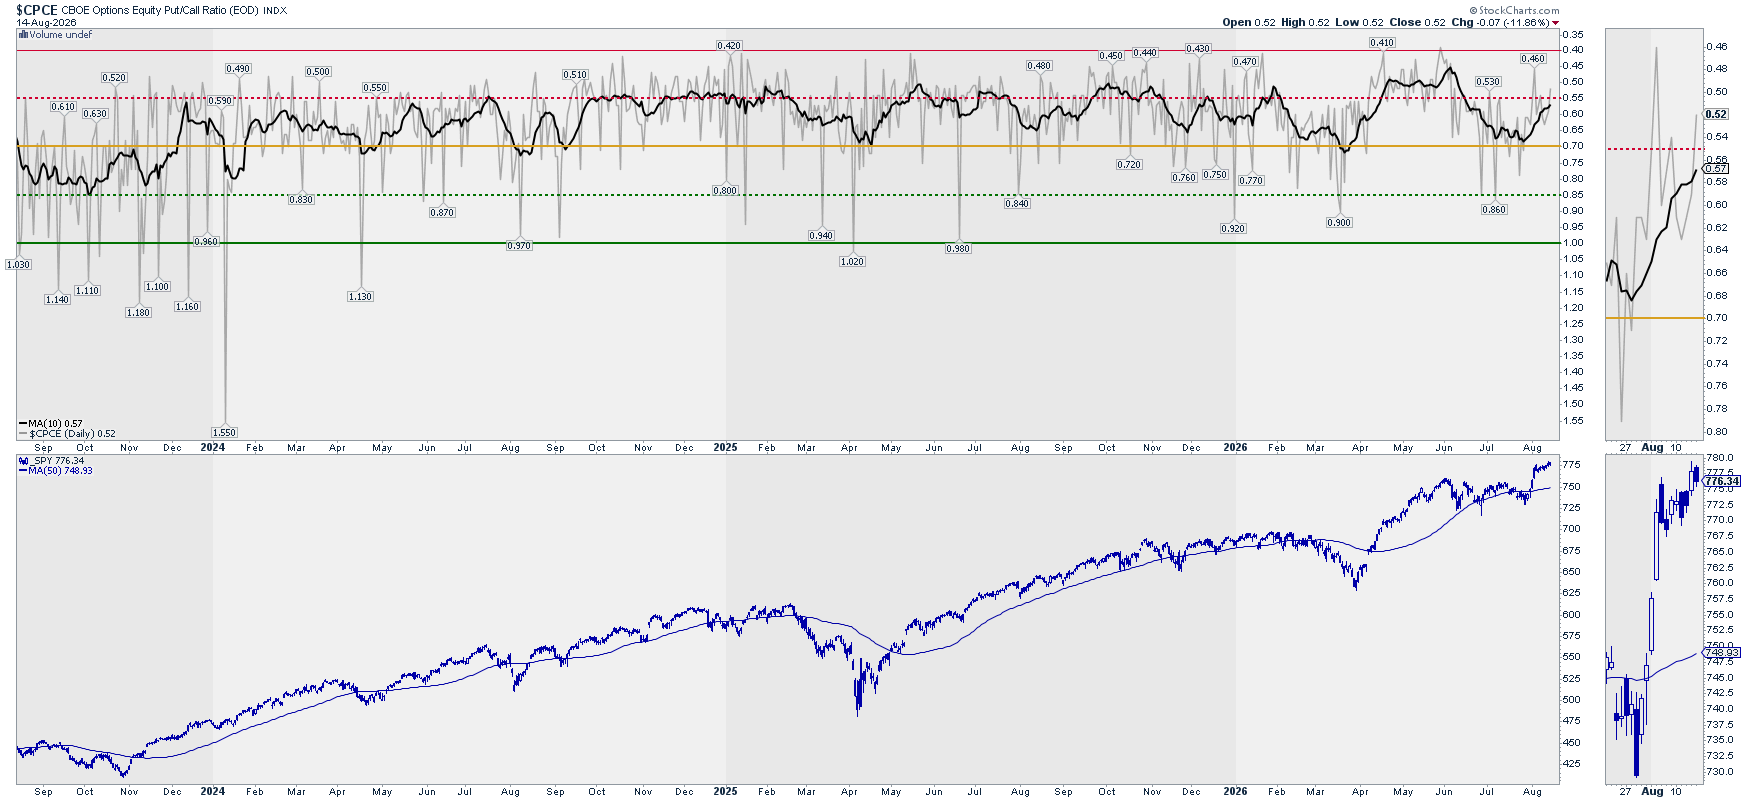
Analysis: P/C ratio uptrend continues.
Outlook: Bullish
Options: Gamma Exposure – SPY
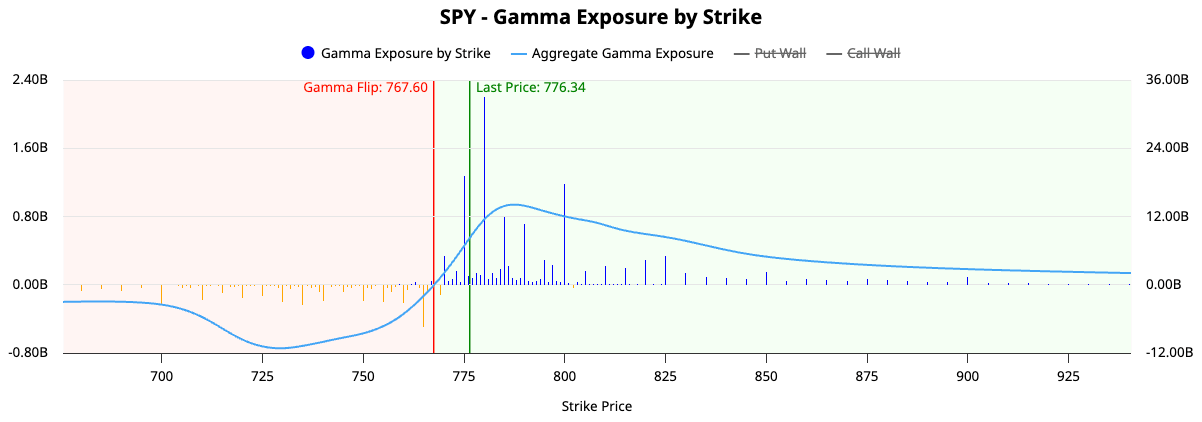
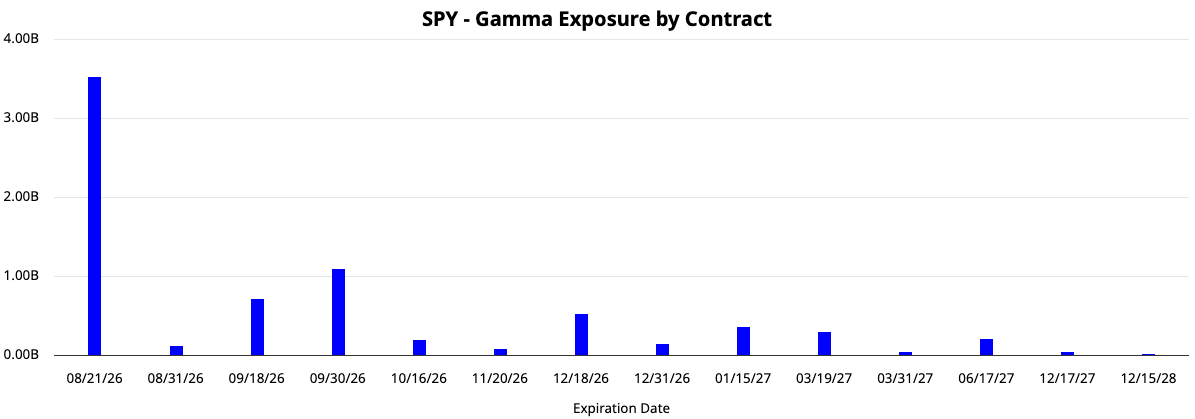
Analysis: We are in positive GEX territory. There is a big drop on GEX after next Friday’s 21st expiration day. Next weekend GEX per contract chart will be interesting.
Outlook: Bullish
Sectors: Where is it happening?
Sectors Rotation
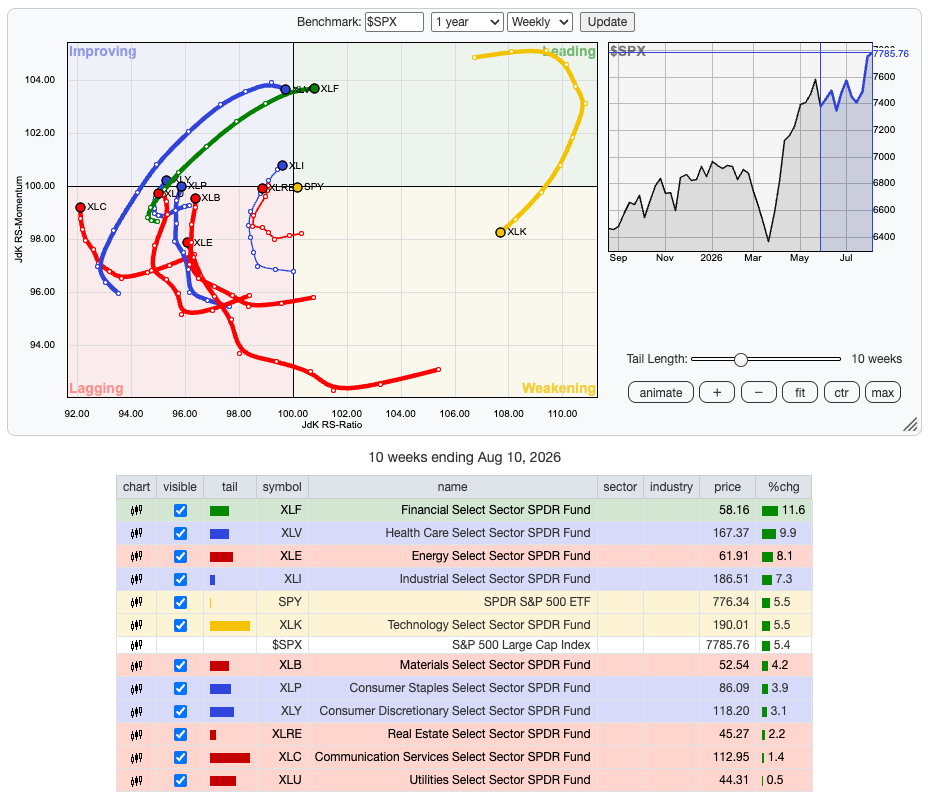
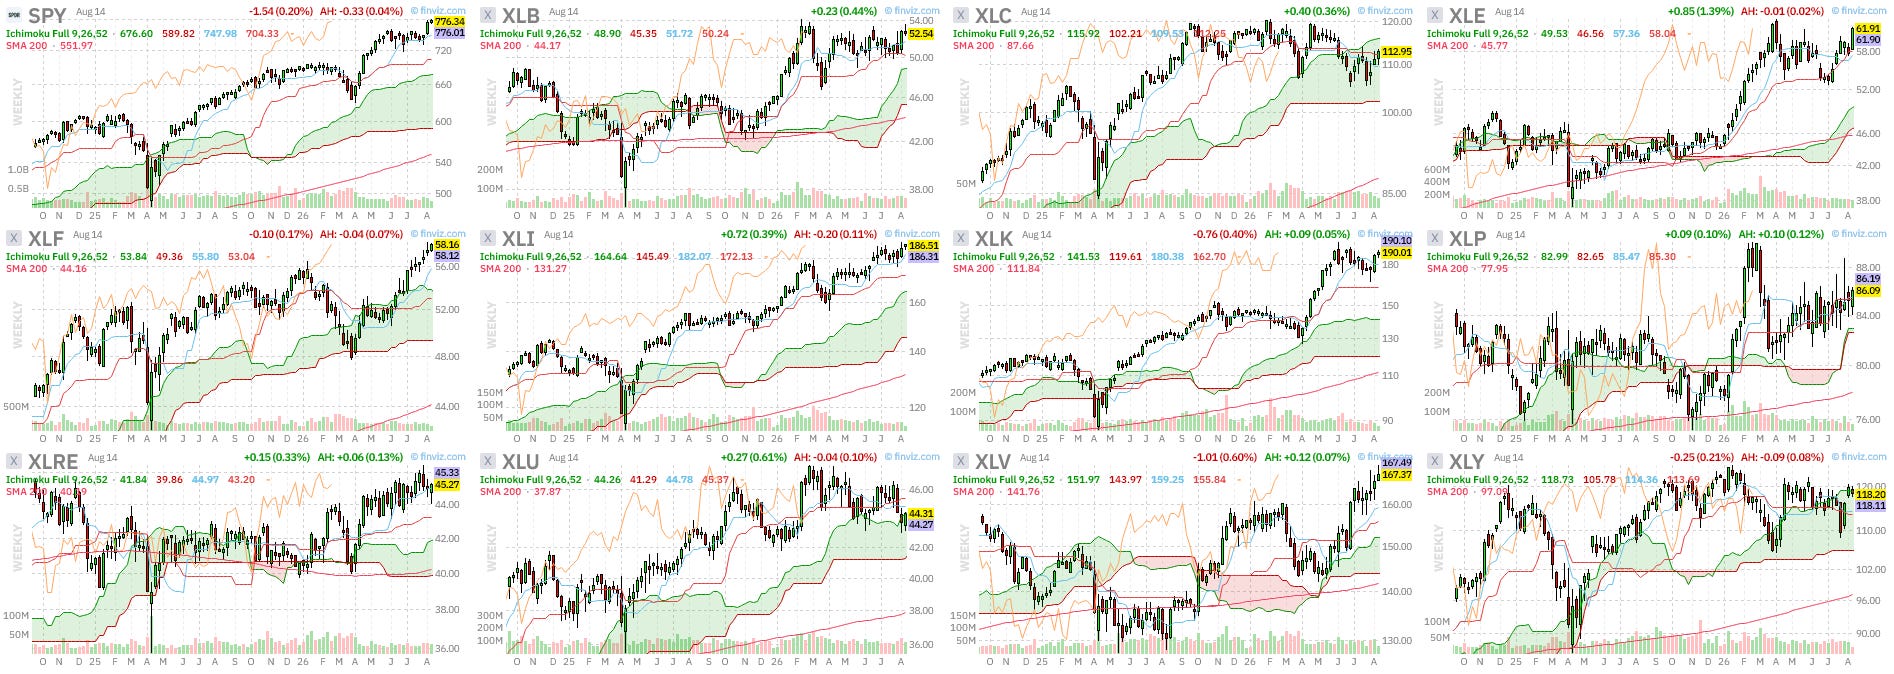
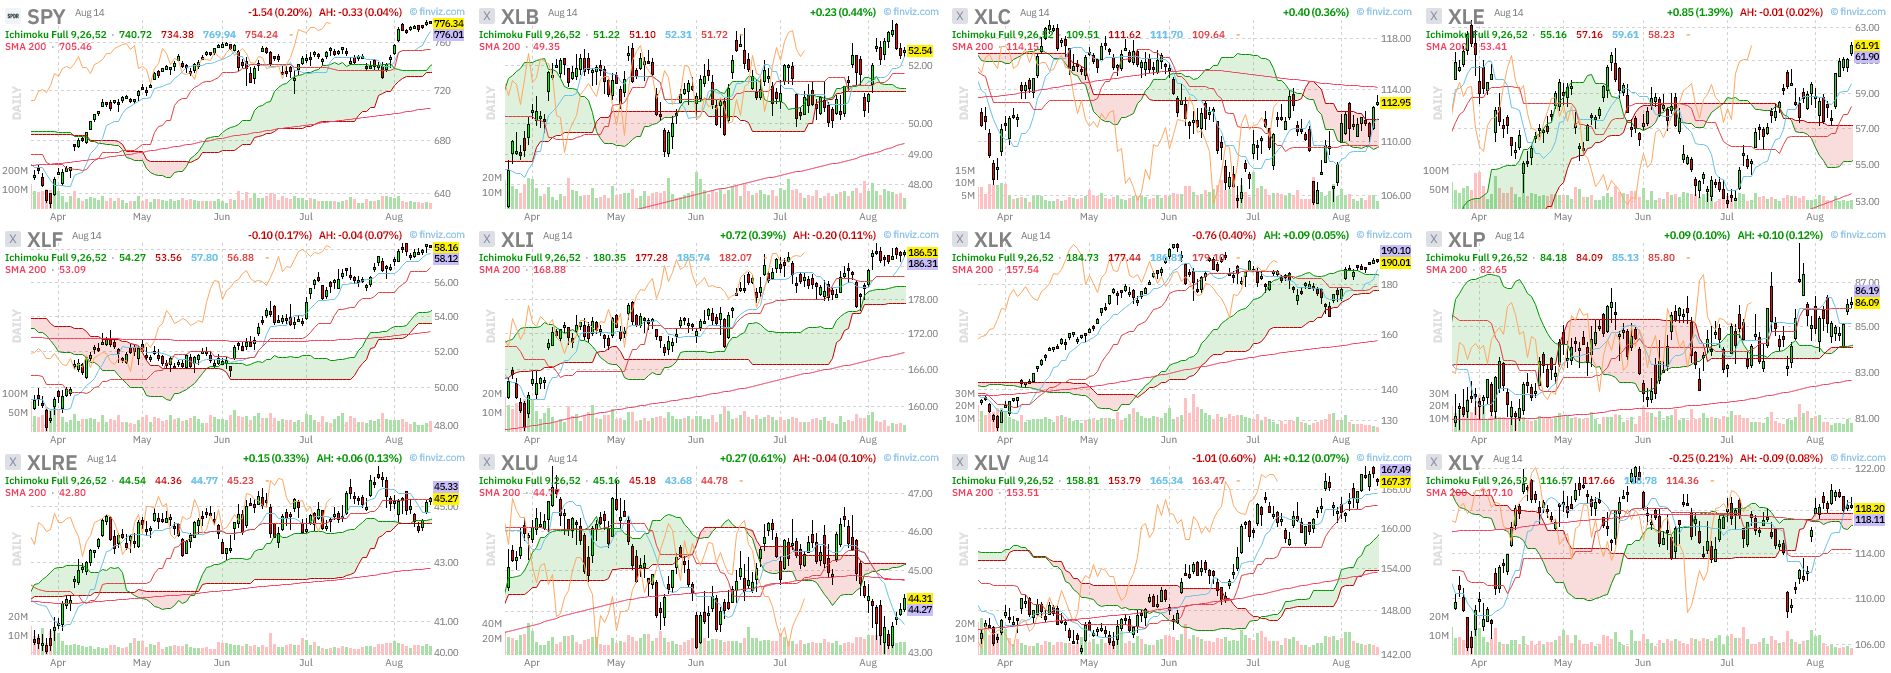
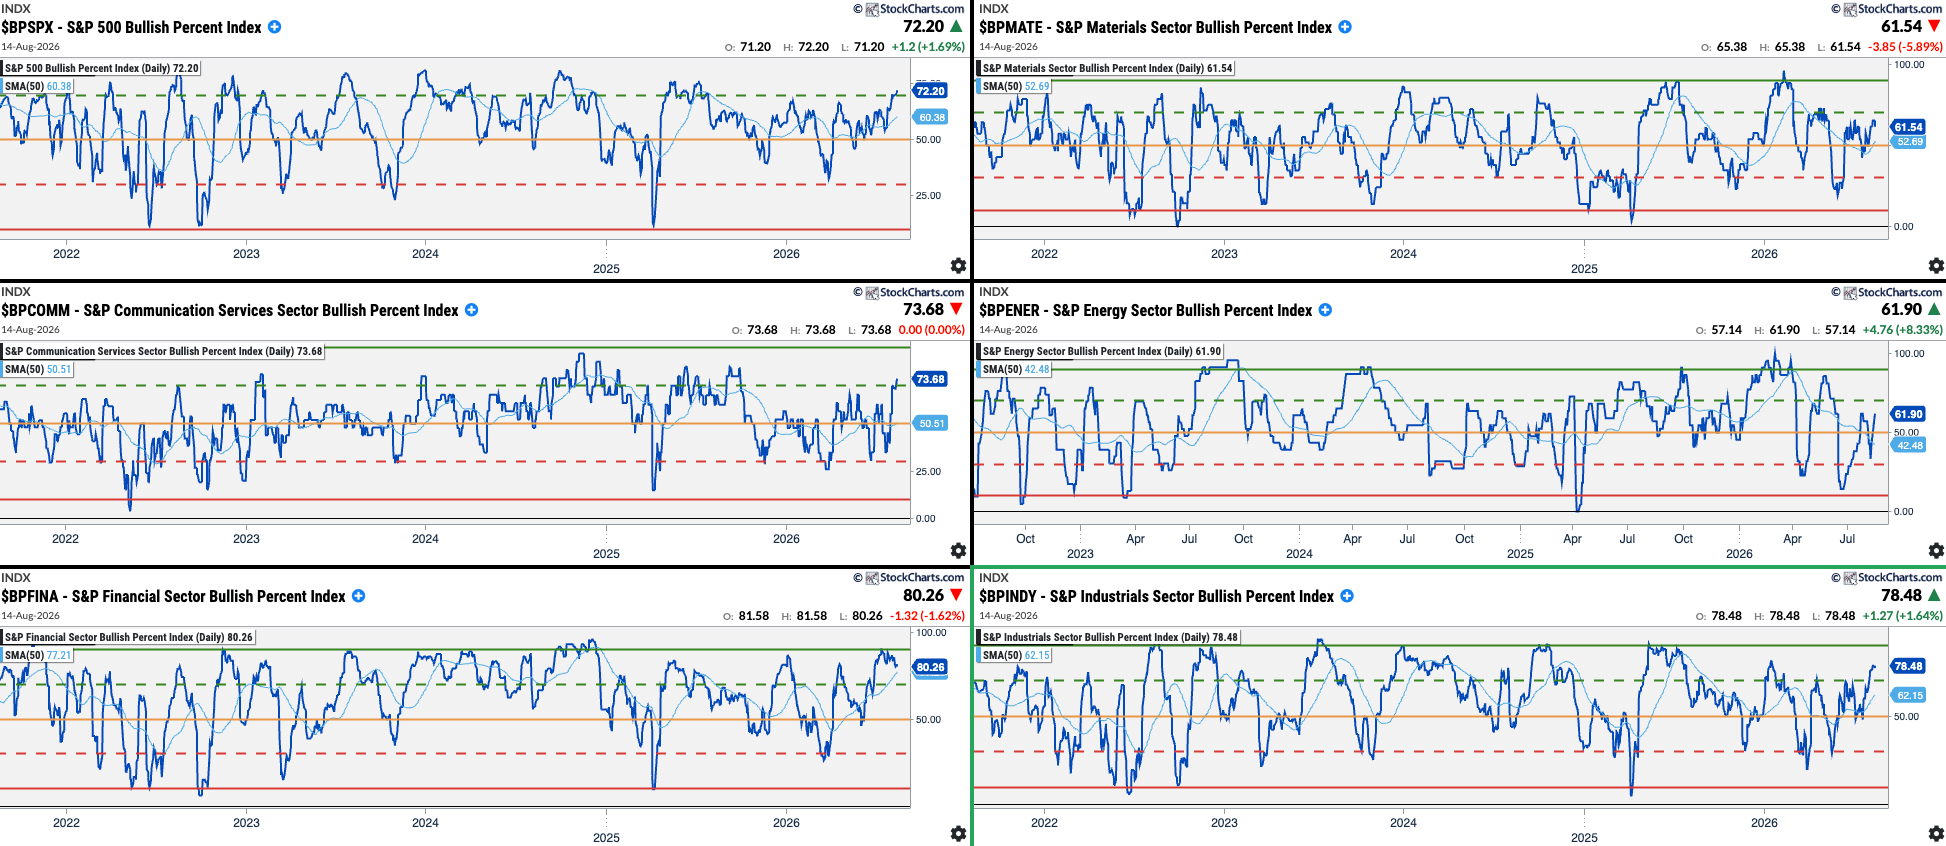
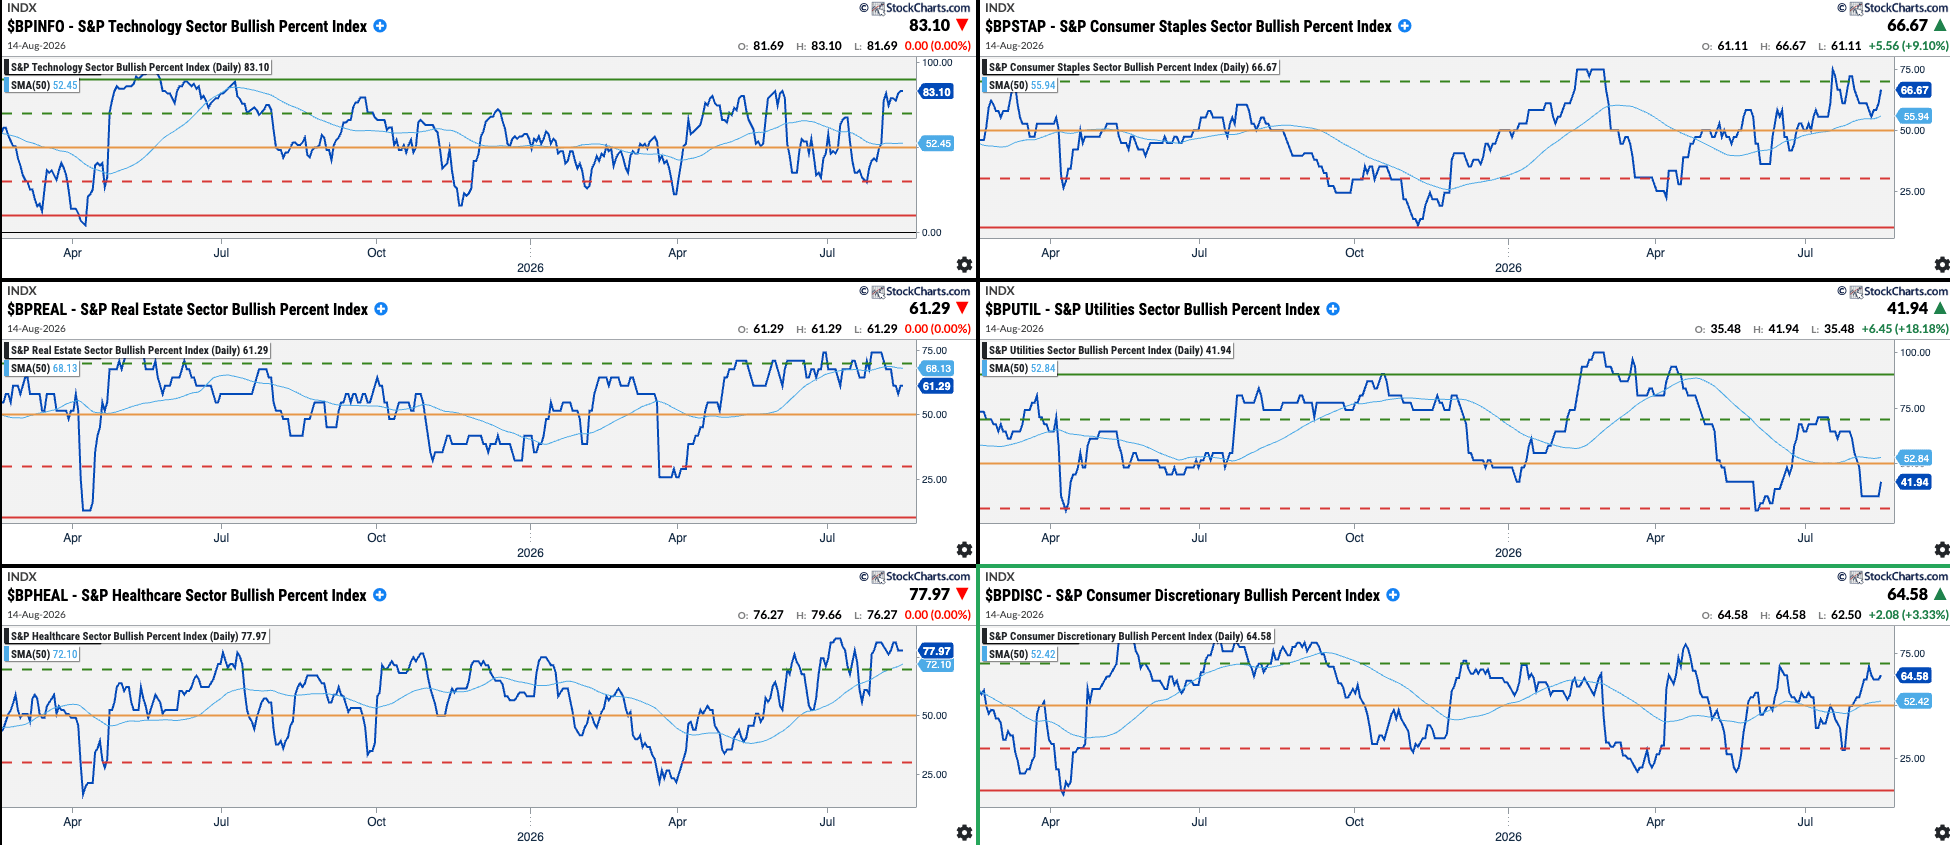
Summary:


Last Word
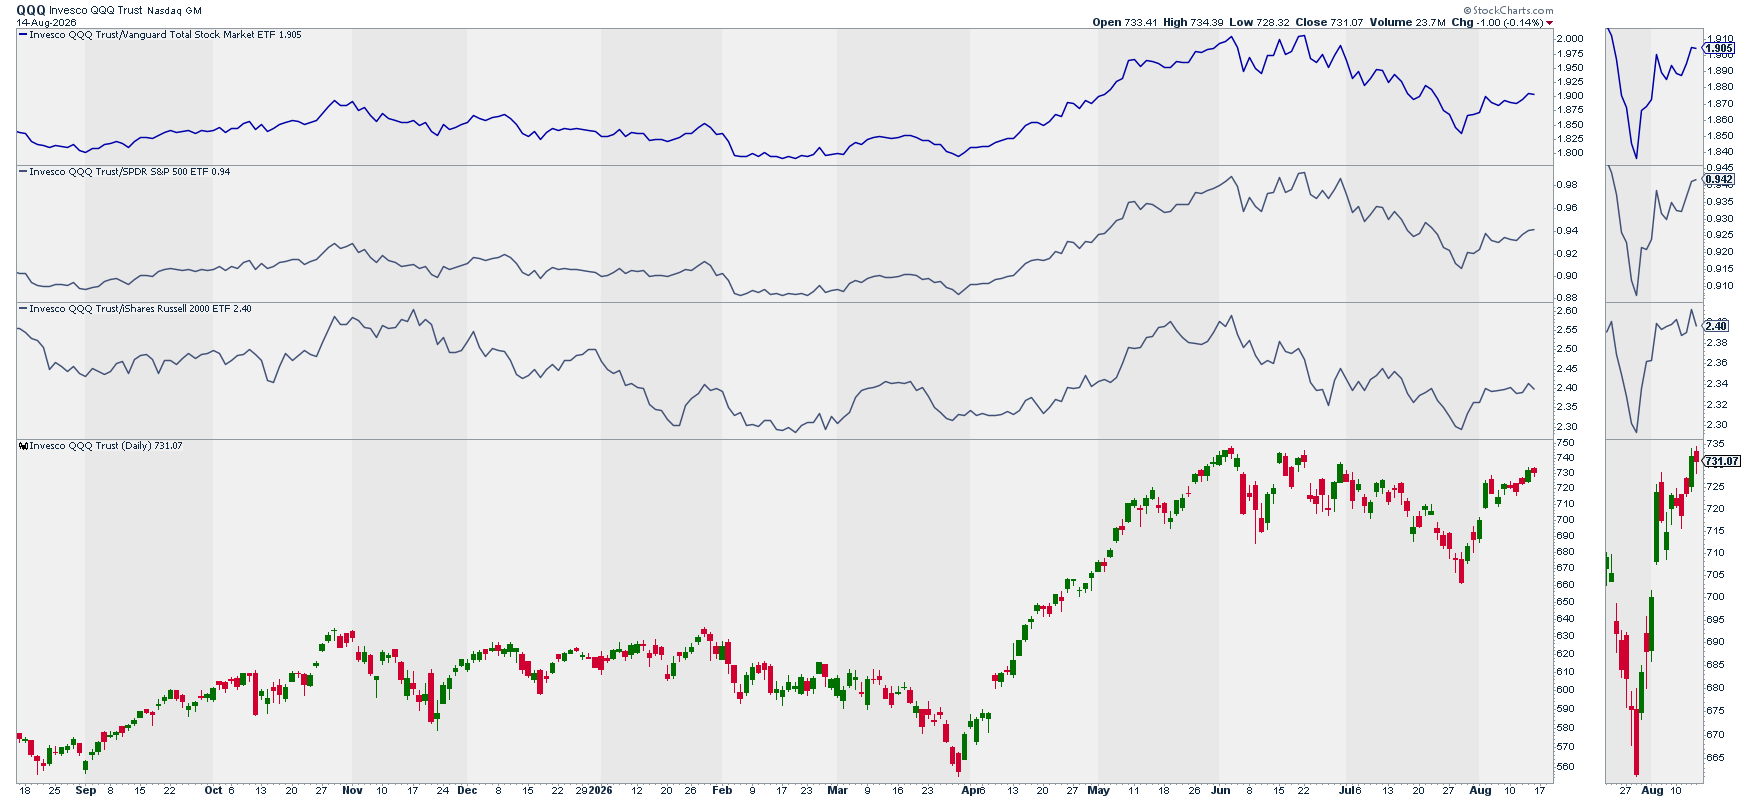
Market conditions are improving and markets are reaching new all time highs (SPY and IWM). Technology is in recovery mode and has turned around it lagging relative performance that started mid June and bottomed late July (chart below). If the Technology sector can lead against, we can see that SPY 8,000 level reached sooner than expected. The only area of concern that we see is that big drop on positive GEX after Friday the 21st of August. As always the market will send us signals somewhere. I hope we are not near the edge of a cliff.
QQQ relative performance vs. VTI, SPY, and IWM:
Disclaimer: The content on AMAT Investing is strictly for educational and learning purposes. The author is not a licensed financial advisor and holds no formal financial education. This post does not constitute professional financial advice. All investing involves risk of loss. Always conduct your own research and consult a licensed professional before making any investment decisions.