Context: Why is it happening?
Economic Production: ISM PMI vs. SPX
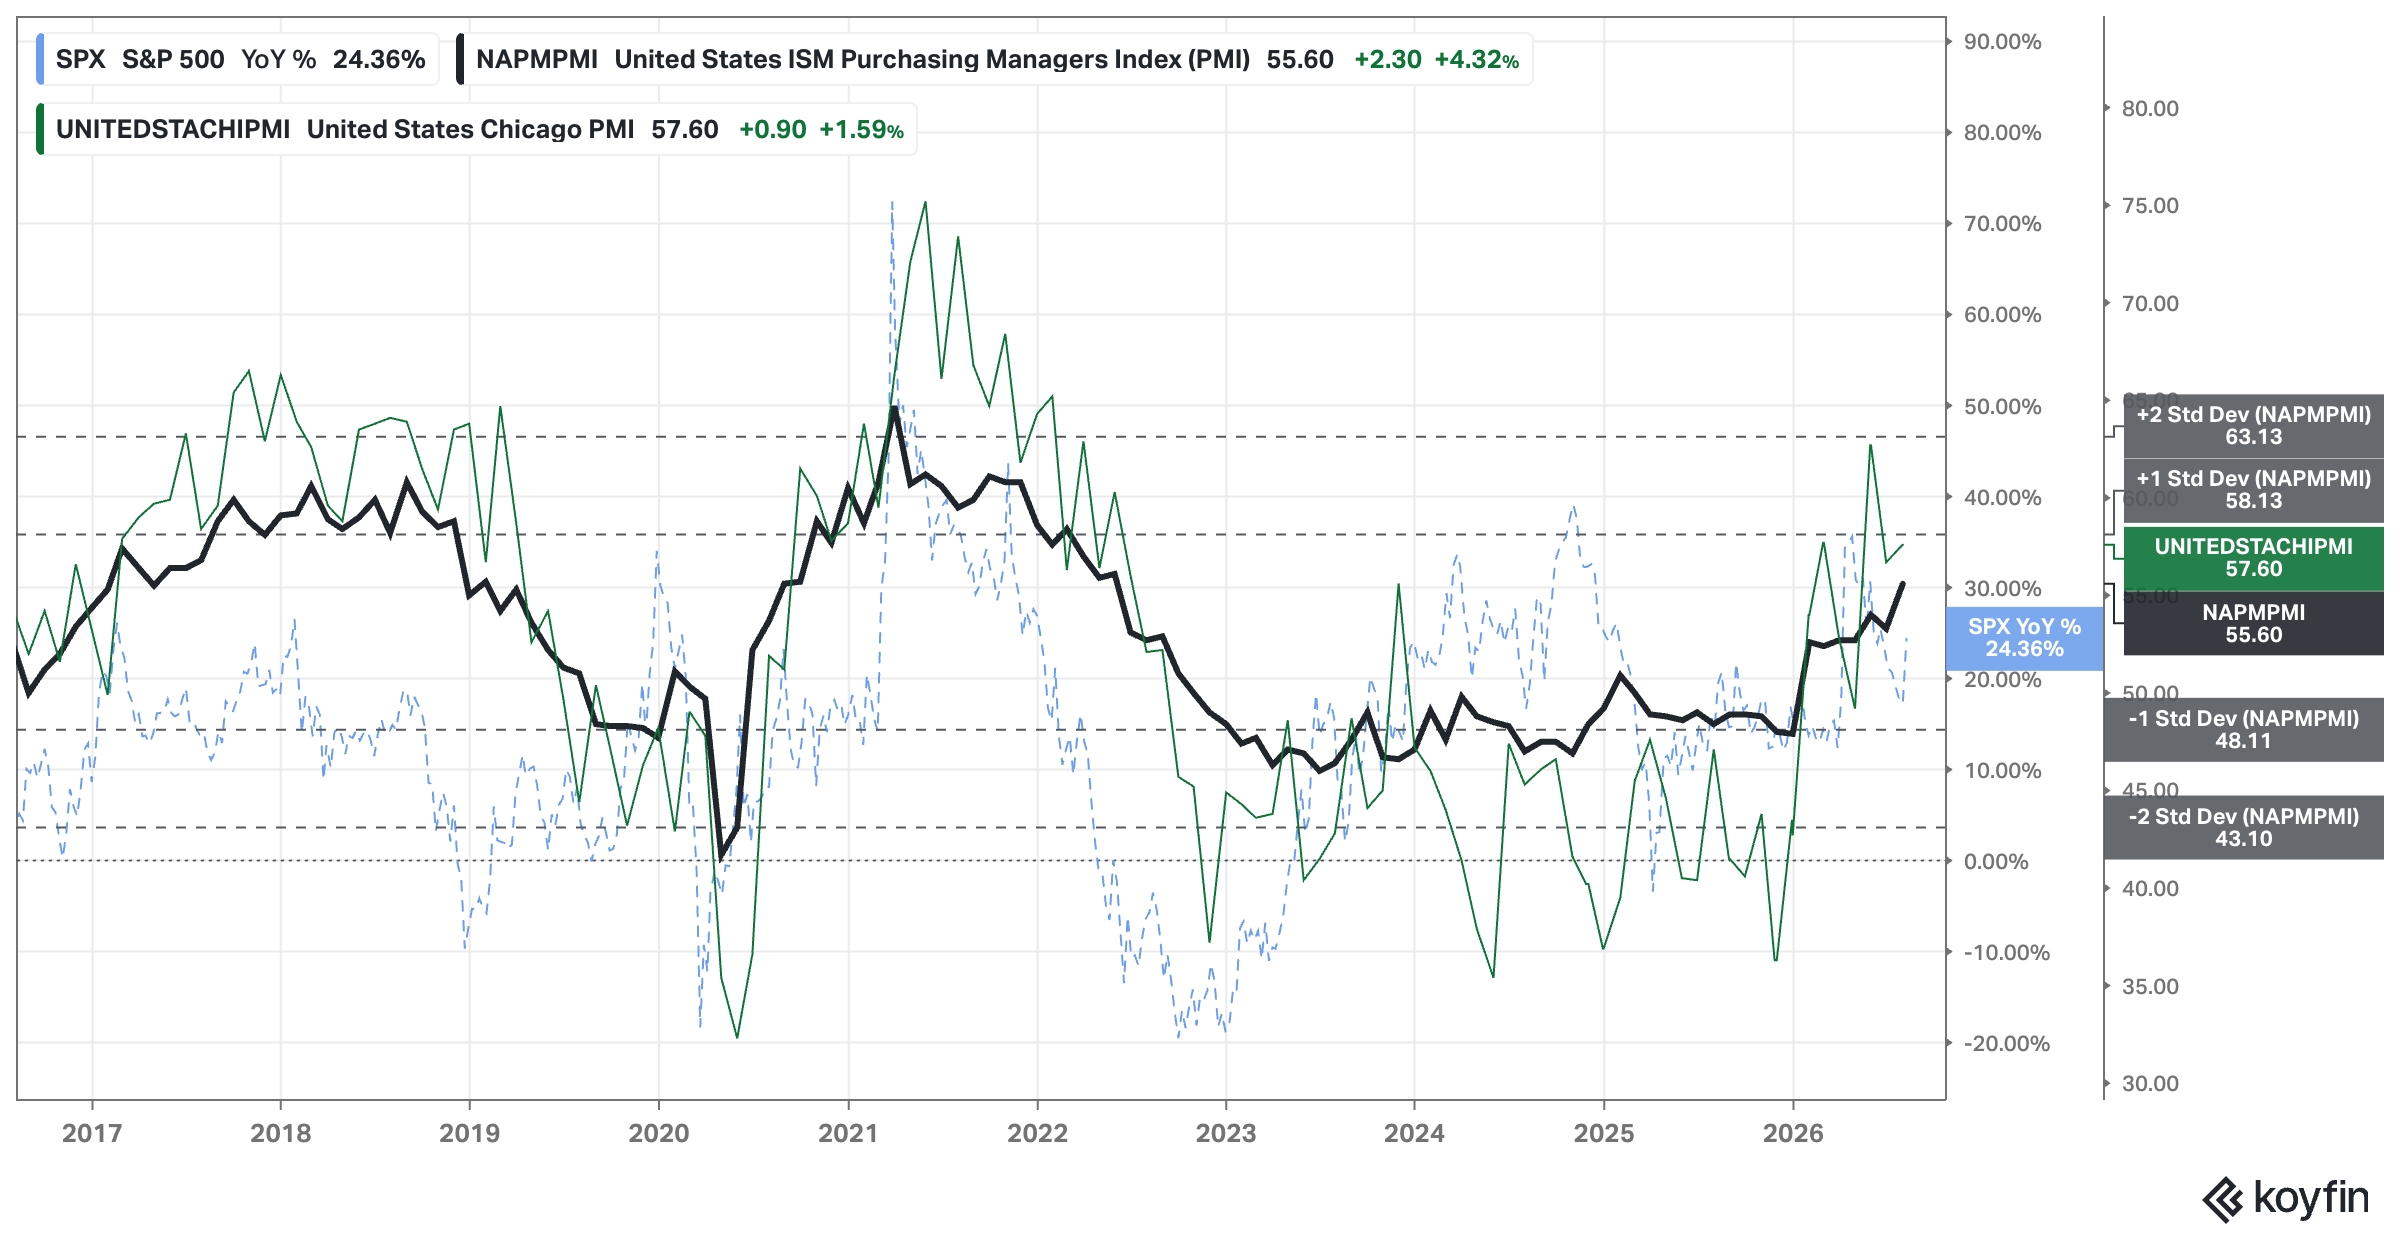
Analysis: Nice tick up on US ISM PMI. This is the bullish trend that we want to see in the economy to keep our optimistic outlook.
Outlook: Bullish
Economic Activity: Regional Banks Performance
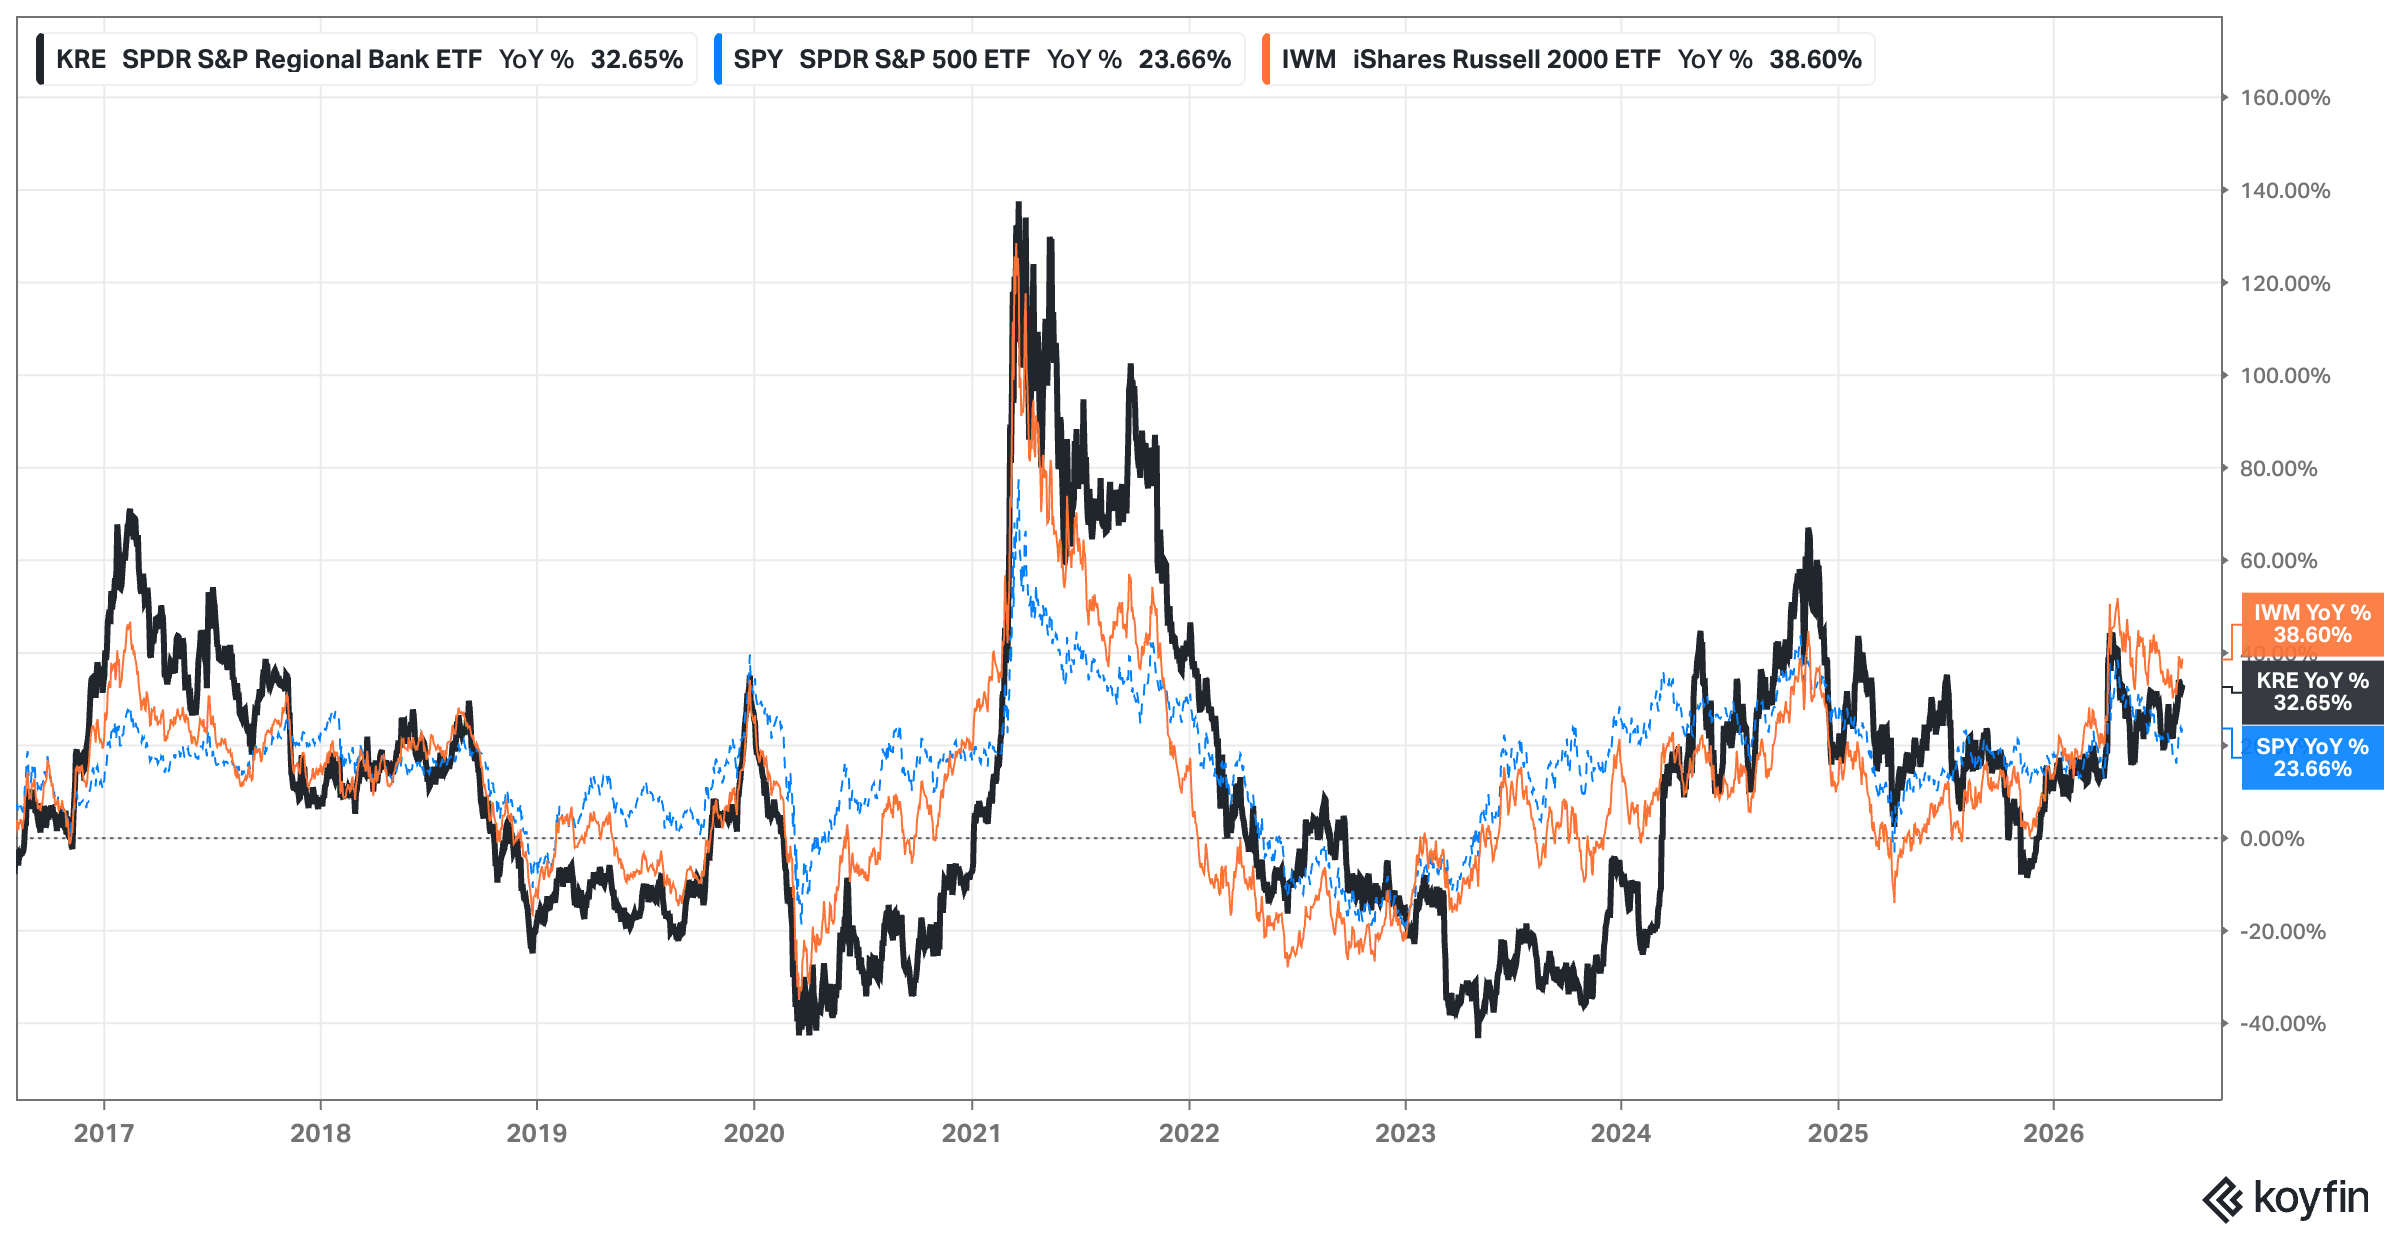
Analysis: KRE uptrend continues.
Outlook: Bullish
Interest Rates: FED, 2yr, 10yr, and 30yr Rates
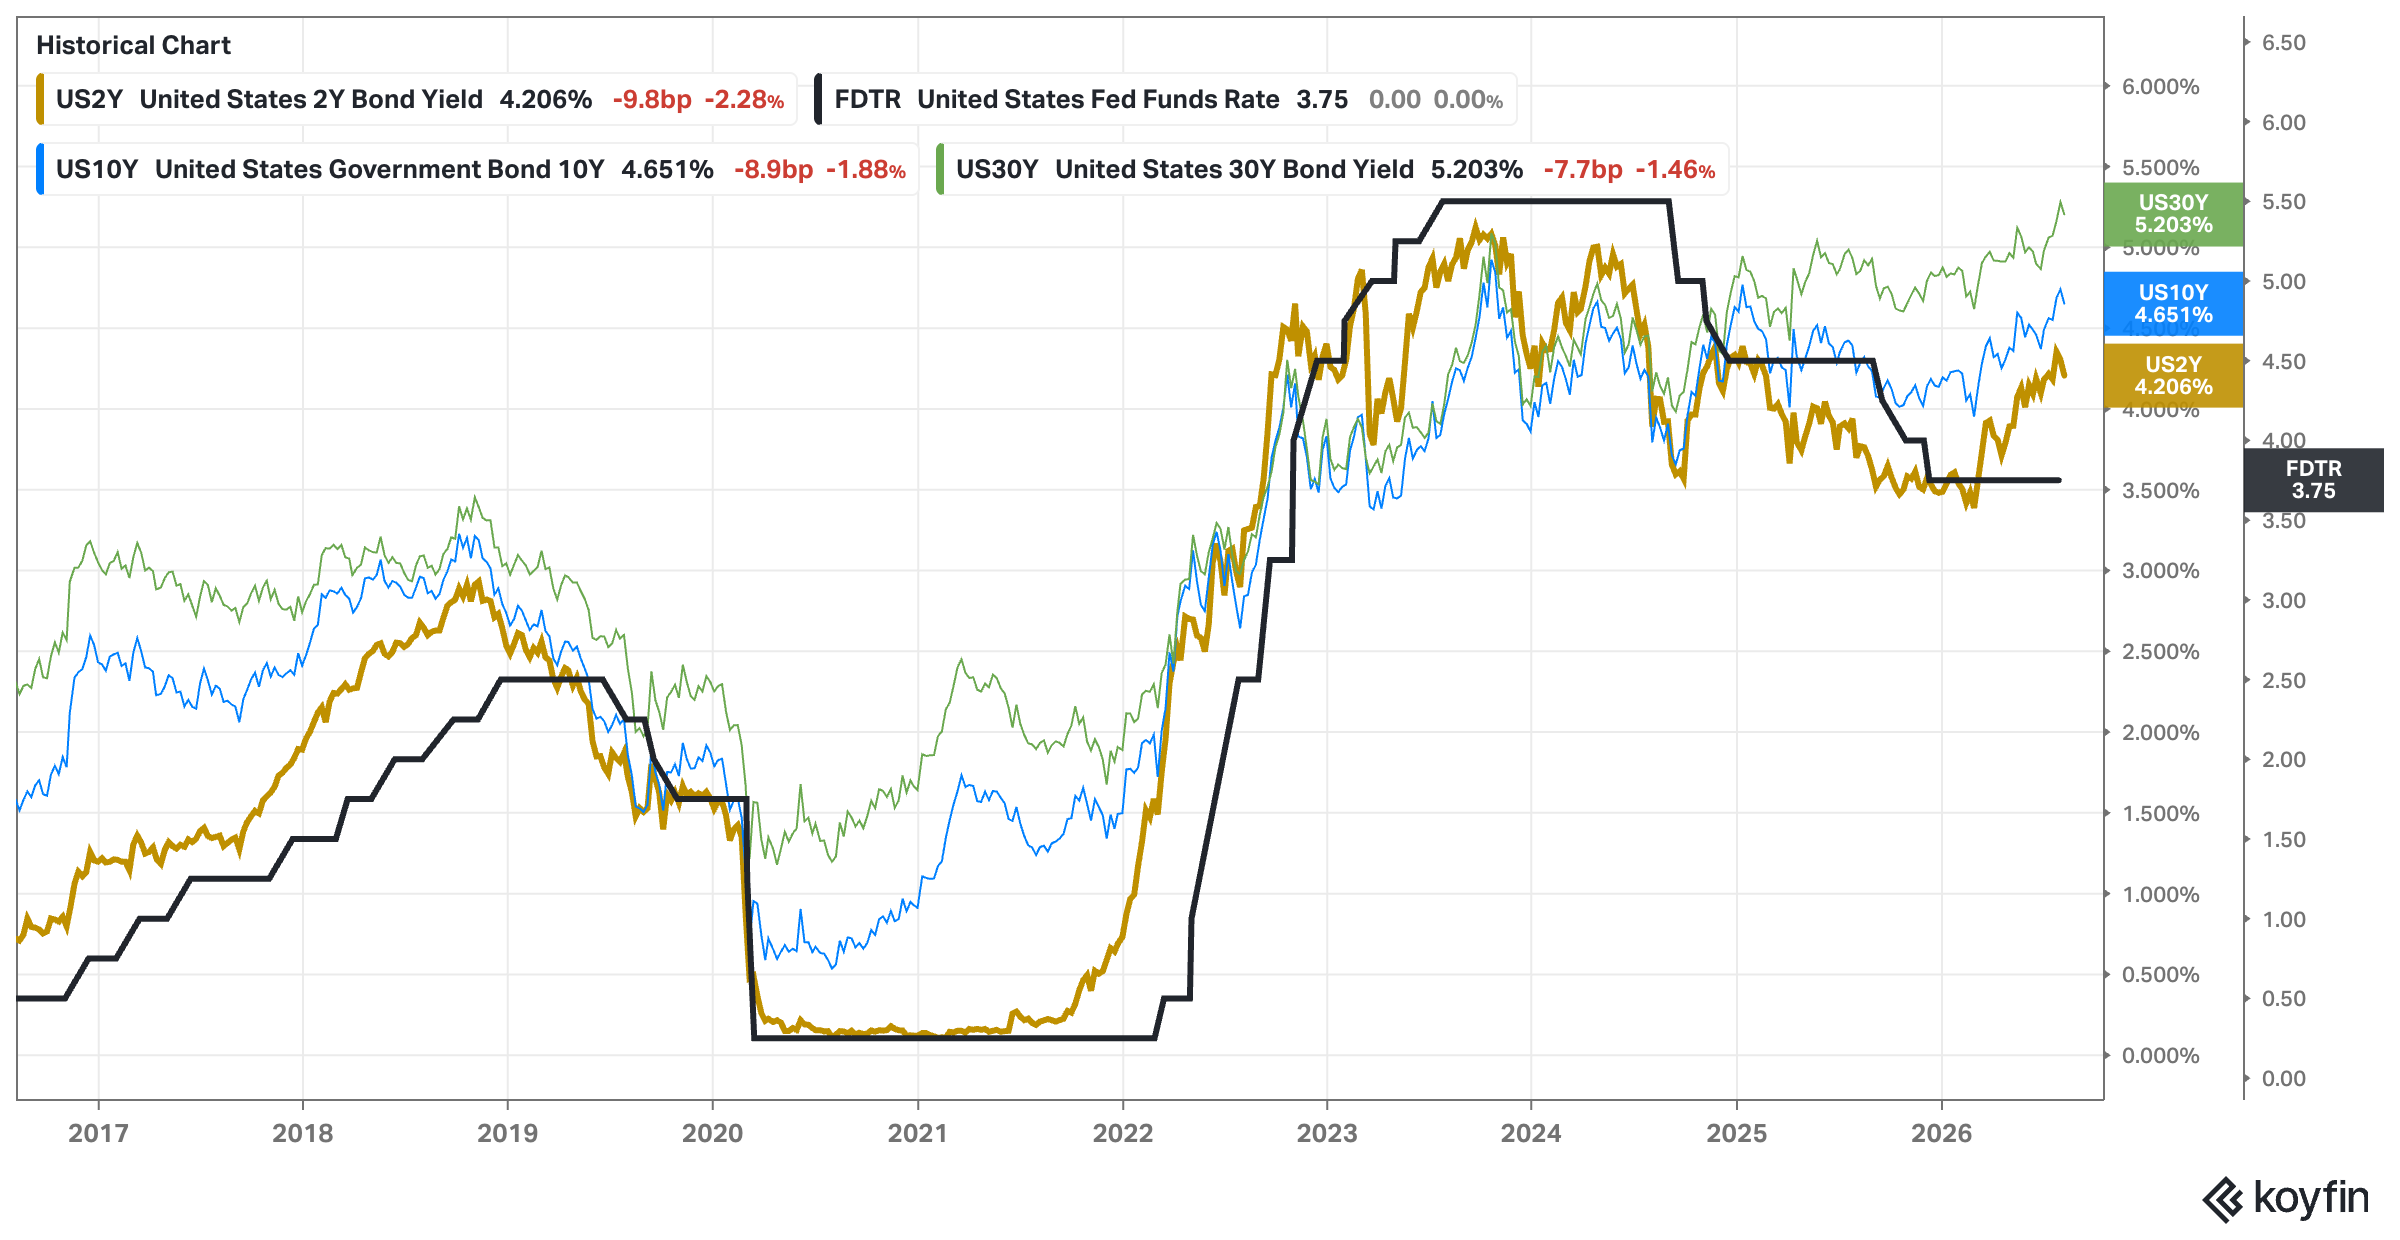
Analysis: The surprising weak job reports last Friday has cool down the probabilities of a rate hikes. It is still too soon to evaluate how this will impact rates, but at least is pulling them in the right direction, down.
Outlook: Neutral
Context: Why is it happening? Summary
Economic Production: Bullish
Economic Activity: Bullish
Interest Rates: Neutral
Indexes: What is happening?
TA: Price Action, Trend, Momentum & Volume:
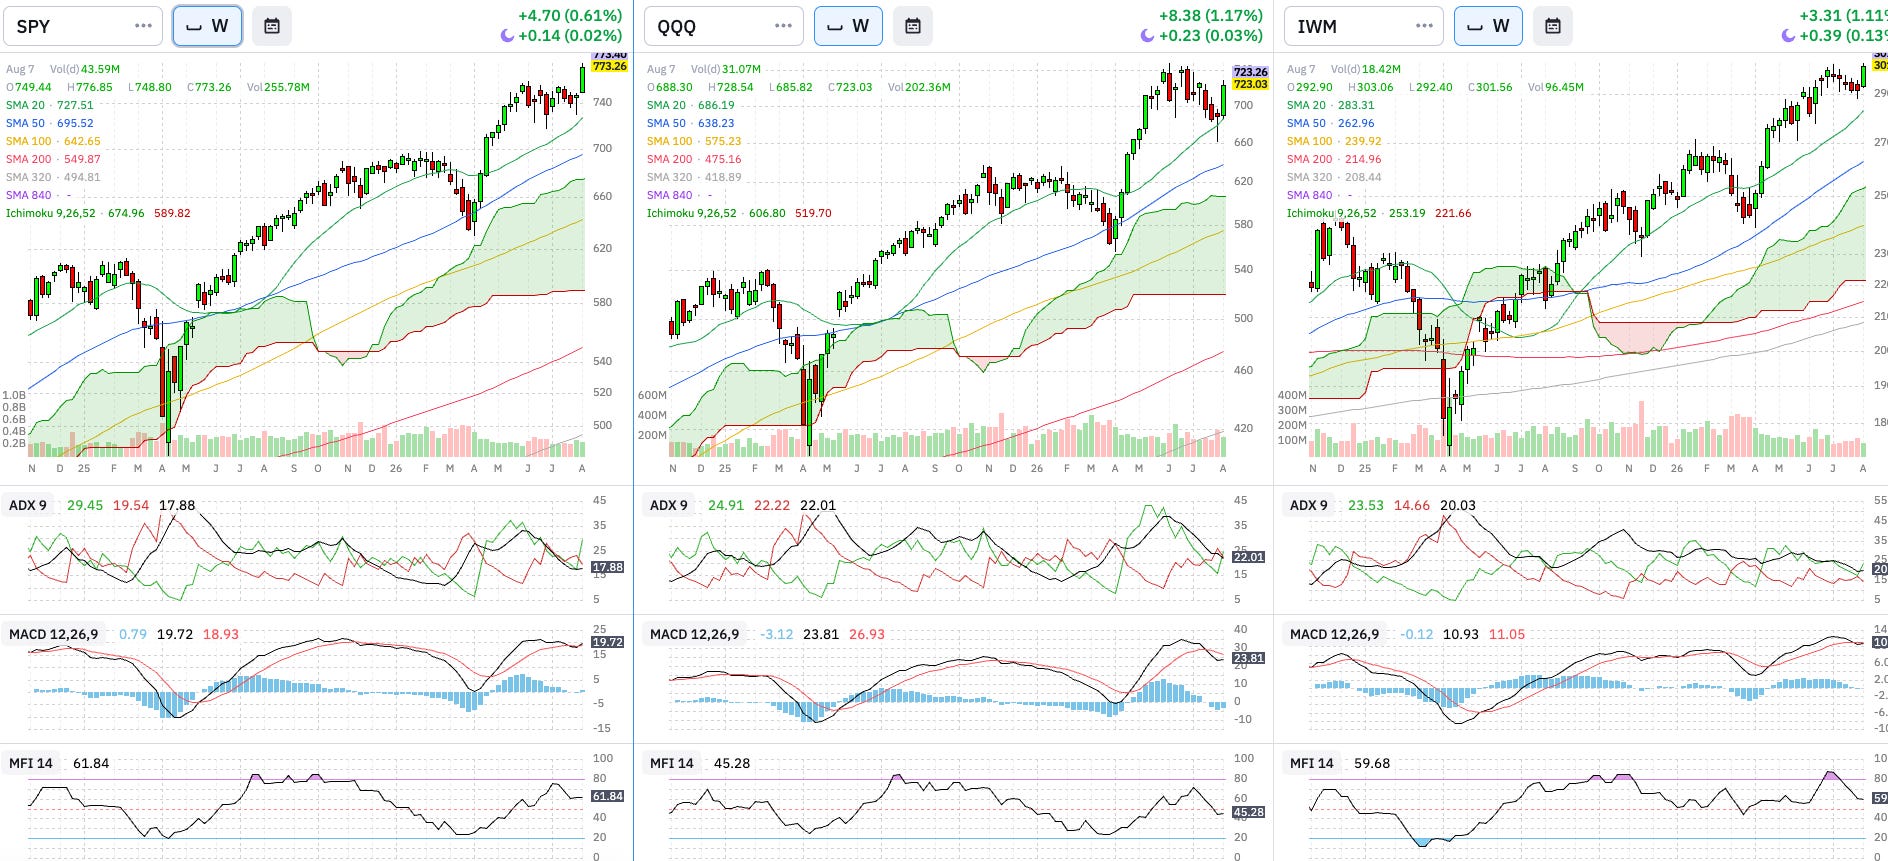
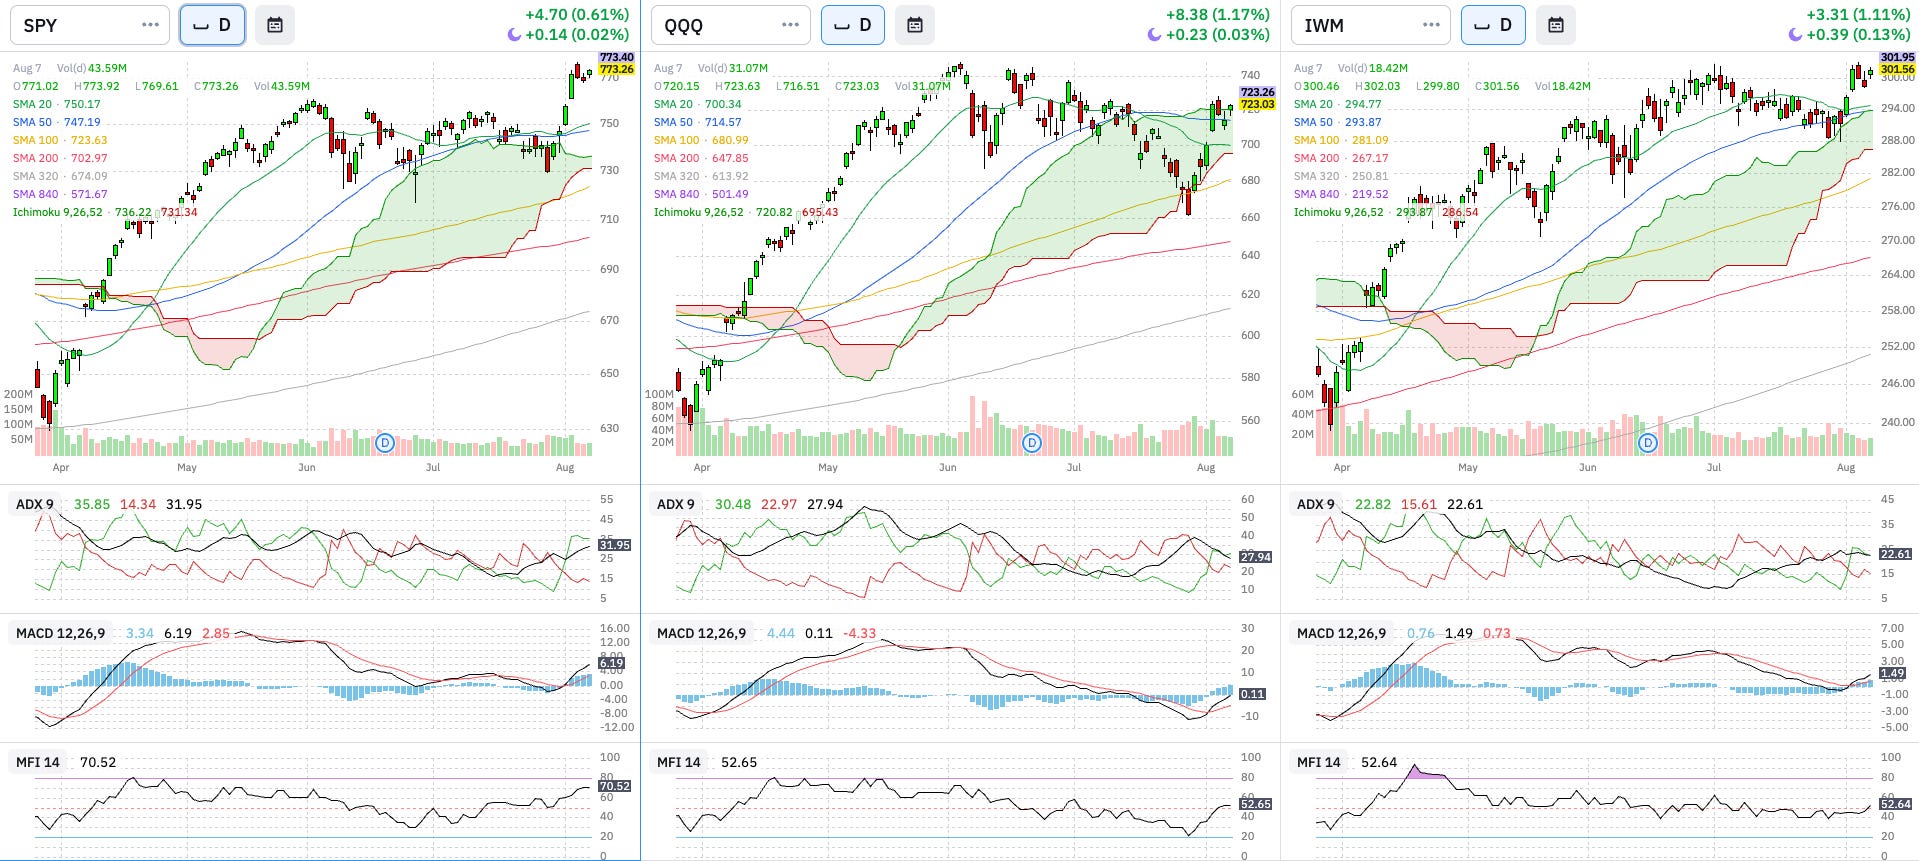
Weekly & Daily SPY, QQQ, and IWM
Technical Analysis:
Price (SMAs & Cloud): SPY well above all SMAs and Cloud. Daily QQQs just broke above the upper level in the cloud and all SMAs. IWM bounced off the cloud in the daily chart helped by both 20D and 50D SMAs.
Trend (Cloud & ADX): All indexes with bullish trends.
Momentum (MACD): Daily MACDs are pointing to an uptrend. Weekly MACDs are not aligned with daily indicators, signaling a possible downtrend or short-lived uptrend.
Volume (MFI): Nice bullish divergence in daily SPY. Daily QQQ turned up. While daily IWM is quite flat.
Outlook: Neutral to Bullish
Breadth: % Stocks above SMAs
Above 200 Daily SMA
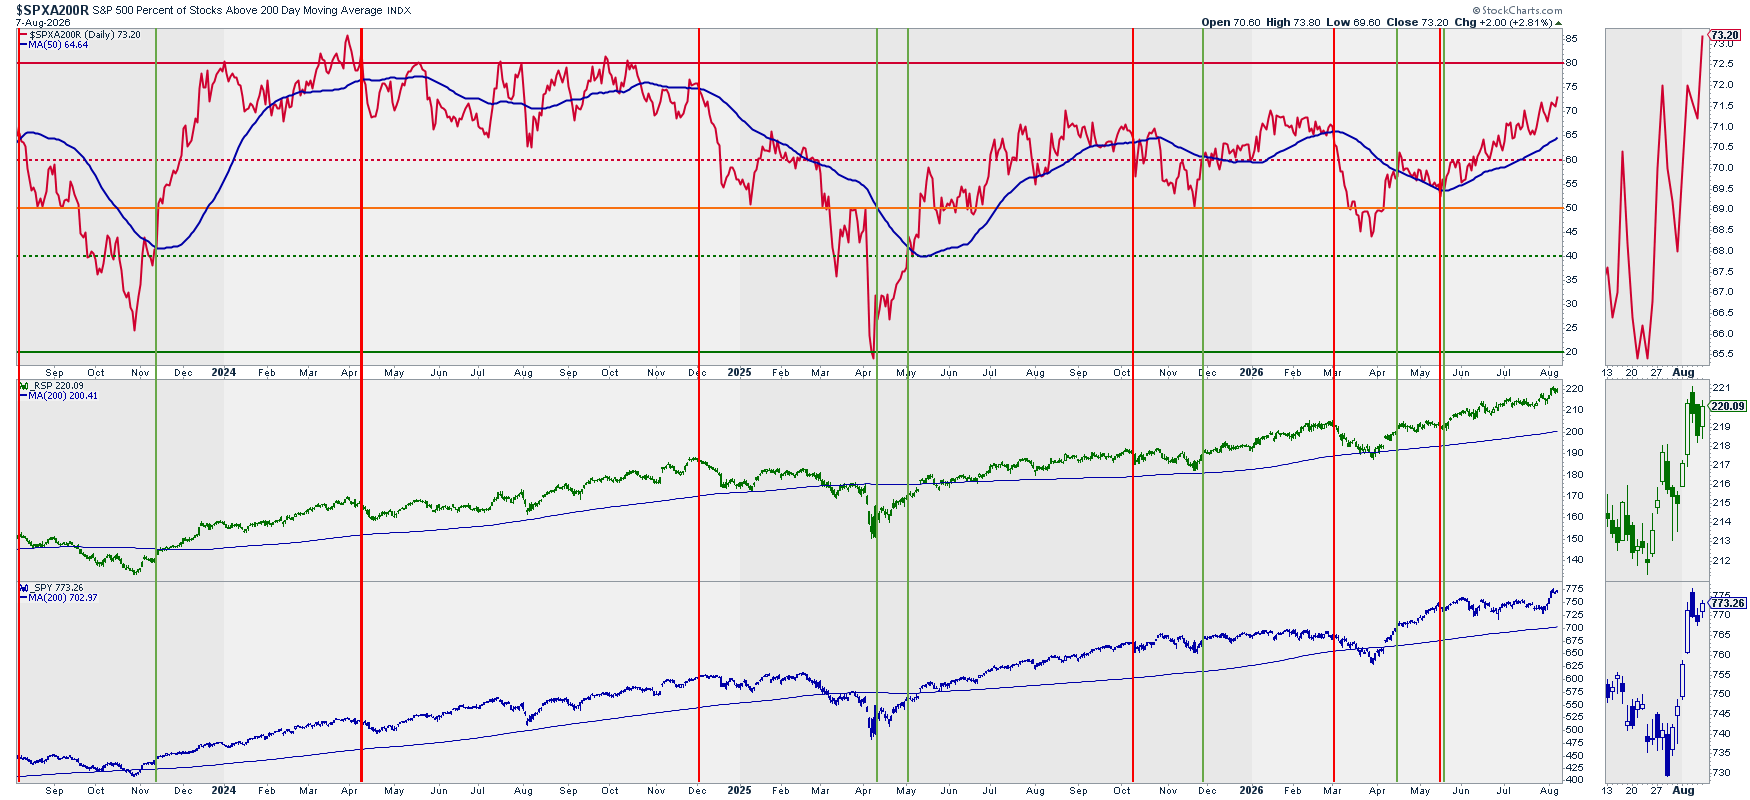
Above 20, 50, and 200 Daily SMAs vs. RSP
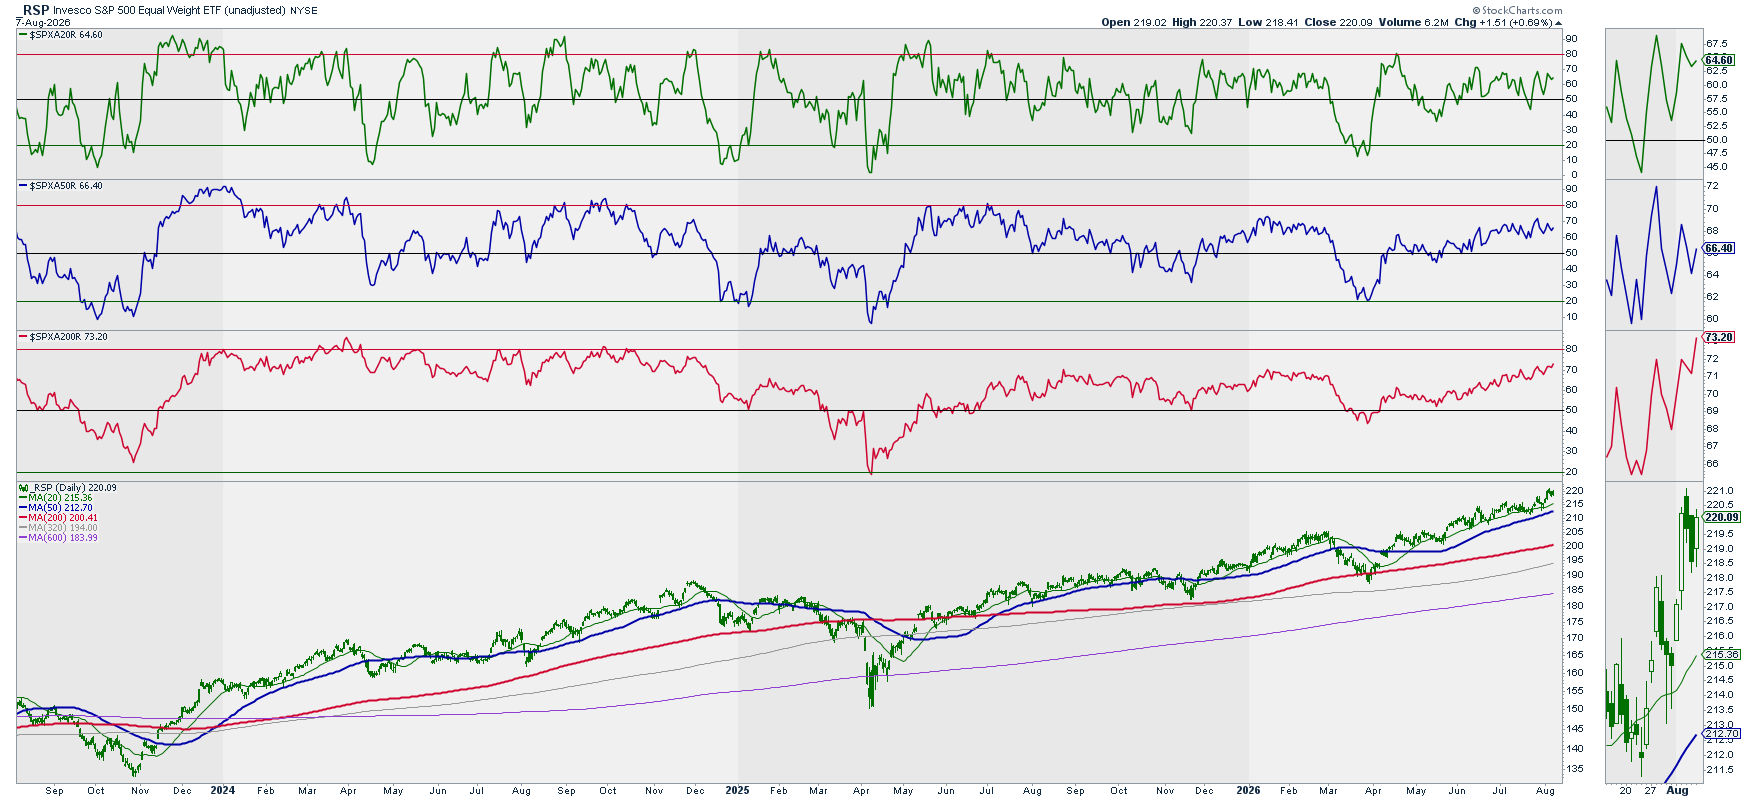
Analysis: All indicators show a bullish trend.
Outlook: Bullish
Volatility: Ratio Low Vol. Stocks / SPY vs. RSP & SPY
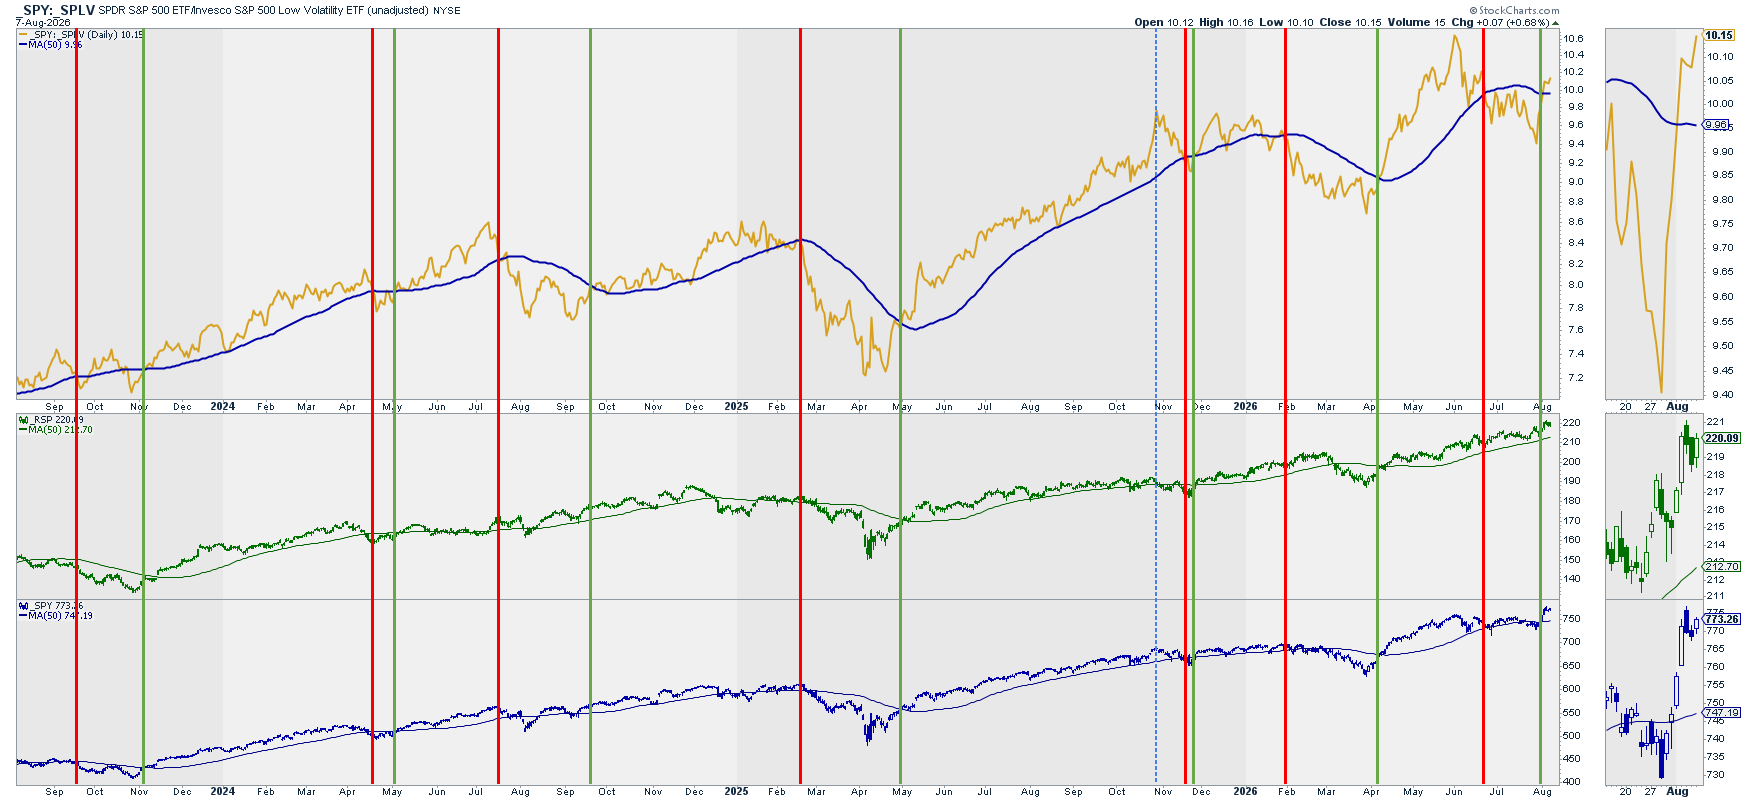
Analysis: Sharp increase in this very reliable indicator. We move directly from a bearish to a bullish outlook.
Outlook: Bullish
Volatility: (Inverted) VIX vs. SPY
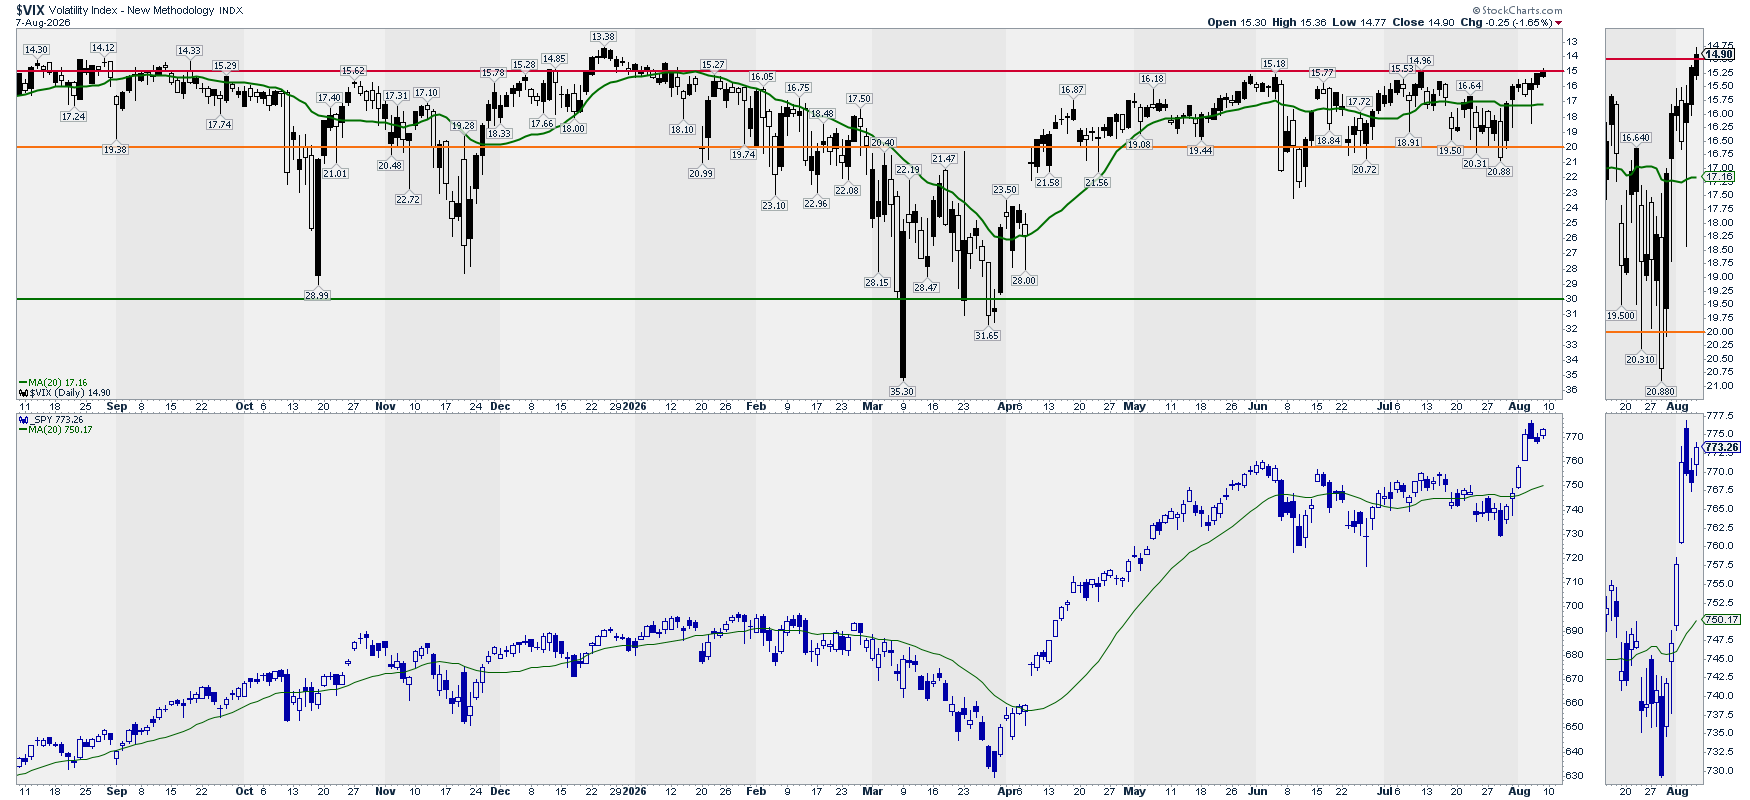
Note: This chart is mainly to detect extreme volatility situations that, once they reverse, offer great long opportunities in the market.
Analysis: With the recent market uptrend, the VIX dropped to the level 15 and the trend remains very stable since May.
Options: (Inverted) Put/Call Ratio vs. SPY
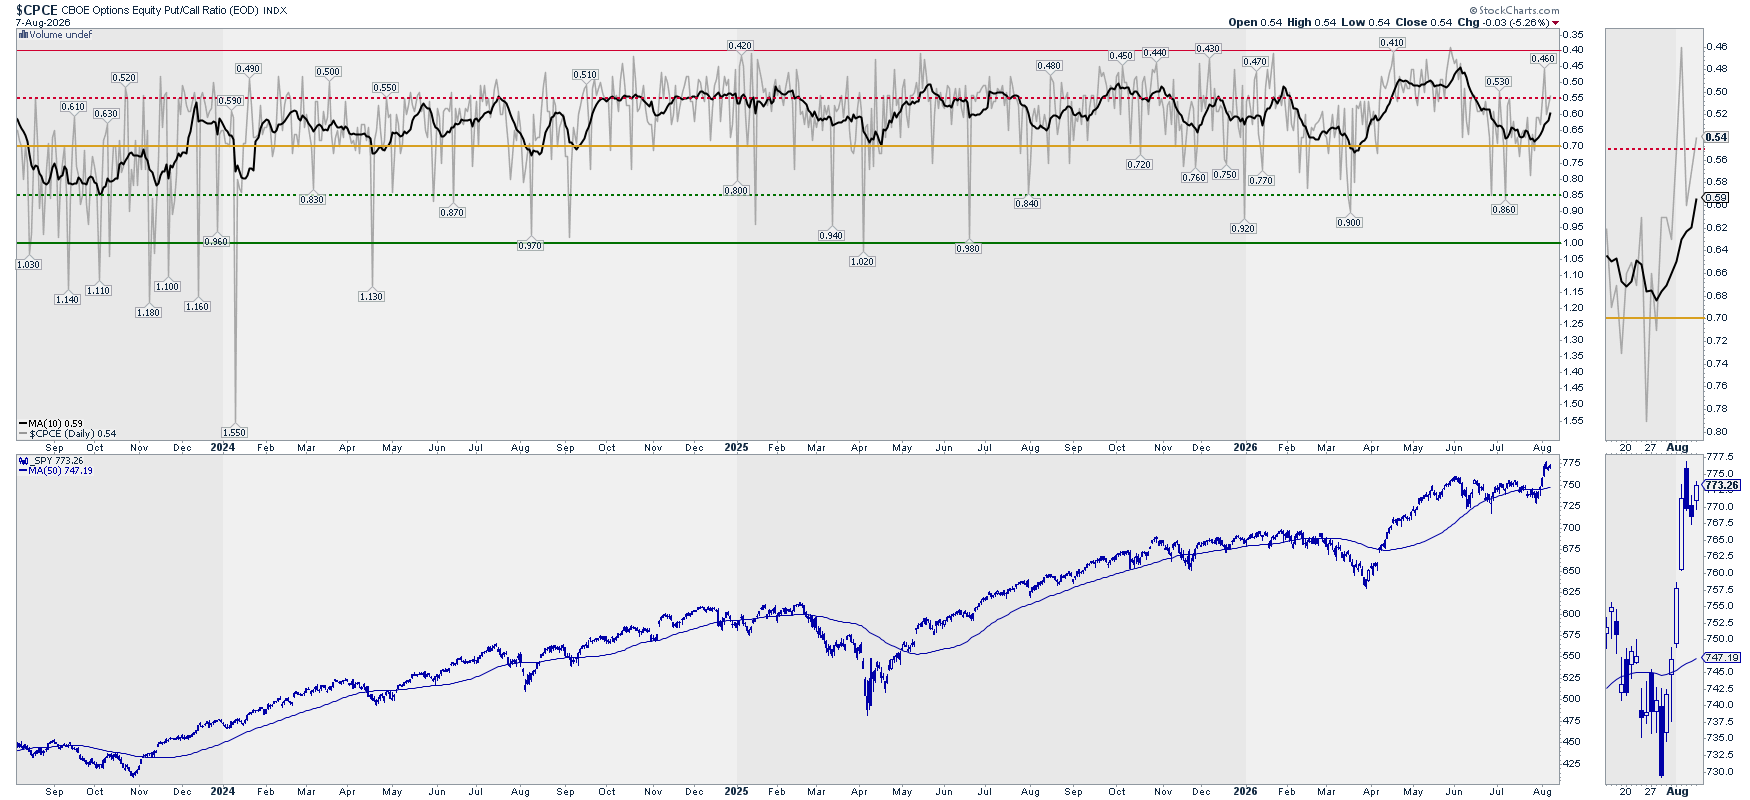
Analysis: P/C ratio has sharply reversed upwards. This could bring some bullish action in the short-term.
Outlook: Bullish
Options: Gamma Exposure – SPY
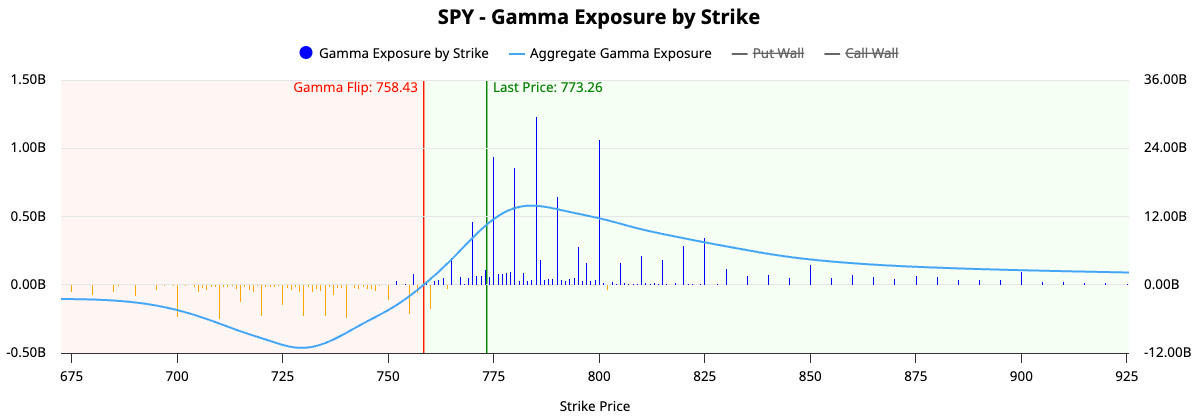
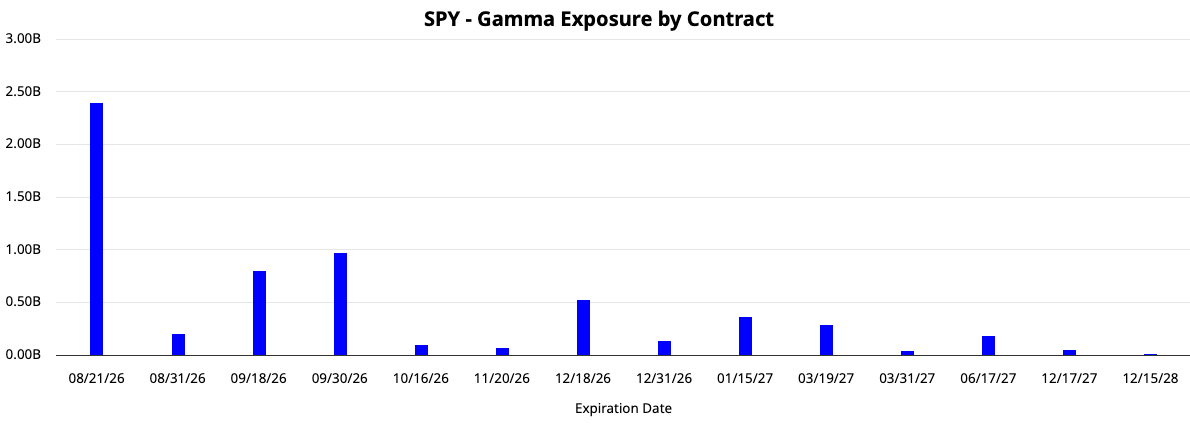
Analysis: What a flip! GEX has gone from negative to positive in just one week action.
Outlook: Bullish
Indexes: What is happening? Summary
Technical Analysis: Neutral to Bullish
Breadth: Bullish
Volatility: Bullish
Options: Bullish
Sectors: Where is it happening?
Sectors Rotation
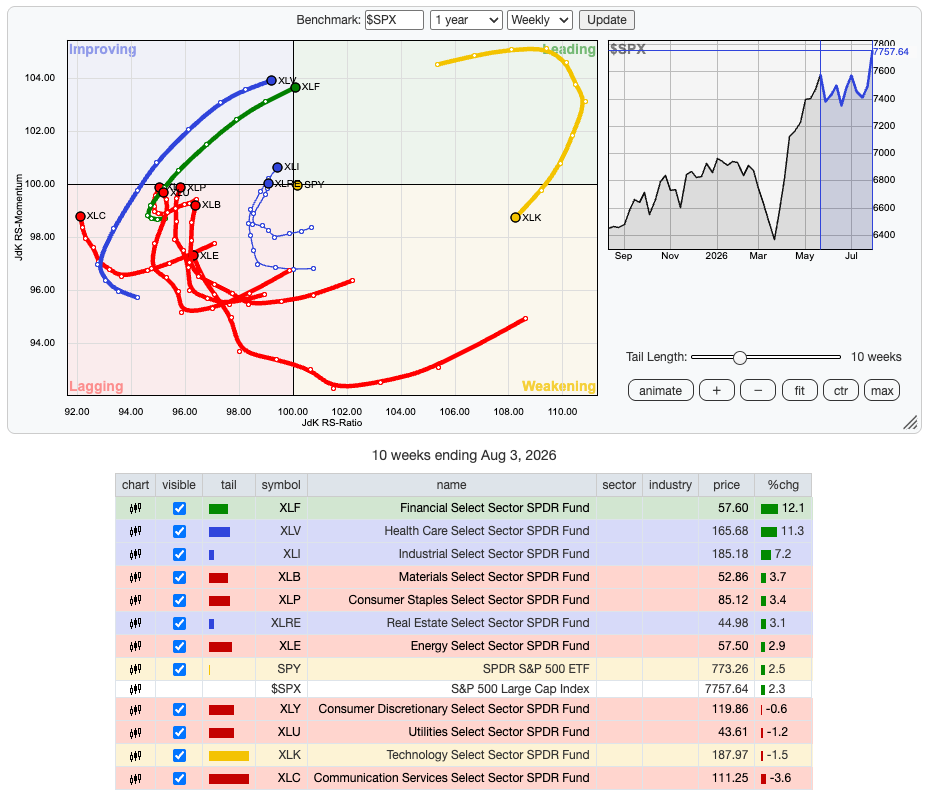
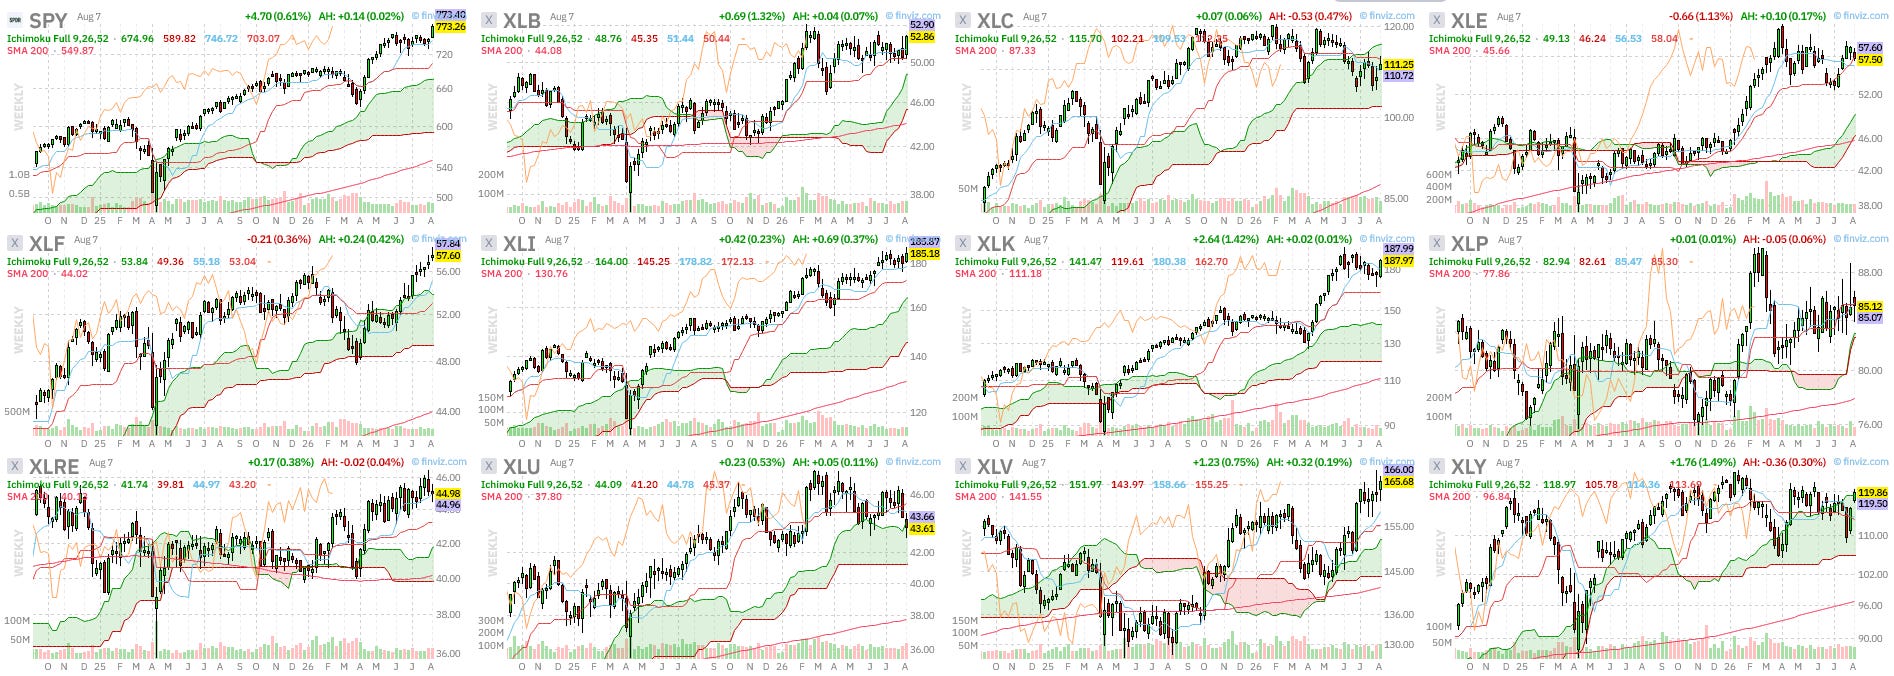
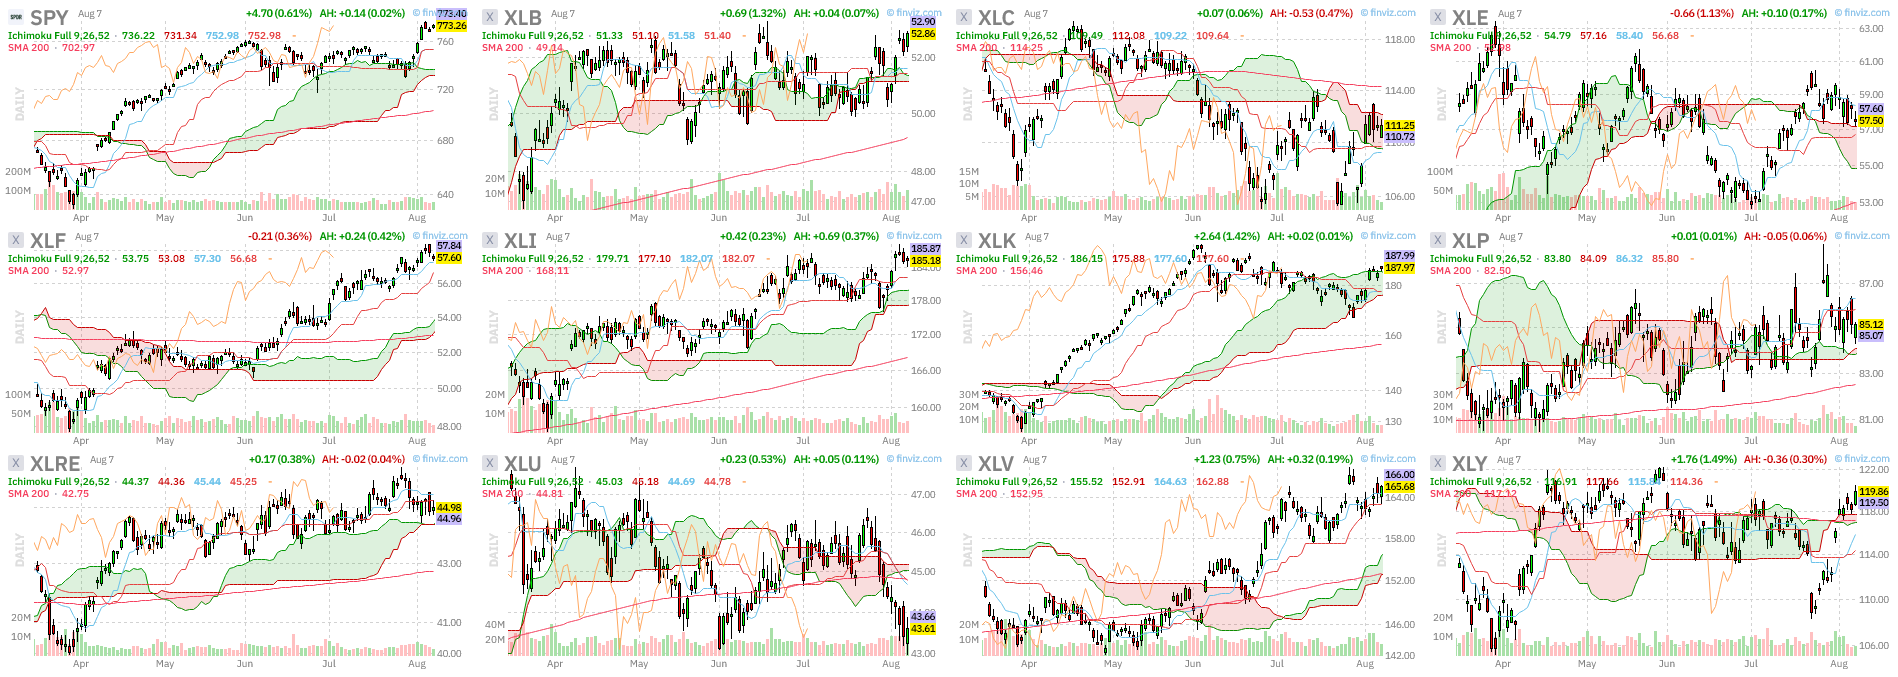
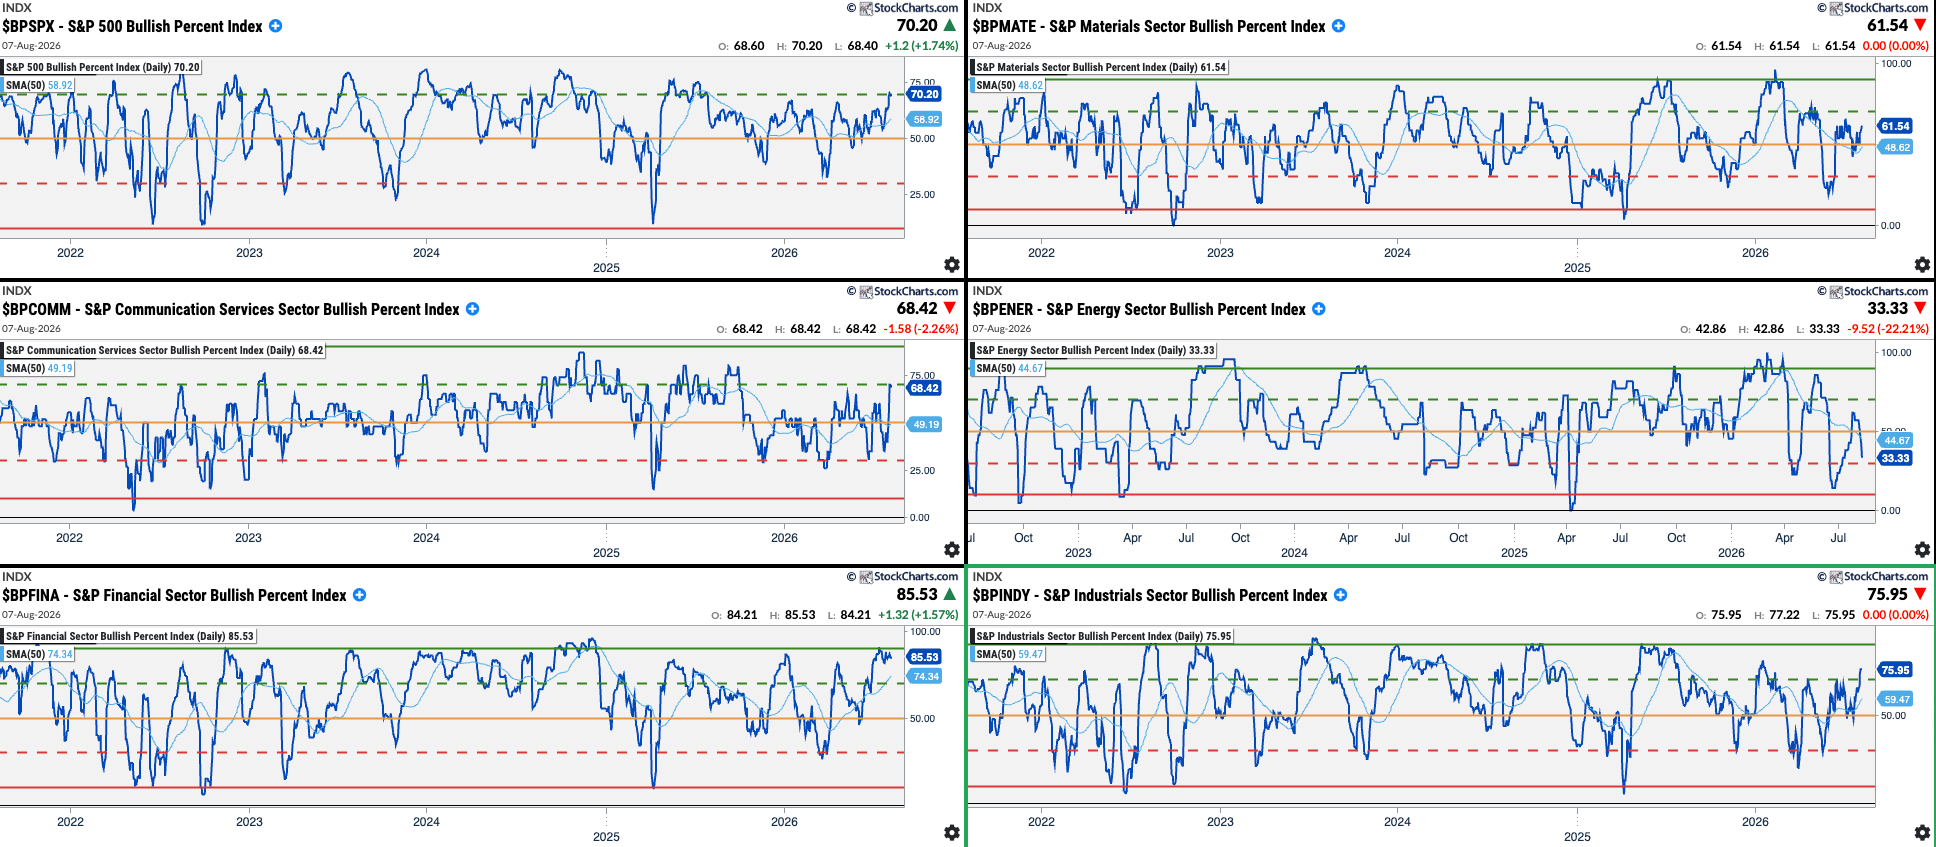
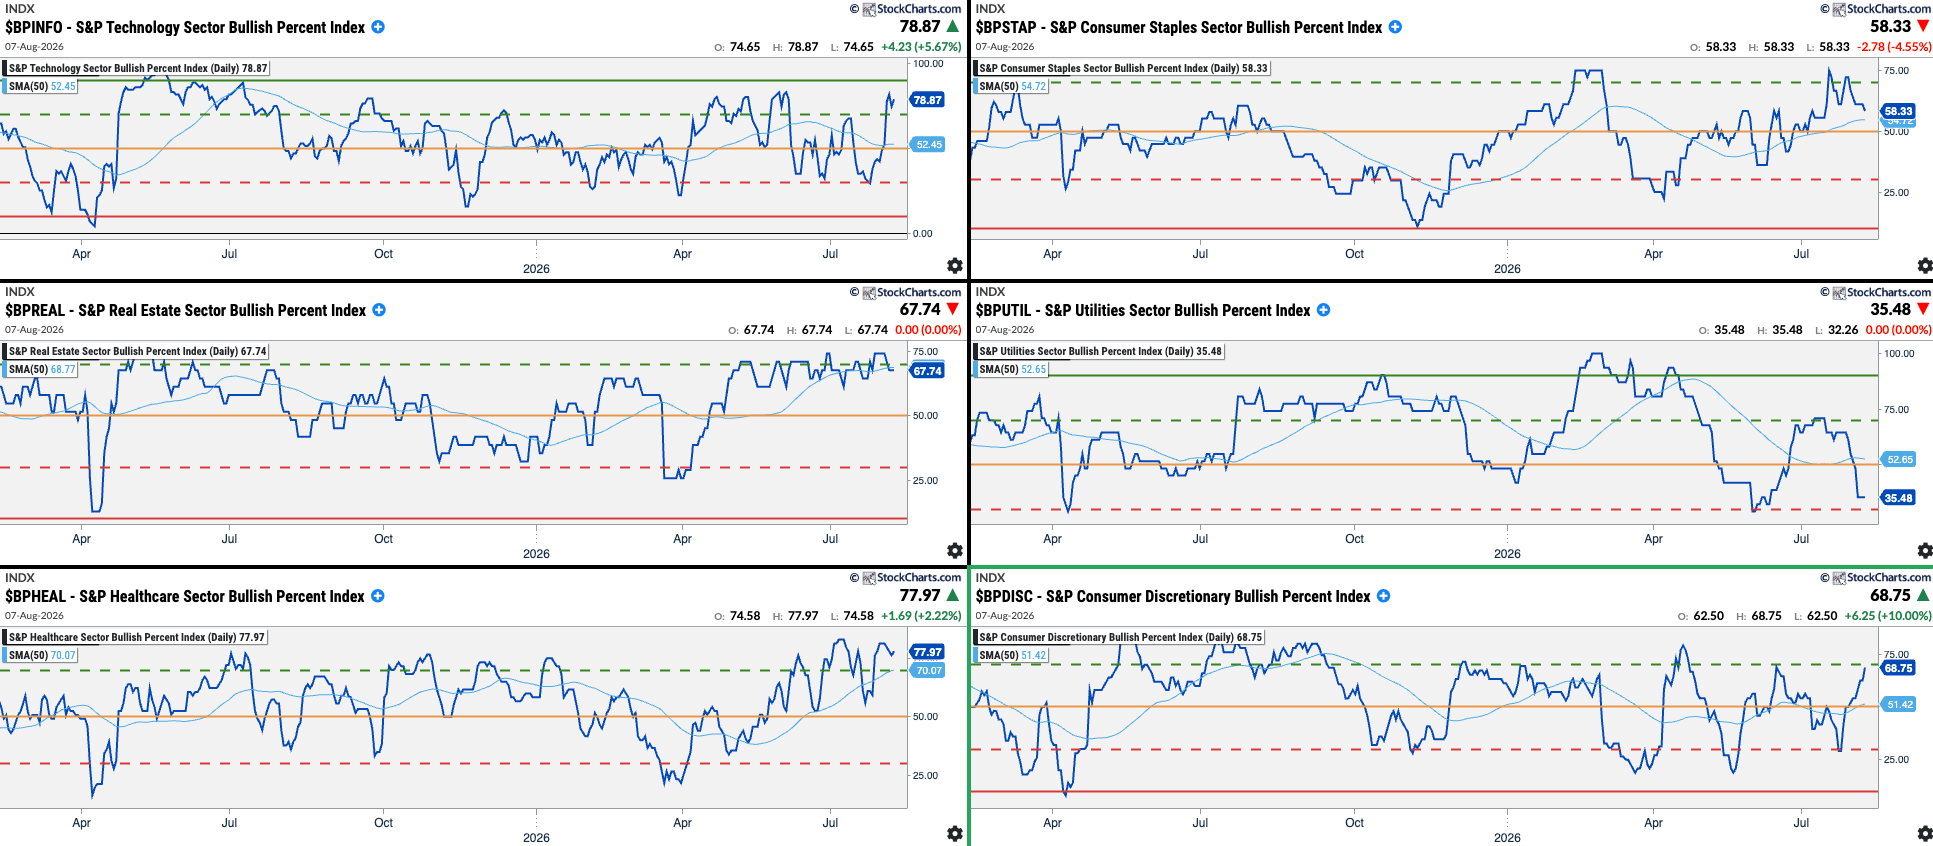
Summary:


Last Word
The velocity of this market is really high. Last week, we were coming from a weak July and we were expecting a weak entry into August. Instead, we had one of the best weeks in a long time, with S&P 500 reaching to new all time highs touching 7,800.
The strong US economy is resisting 2 wars, tariffs, “high” interest rates, DeepSeek moments, and even a hedge fund blowing off. Nothing seems to seriously impact this market. 8,000 there we go!
Disclaimer: The content on AMAT Investing is strictly for educational and learning purposes. The author is not a licensed financial advisor and holds no formal financial education. This post does not constitute professional financial advice. All investing involves risk of loss. Always conduct your own research and consult a licensed professional before making any investment decisions.