

Weekly Review - 2026-Apr-24
Tech is back!

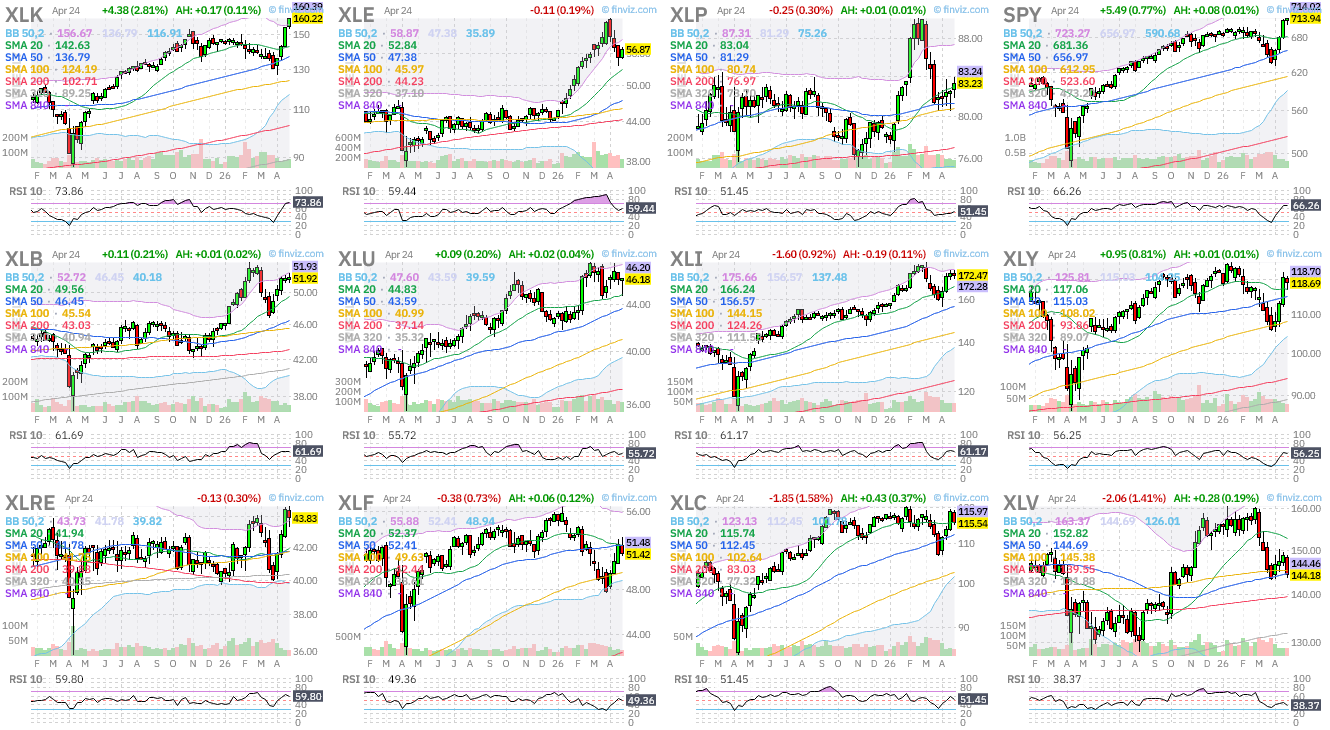
US Cap. Weighted Sectors ordered by weekly performance (desc):
Weekly:
Daily:
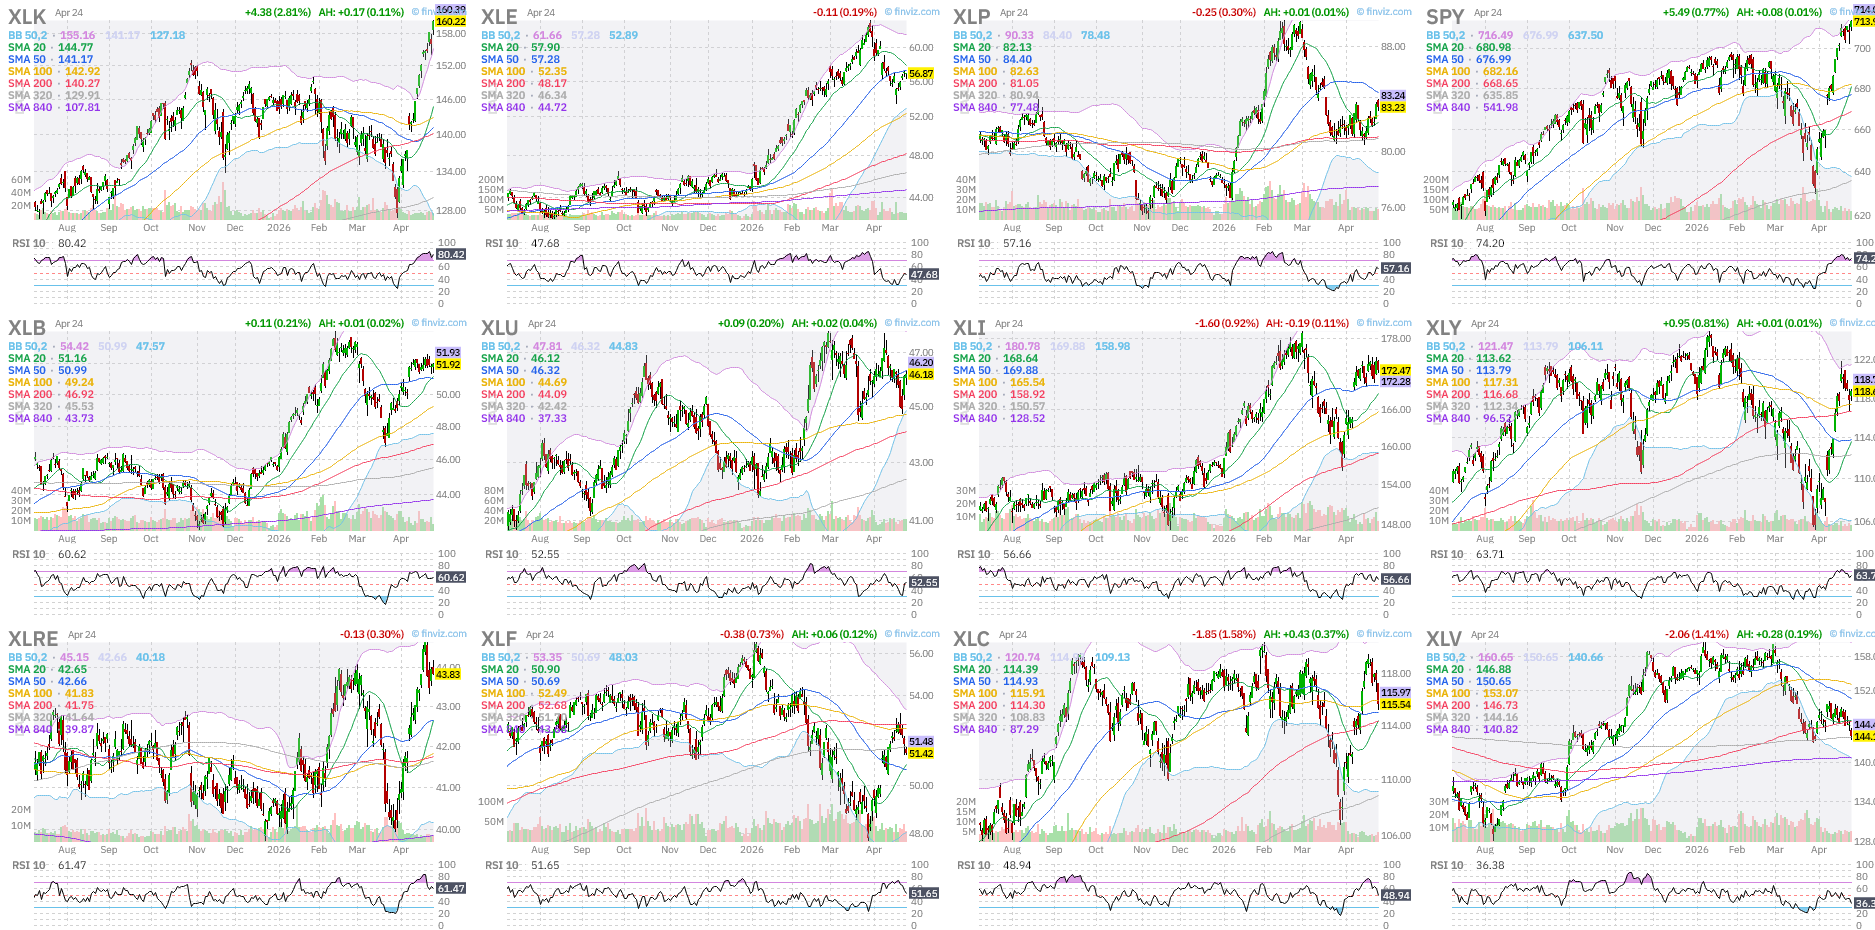
Comment: XLK is on the lead back again, and that is good. Is good to see leaders leading. XLE had a good week due to geopolitical events. Once these events are gone, XLE will fade to the back.
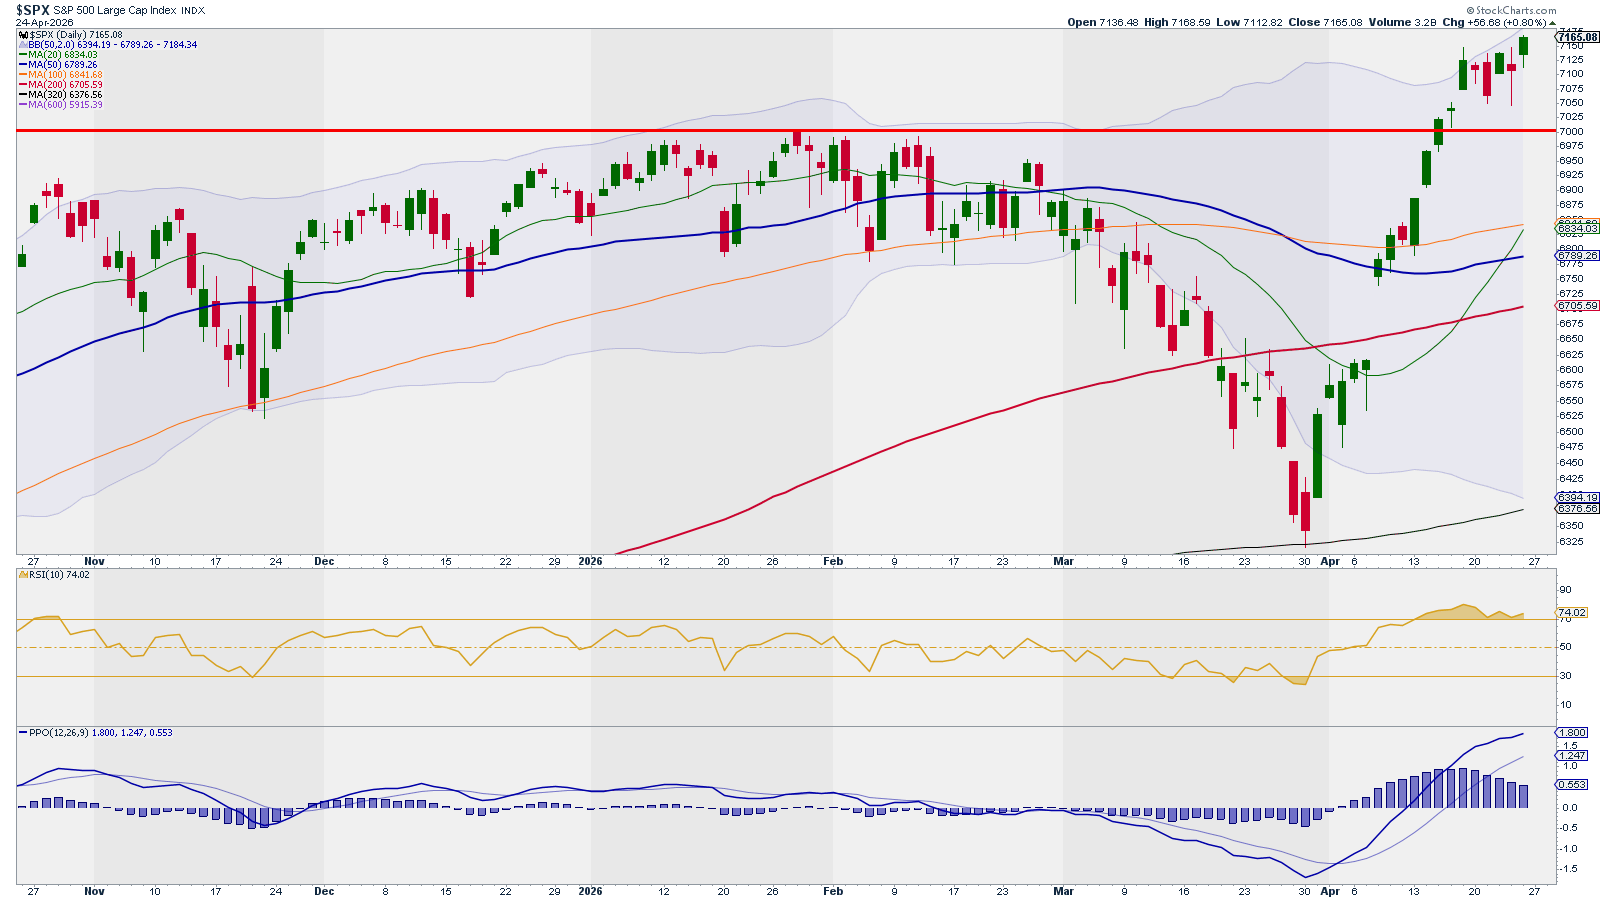
S&P is over extended, no doubt about it, and looking back to the latest V-shaped recovery (April 2025), it shall stall for a while waiting for the 20D SMA for support.
Level 1: Why is it happening?
Economic Data: Production: ISM PMI vs. SPX
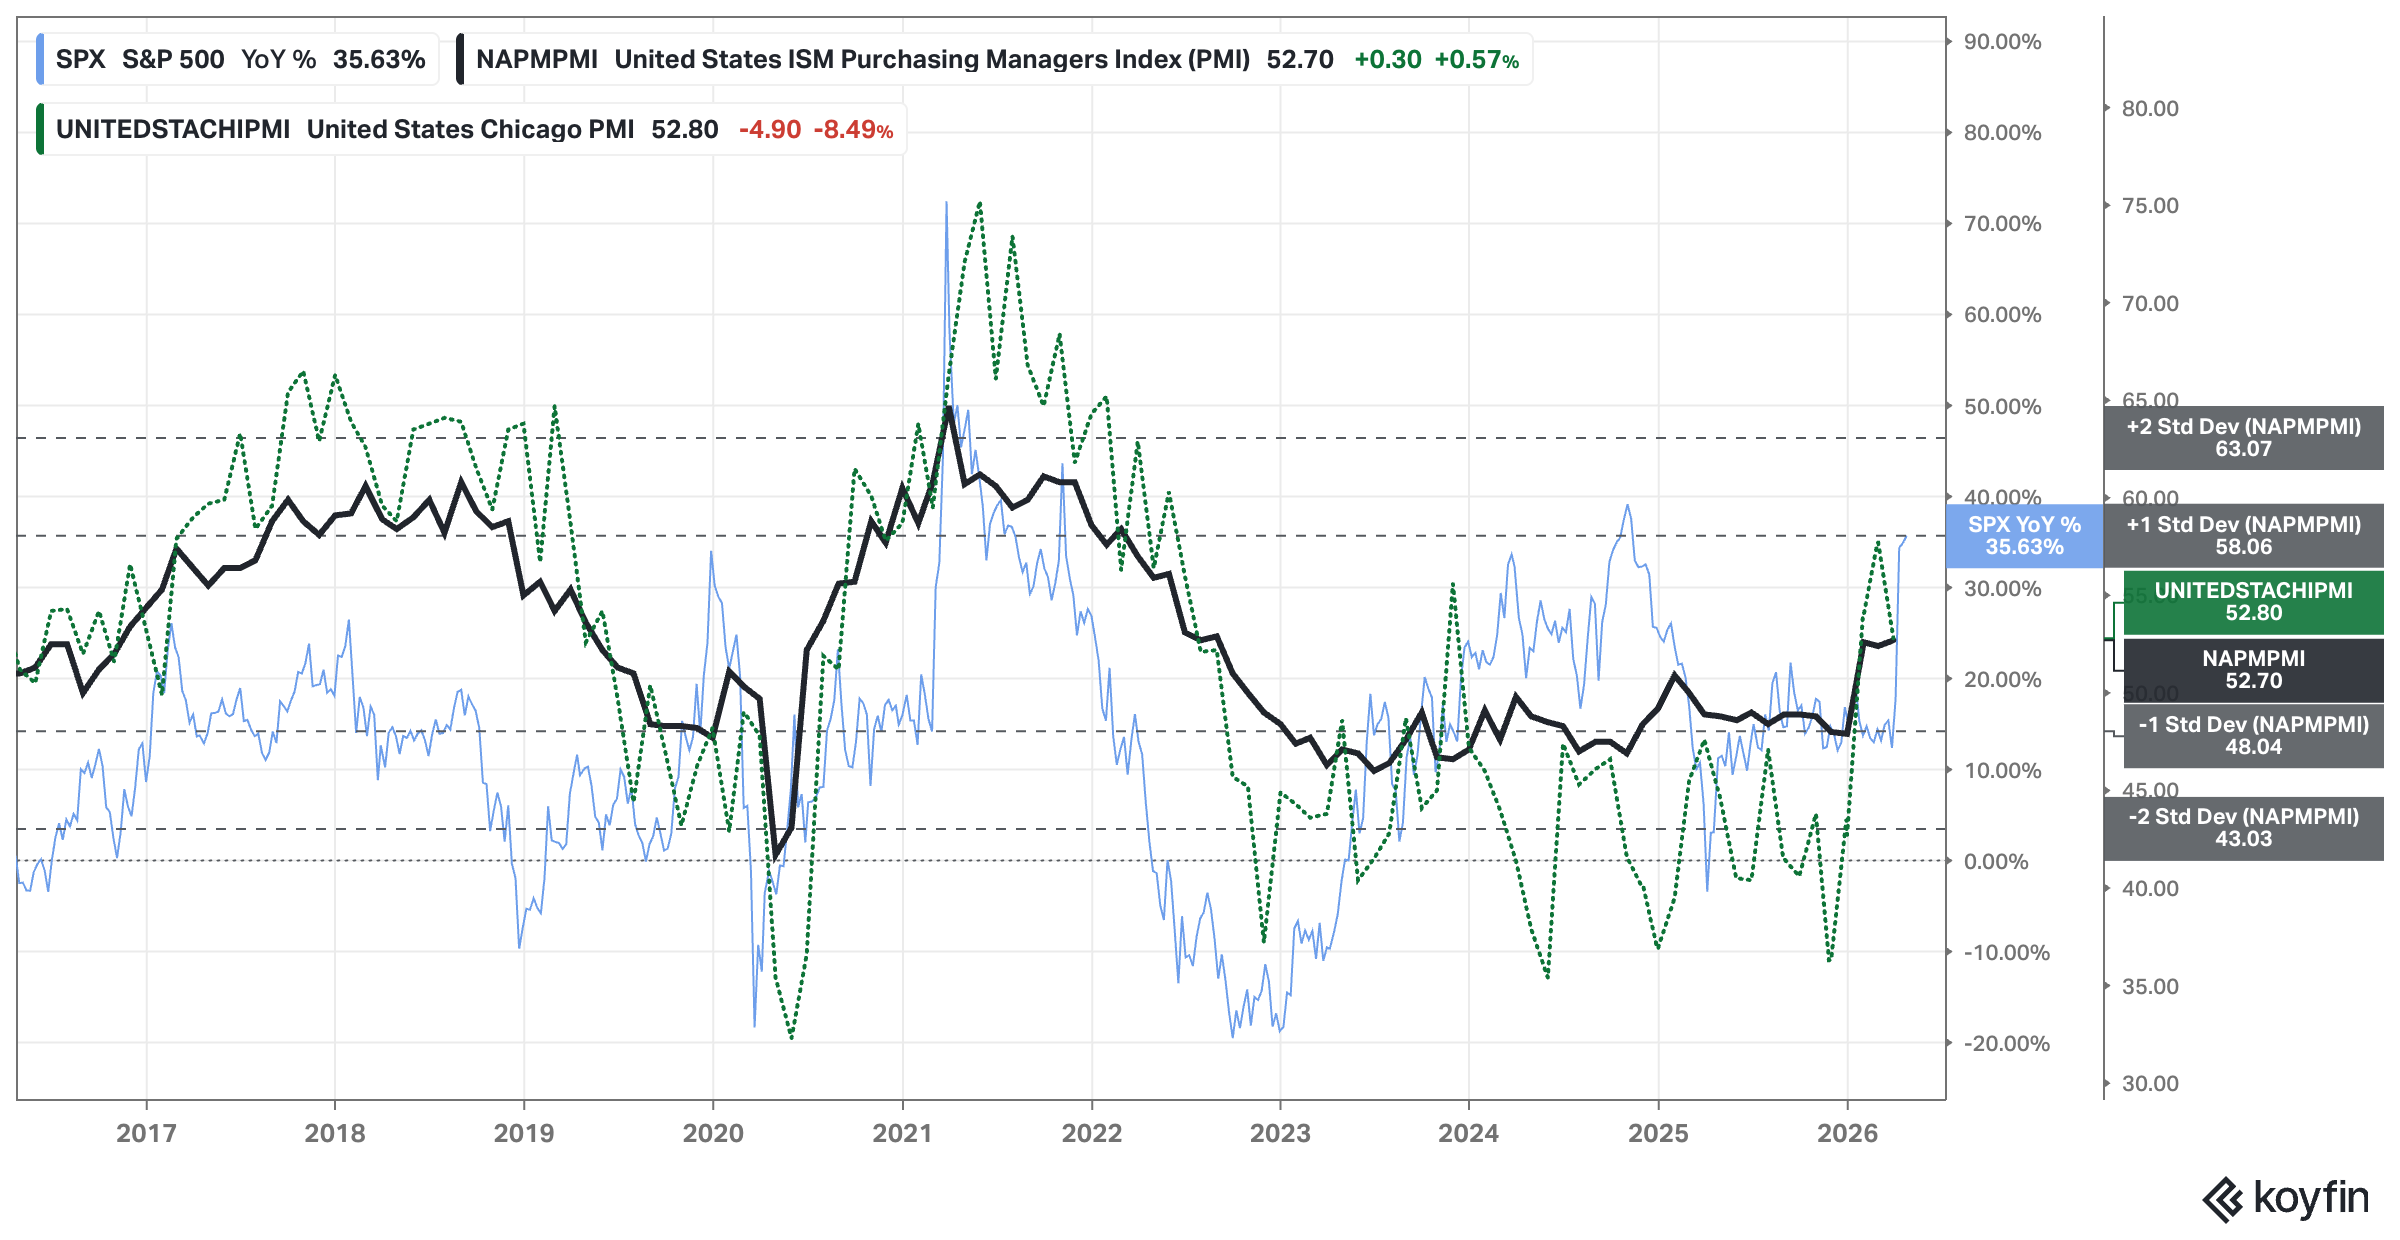
Analysis: No changes since last week.
Outlook: Bullish
Economic Data: Production: Dallas & Philadelphia Manufacturing vs. SPX
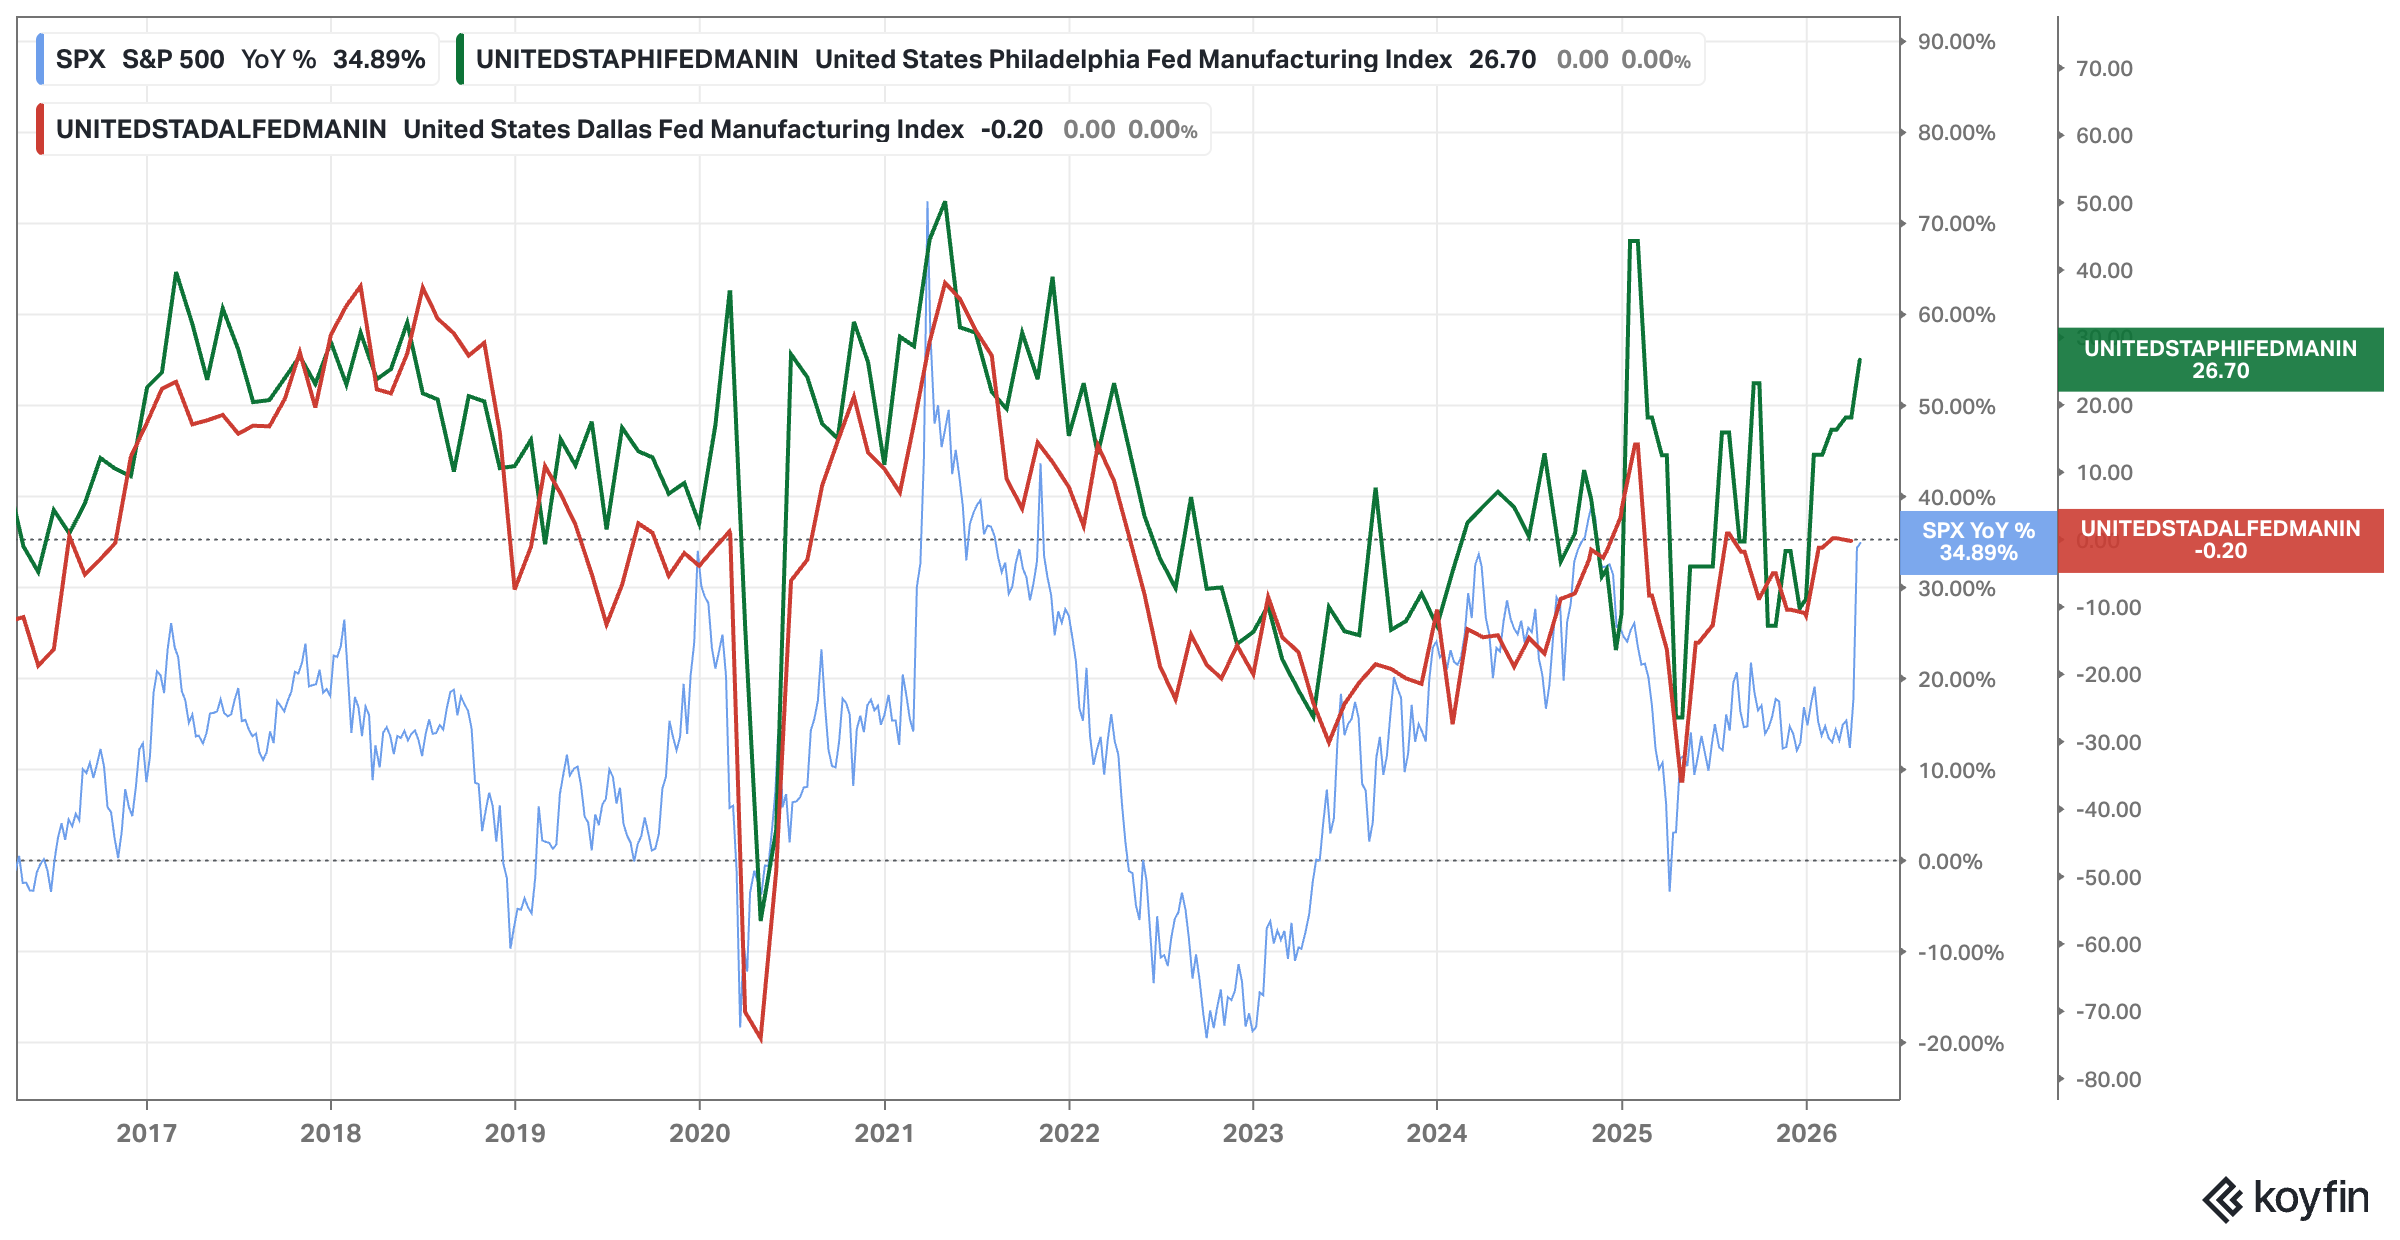
Analysis: Philadelphia manufacturing index increased.
Outlook: Bullish
Economic Data: Consumption: Consumer Sentiment
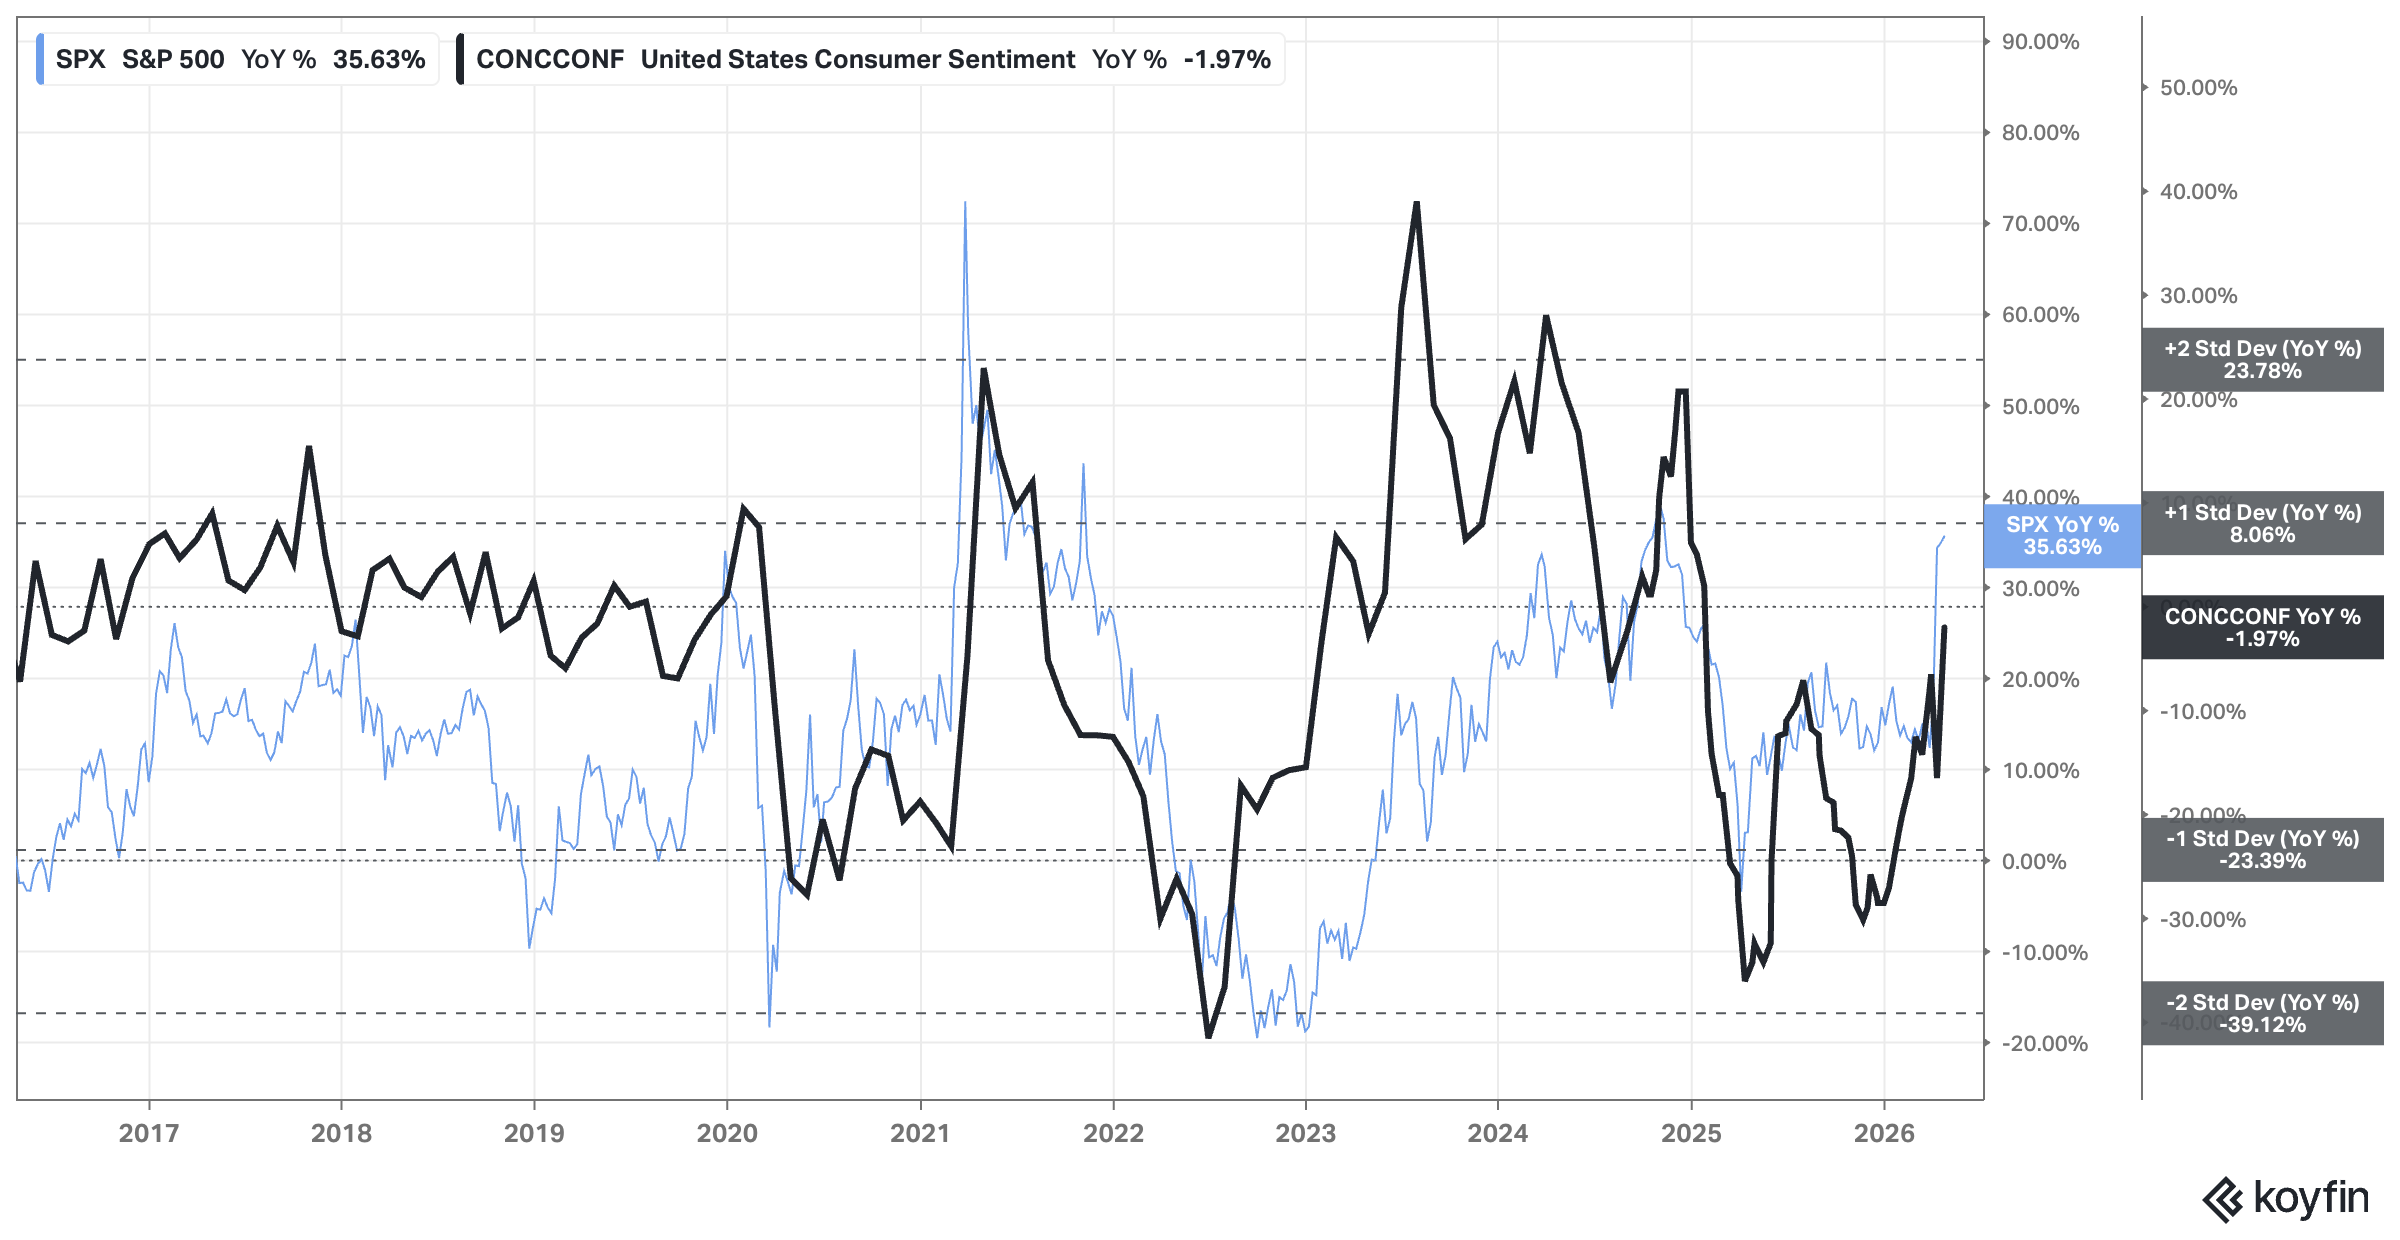
Analysis: The sentiment has recovered and improved above pre-Iran war levels. So, even the US consumer is saying… war? what war???
Outlook: Bullish
USD & Interest Rates: FED, 2yr, 10yr, and 30yr Rates
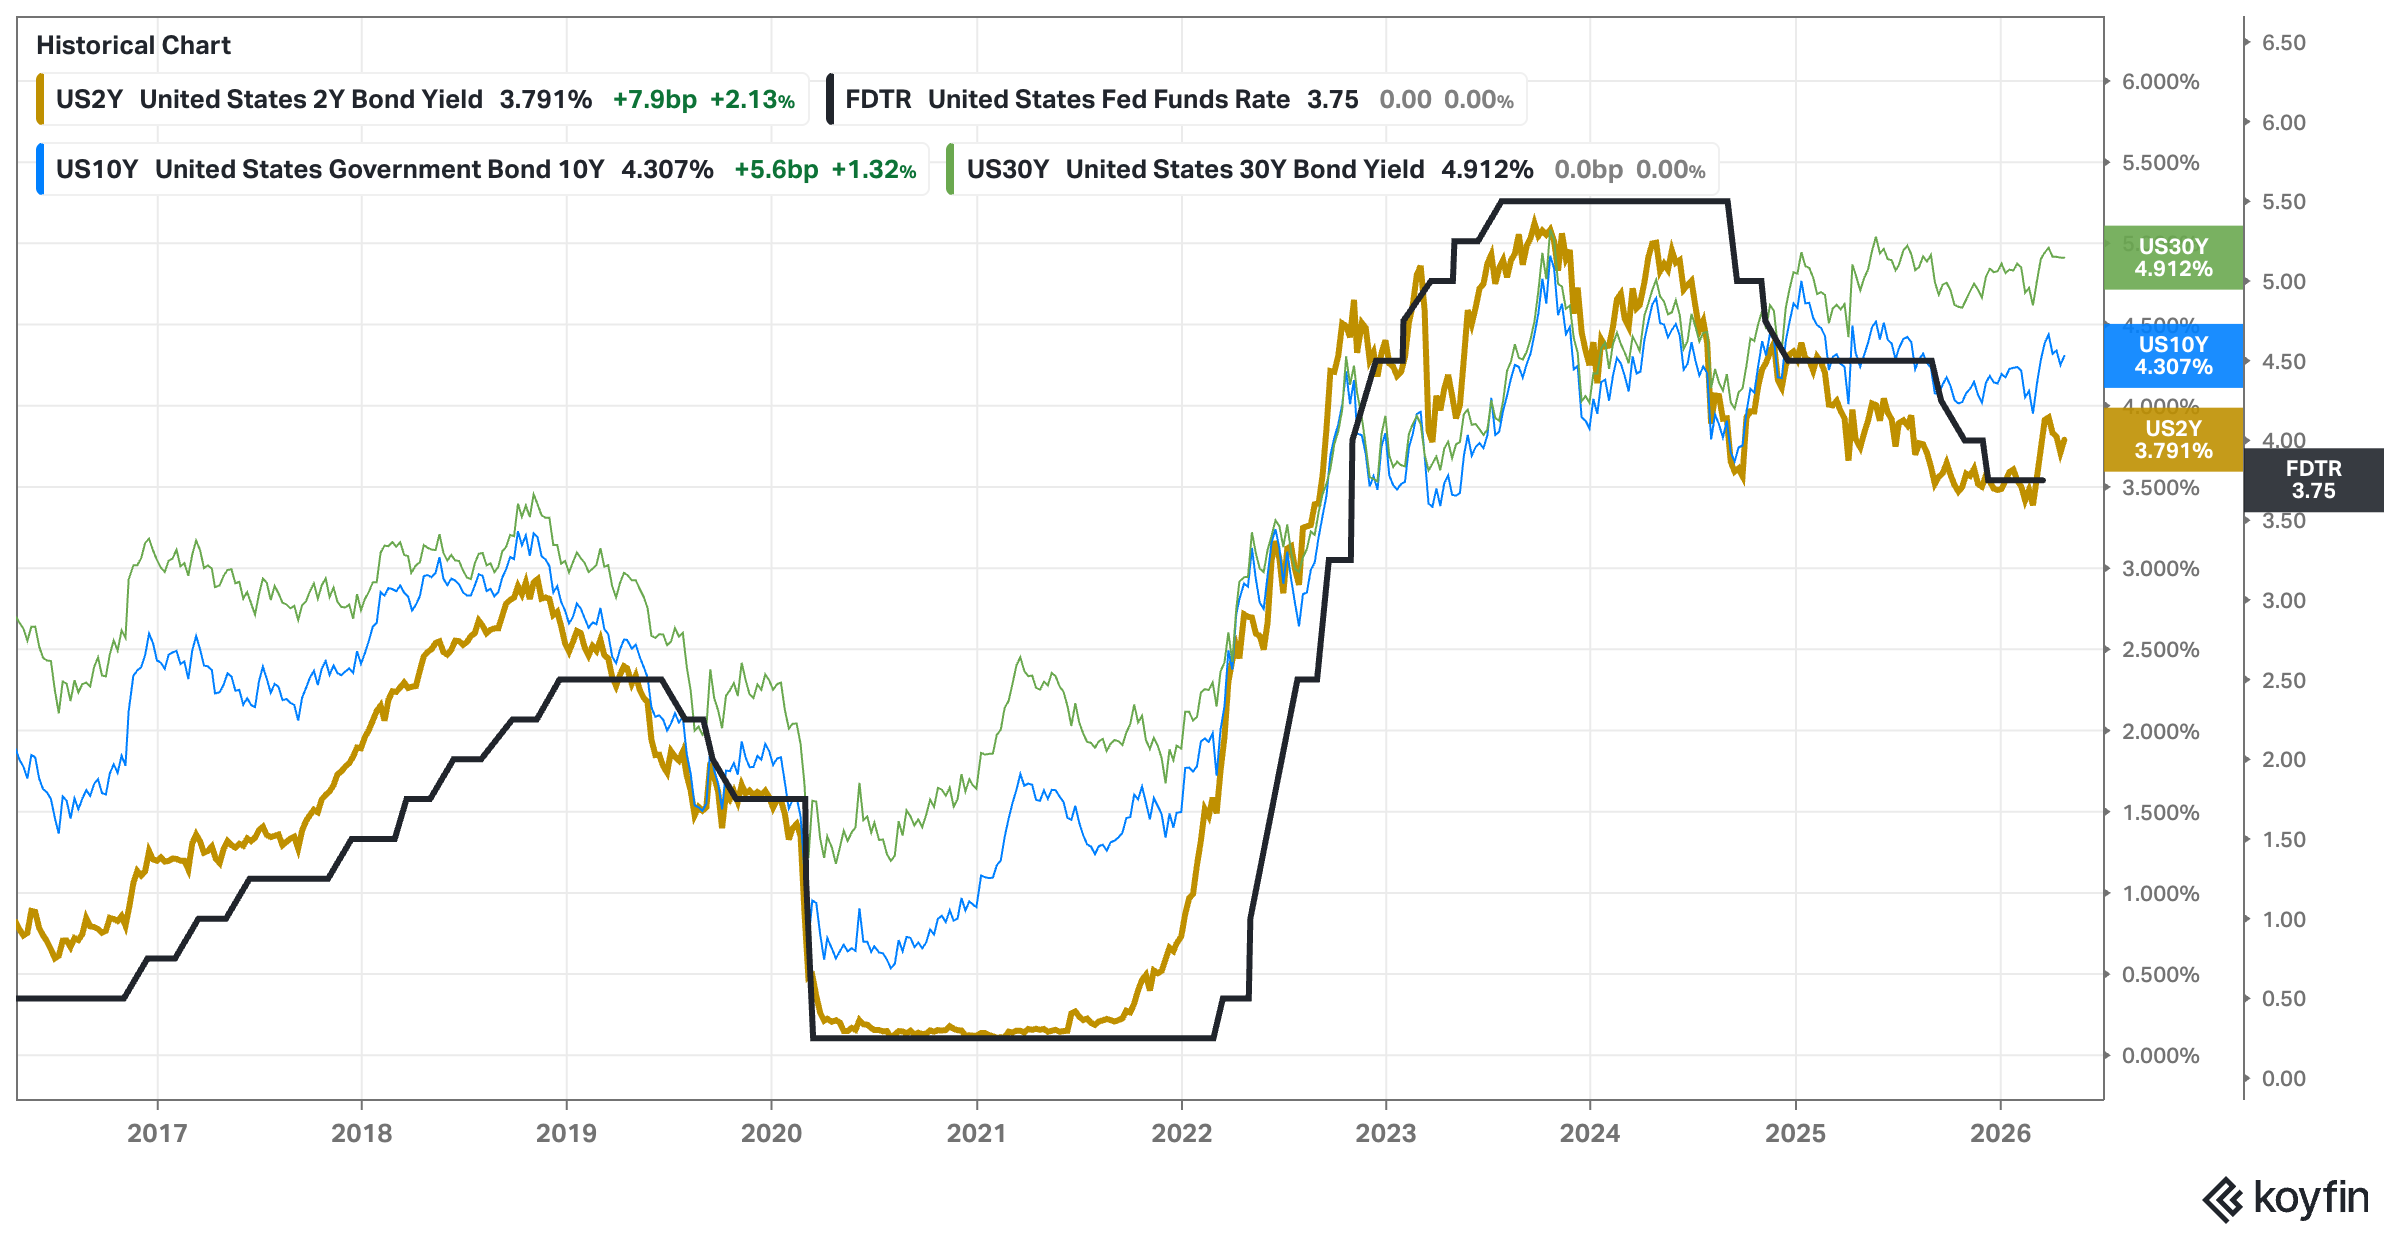
Analysis: This is the last piece in the puzzle and the most worrisome. Long-dated rates shall come down, for me to believe that everything is good and that the US economy is booming and so will do the markets.
On the other side, even with the Iran war, the oil shock, tariffs, etc. and the rates are below the highs of 2023. There is hope (never a good investment companion) that rates will come down, and when they do, they may come down fast.
Outlook: Neutral to Bearish.
USD & Interest Rates: USD vs EEM ILF and S&P500
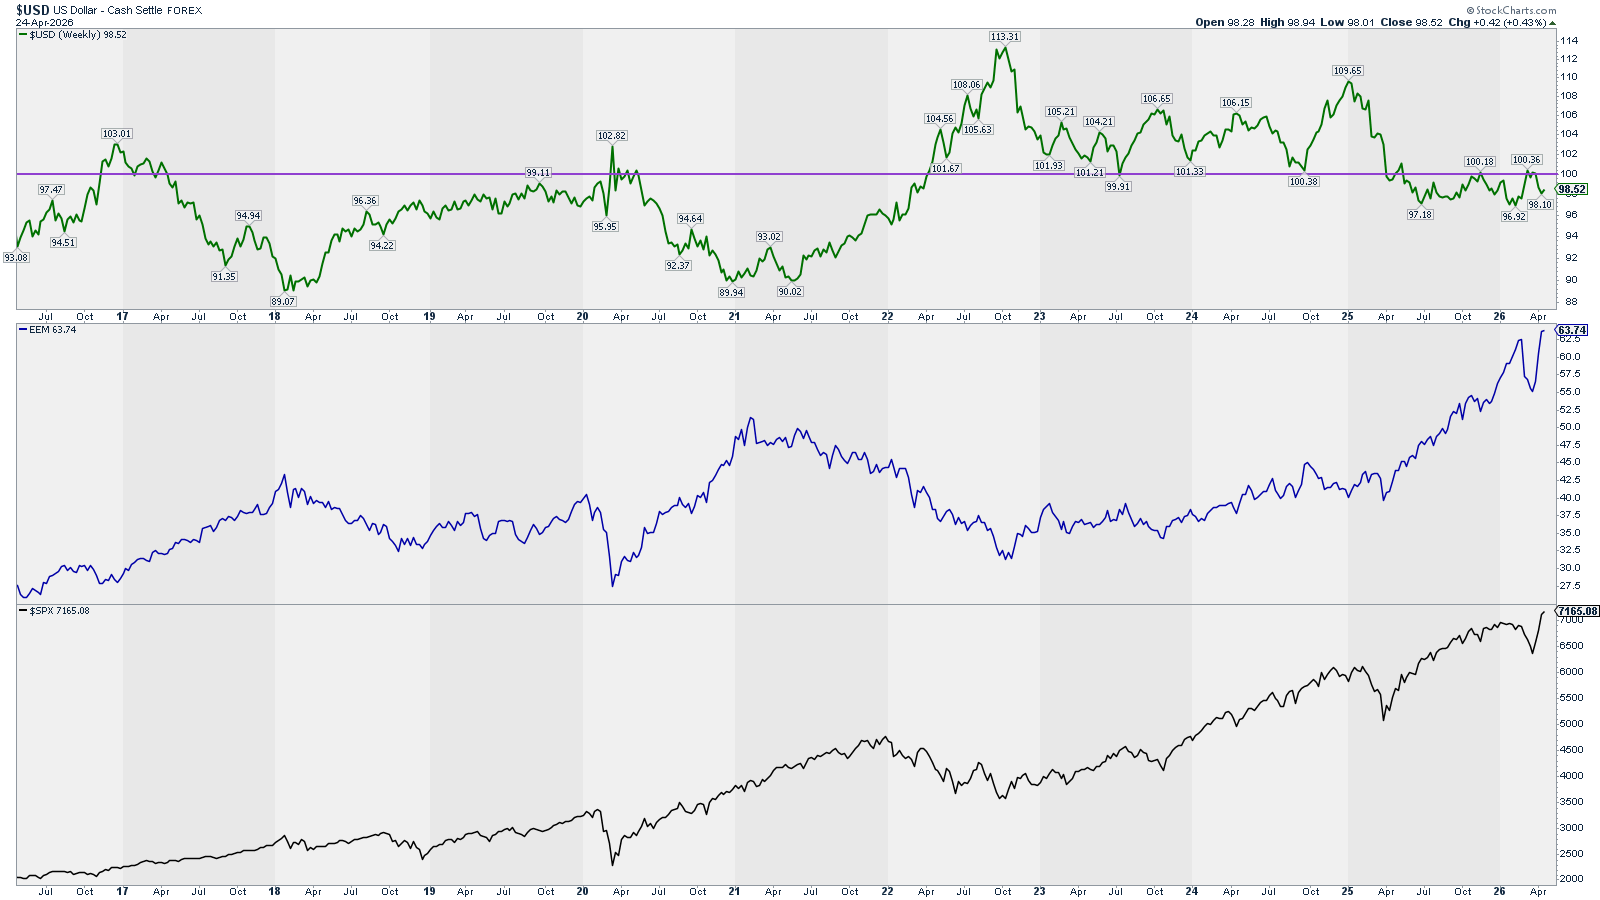
Analysis: We spoke before about the relationship between USD and EEM, and we can see it on the chart. Obviously, I did not come up with this idea. As I listen to investment Podcasts with experts that they sell their services online; I subscribed to some of this, expensive, services; and I read my fair amount of investment literature; somewhere in this pool of knowledge this USD-EEM correlation was mentioned. But today, I want to go a bit deeper and see what’s behind EEM, which are its constituents. Thanks to Finviz, here are the top 10 holdings:
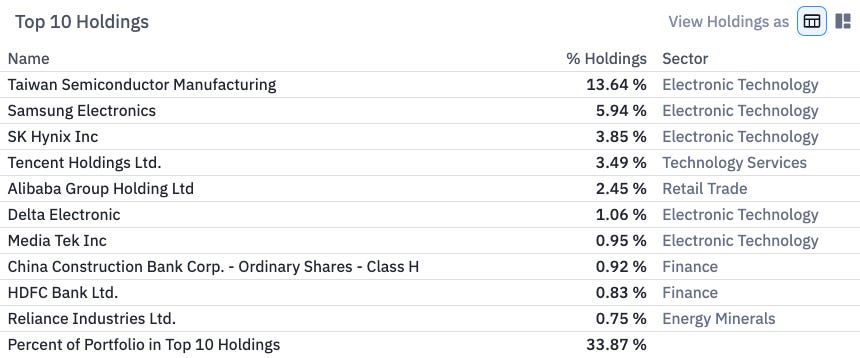
The top 3, with a combined 23% weight, are memory related companies. Those that are right now booming due to AI. The recent outperformance of EEM has nothing to do with a weakening USD. It is all about AI.
The theoretical relationship between a weaker USD is good for Emerging Markets because all those international purchases that are done in USD (i.e., oil) become cheaper is true. But the correlation with the EEM ETF is not true anymore. Maybe it was years ago, but not today.
I checked other ETFs in the EEM area: VWO, IEMG, EMXC, SCHE. They all have similar constituents, with heavy concentrations on China and Taiwan.
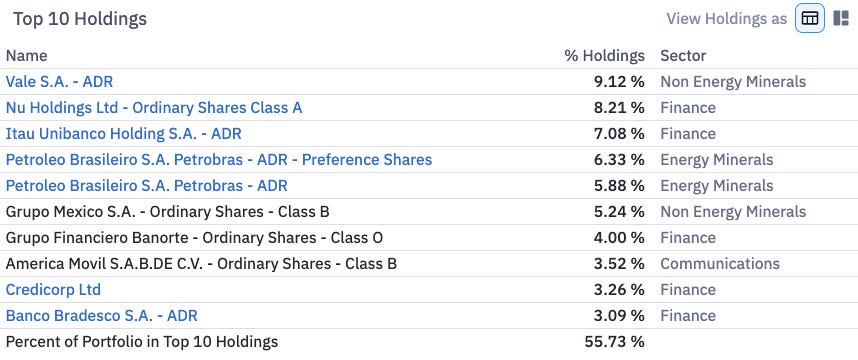
Then I checked the correlation of USD vs. Latin America using ILF:
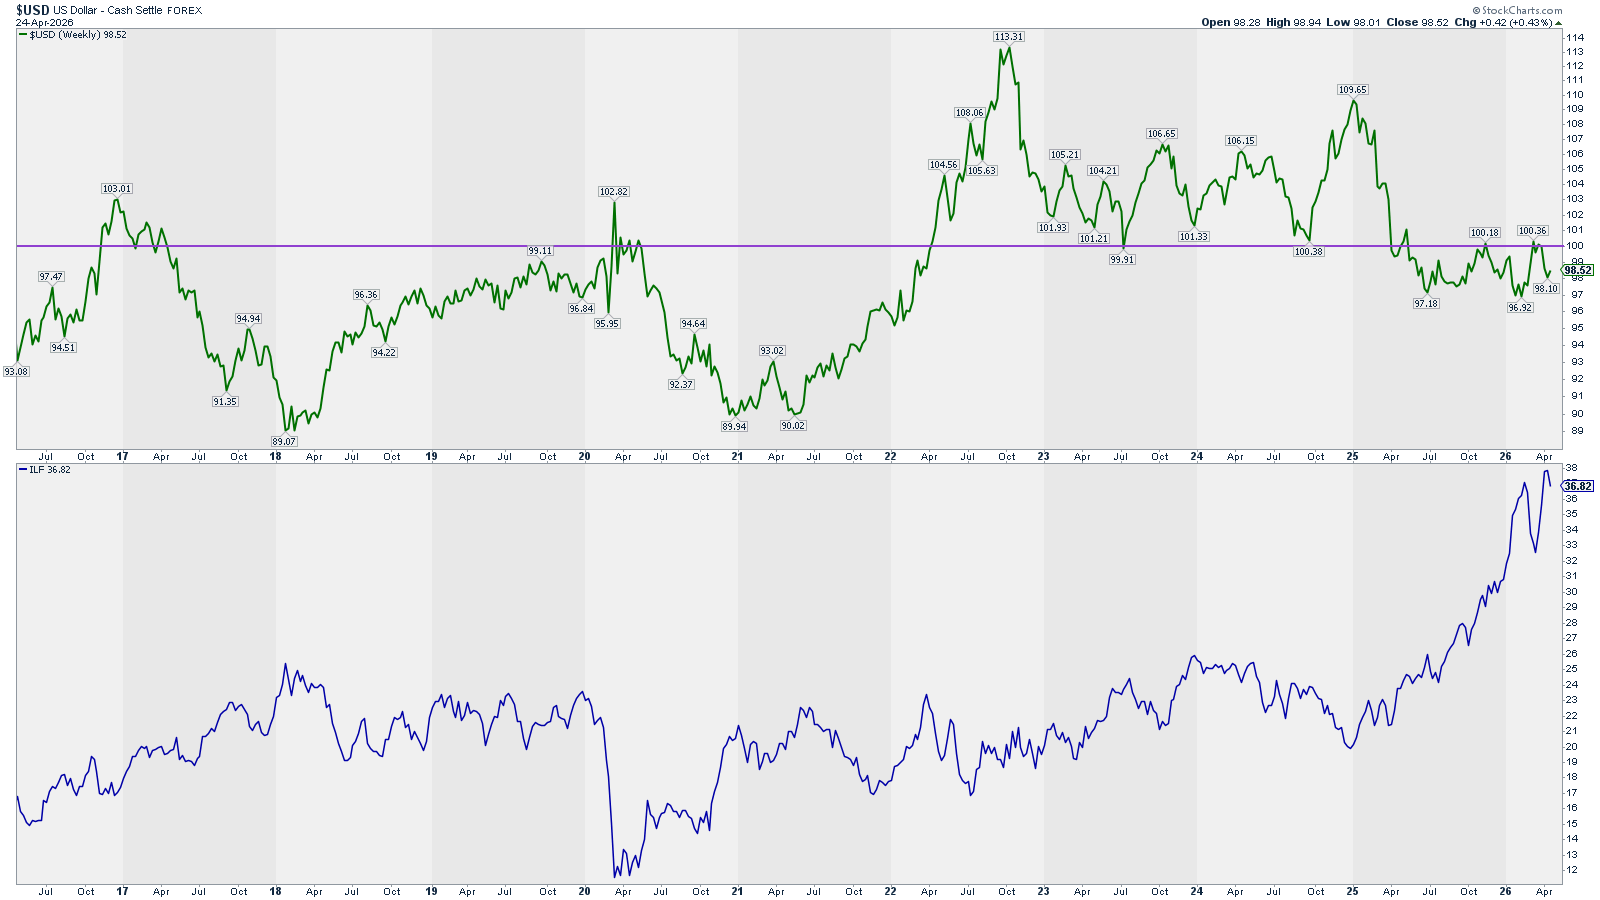
And here you can see a better correlation. Looking at ILF constituents, we see a better balanced portfolio between Minerals, Finance, and Energy.
As a result, I’m updating the chart to replace EEM by ILF as it makes more sense to consider emerging markets with growth potential Latin American rather than South Korea, China, and Taiwan (which are not emerging markets):
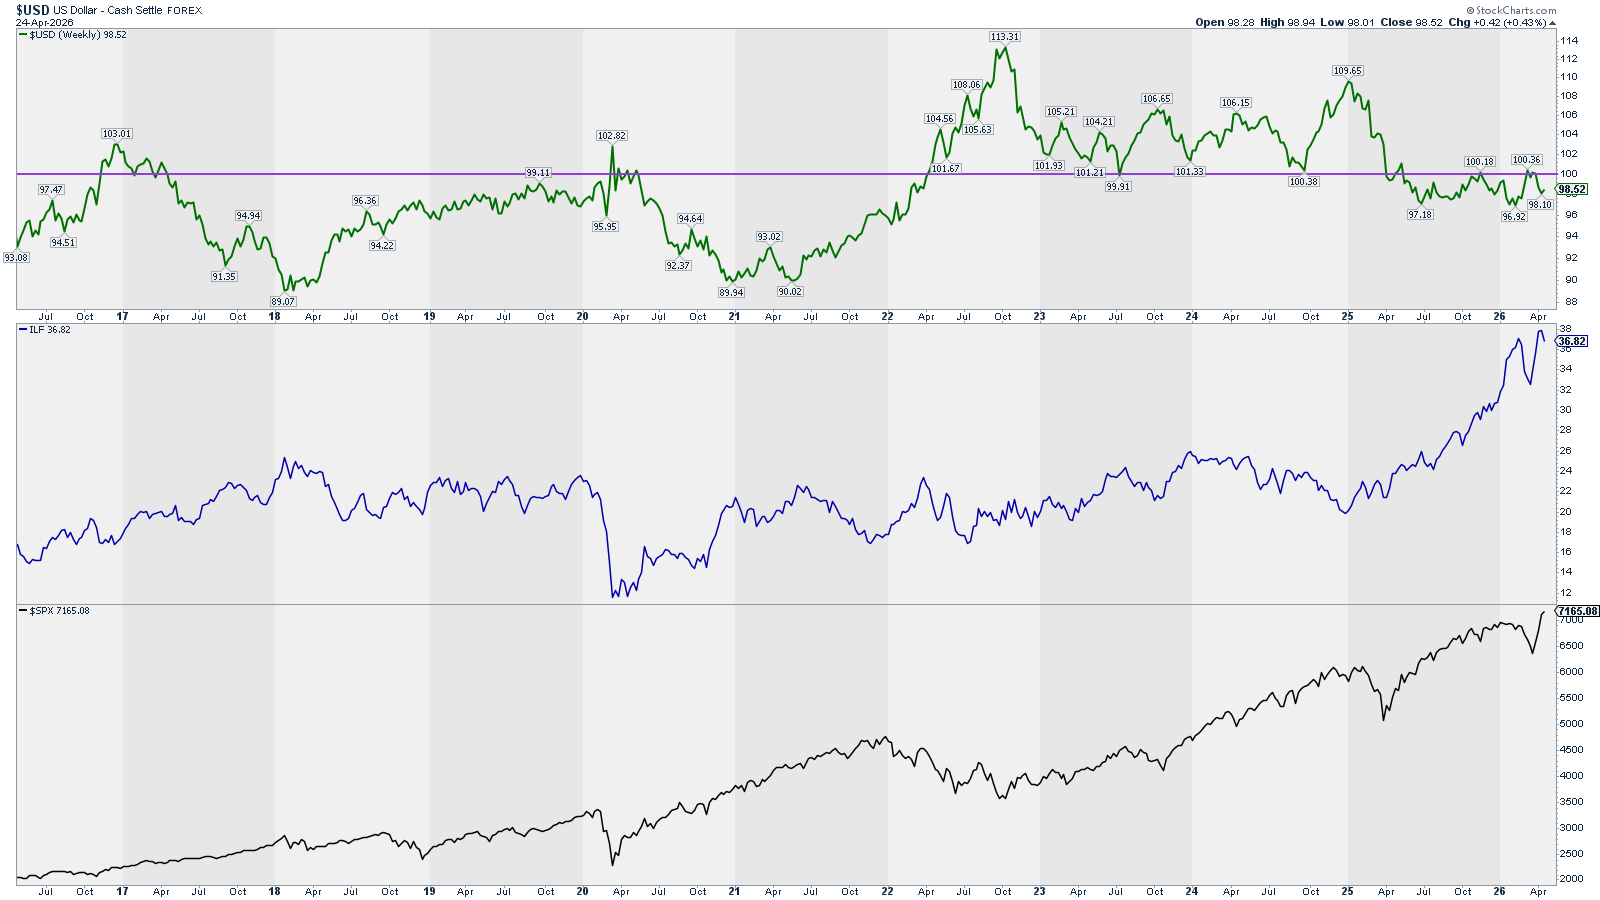
Outlook: Neutral (the longer the war the higher the oil & gas disruption)
Context Investors Sentiment: Credit Spreads
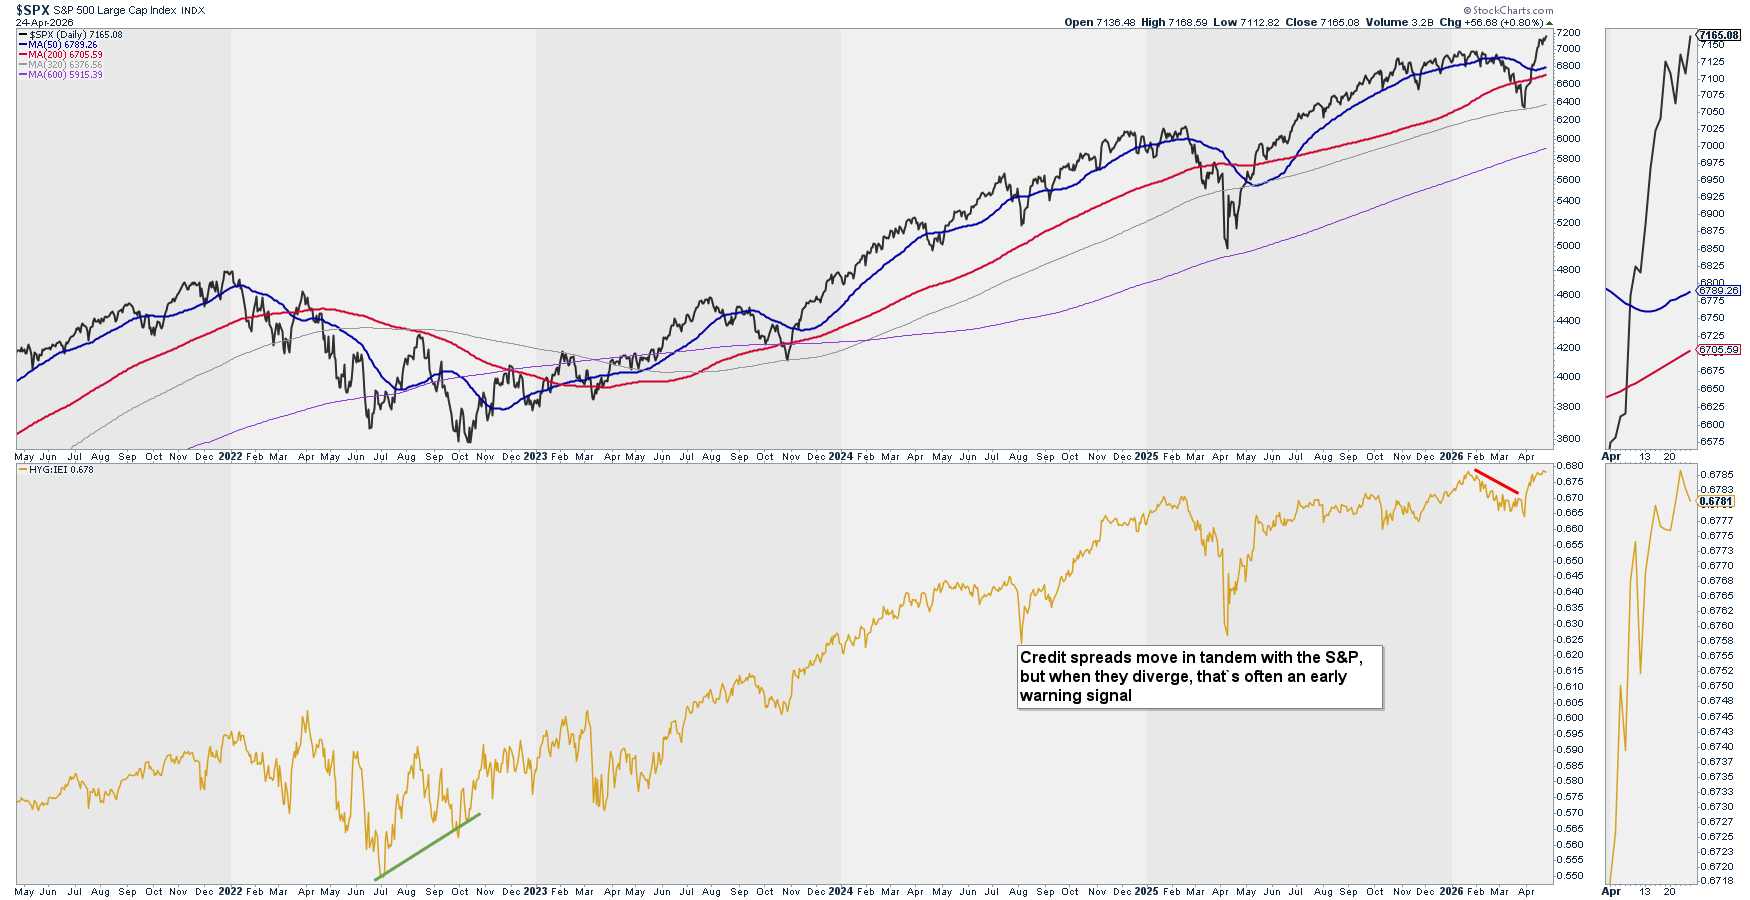
Credit spreads move in tandem with the S&P, but when they diverge, that’s often an early warning signal.
Analysis: Flat-ish movement in Credit Spreads, which correlates with the idea that the market is over extended and needs a bit of a pause. Yet the outlook remains bullish.
Outlook: Bullish
Level 1: Why is it happening? Summary
Economic Data (long-term): Bullish
USD & Interest Rates: Neutral
Investors Sentiment: Bullish
What is happening? – Level 2
Price Action: SPX – Long Trend – 20 & 10 years
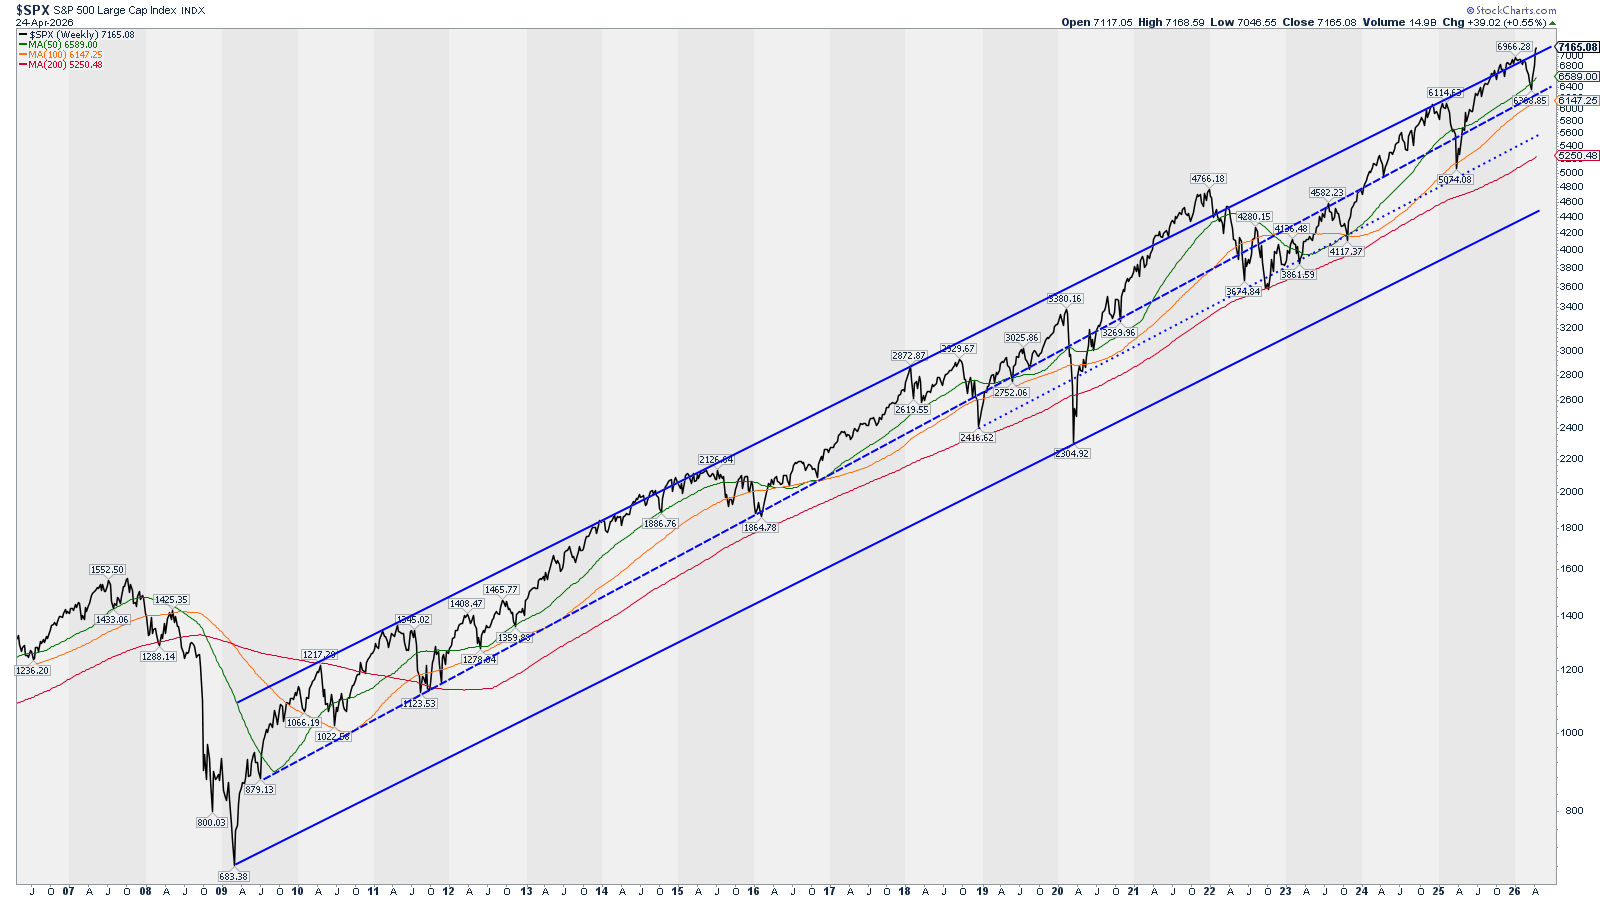
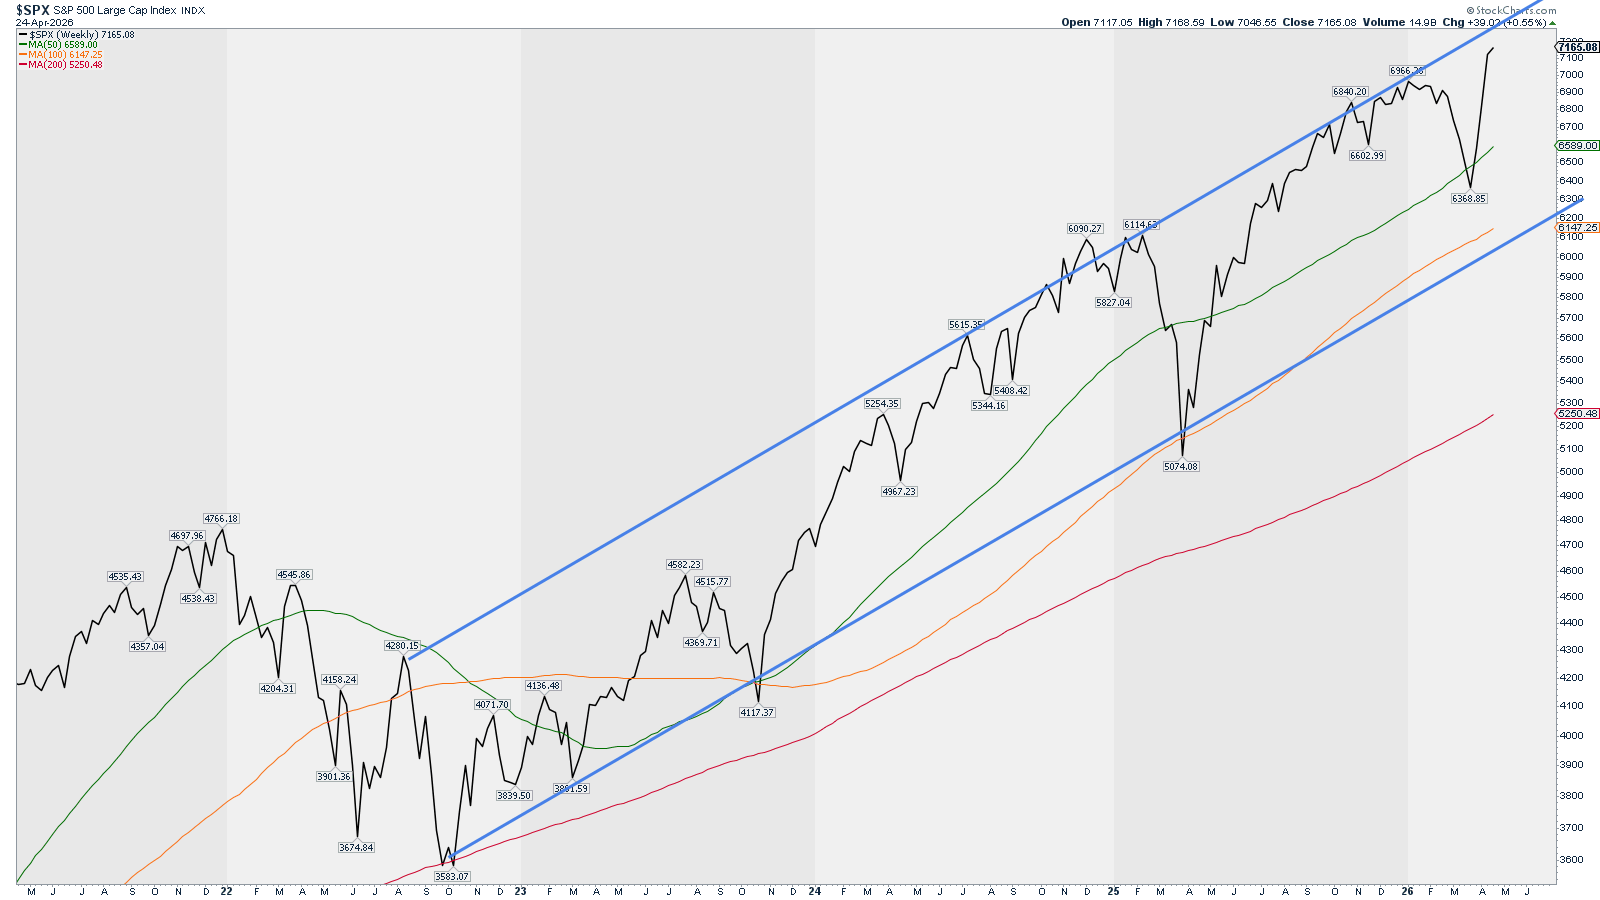
Analysis: 20 years channel has been broken on the upper side, signalling an overbought market. On the 10 years channel there is still a bit of room on the upper side. Despite being in a bull move, the outlook cannot be too bullish due to this overbought conditions.
Outlook: Neutral
Price Action: RSP – Trend – Weekly
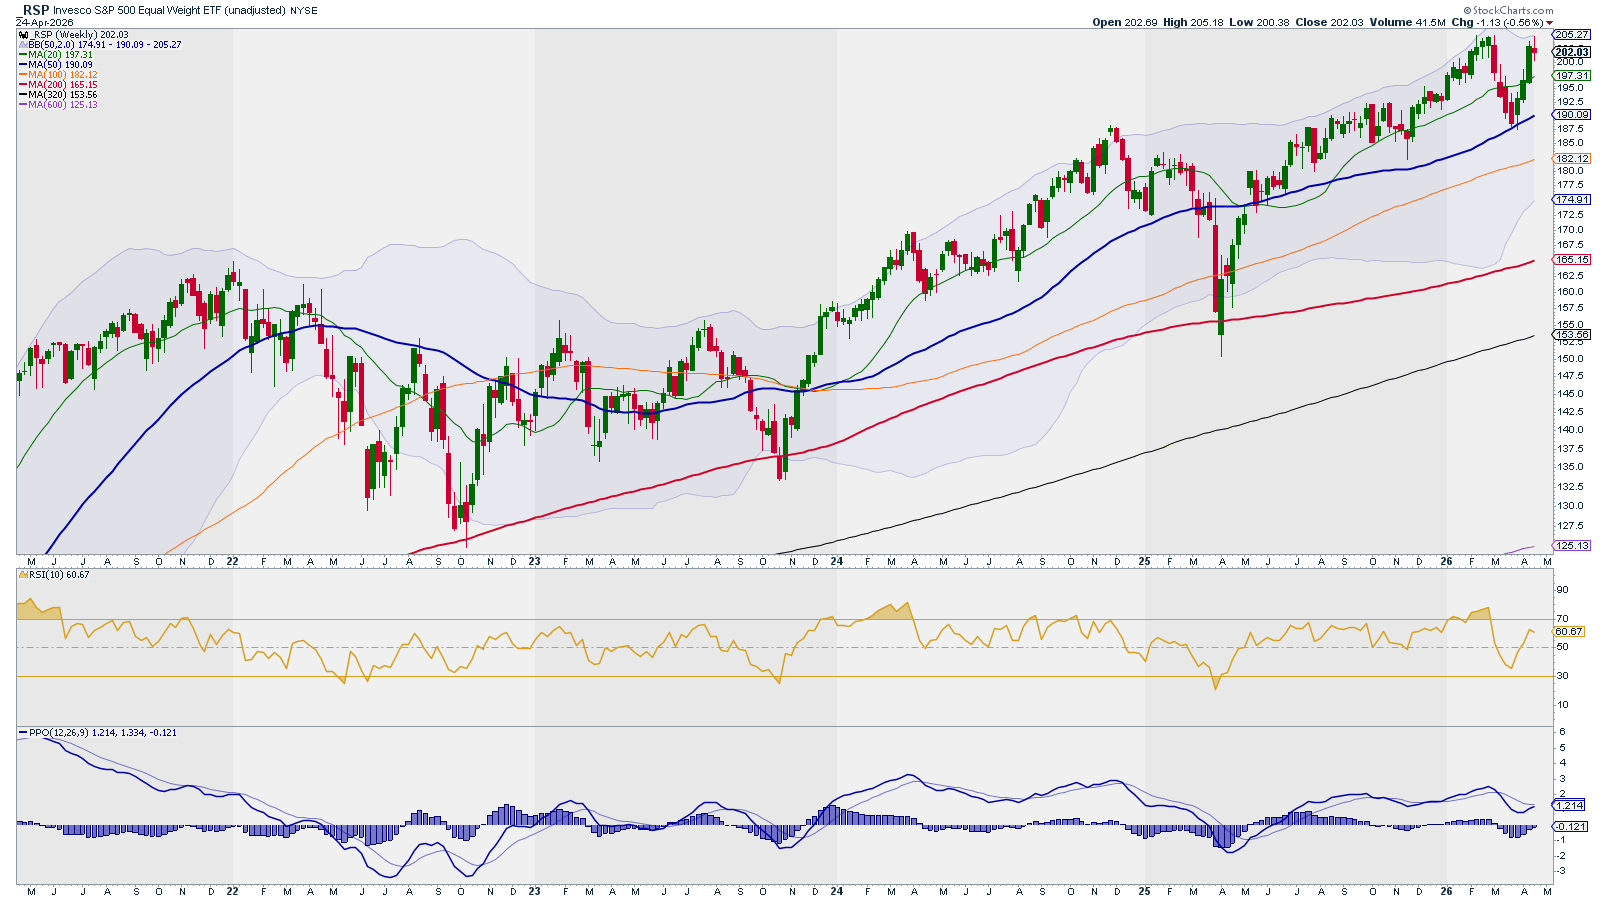
Analysis: We are getting closer to the upper BB band, which shall bring some resistance to the market. RSI is bullish and PPO is about to make a bullish cross.
Outlook: Neutral
Price Action: RSP – Trend – Daily
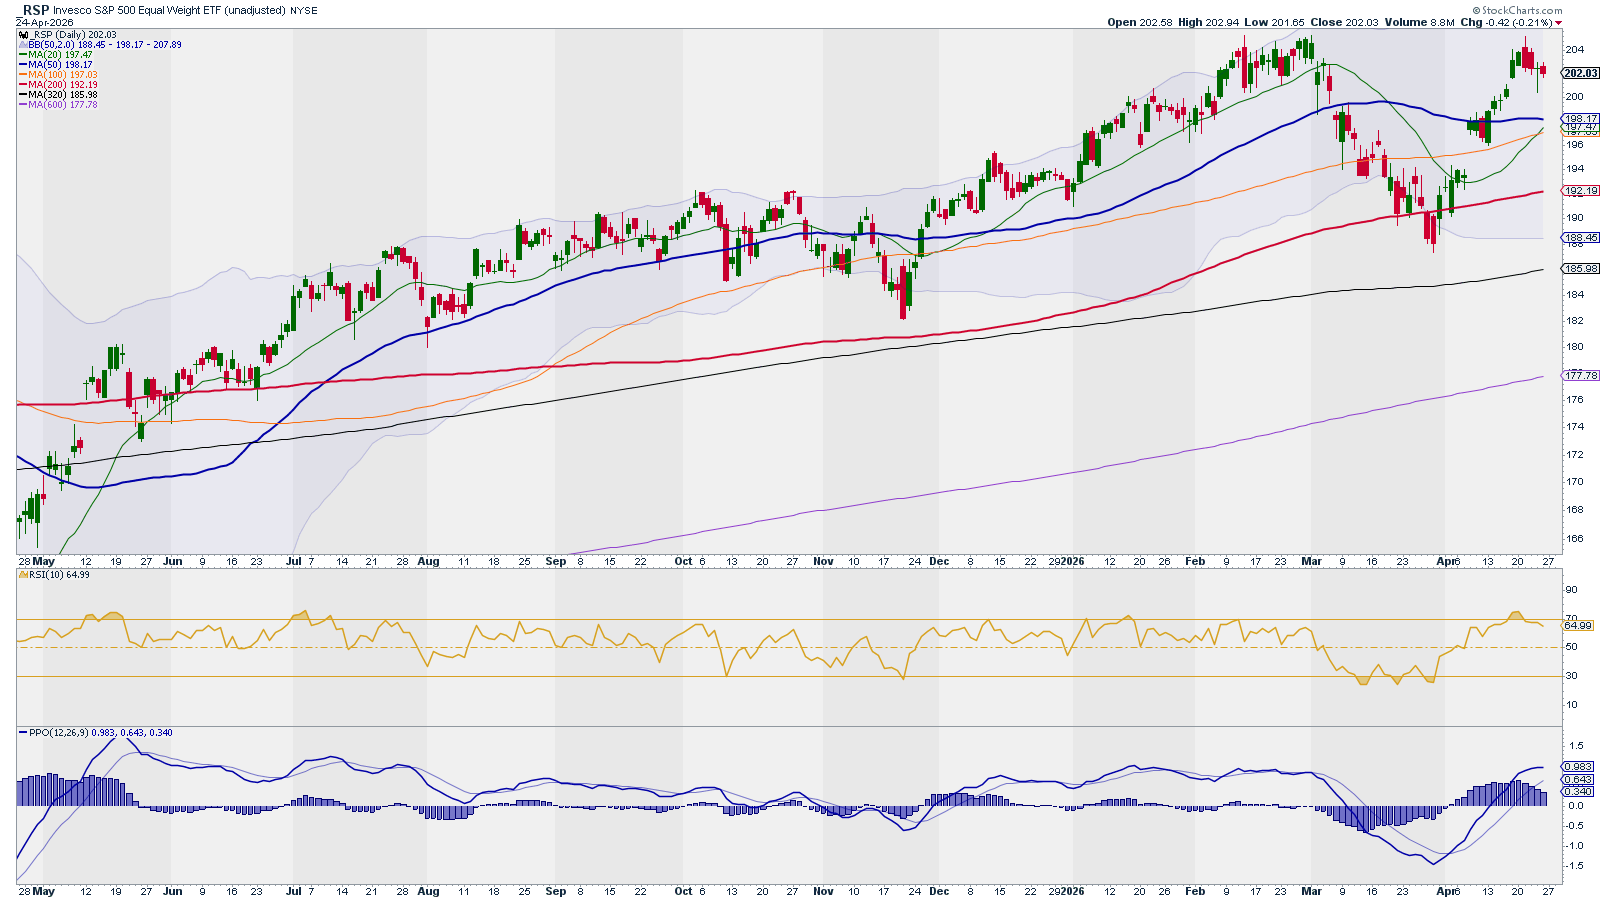
Analysis: RSI retracing from overbought territory and price facing some resistance or better a lack of support. We would prefer seeing the 20D SMA getting closer to the price to provide support. I’m downgrading the outlook from Bullish to Neutral.
Outlook: Neutral
Breadth & Volatility: % Stocks above 200 SMA vs. RSP
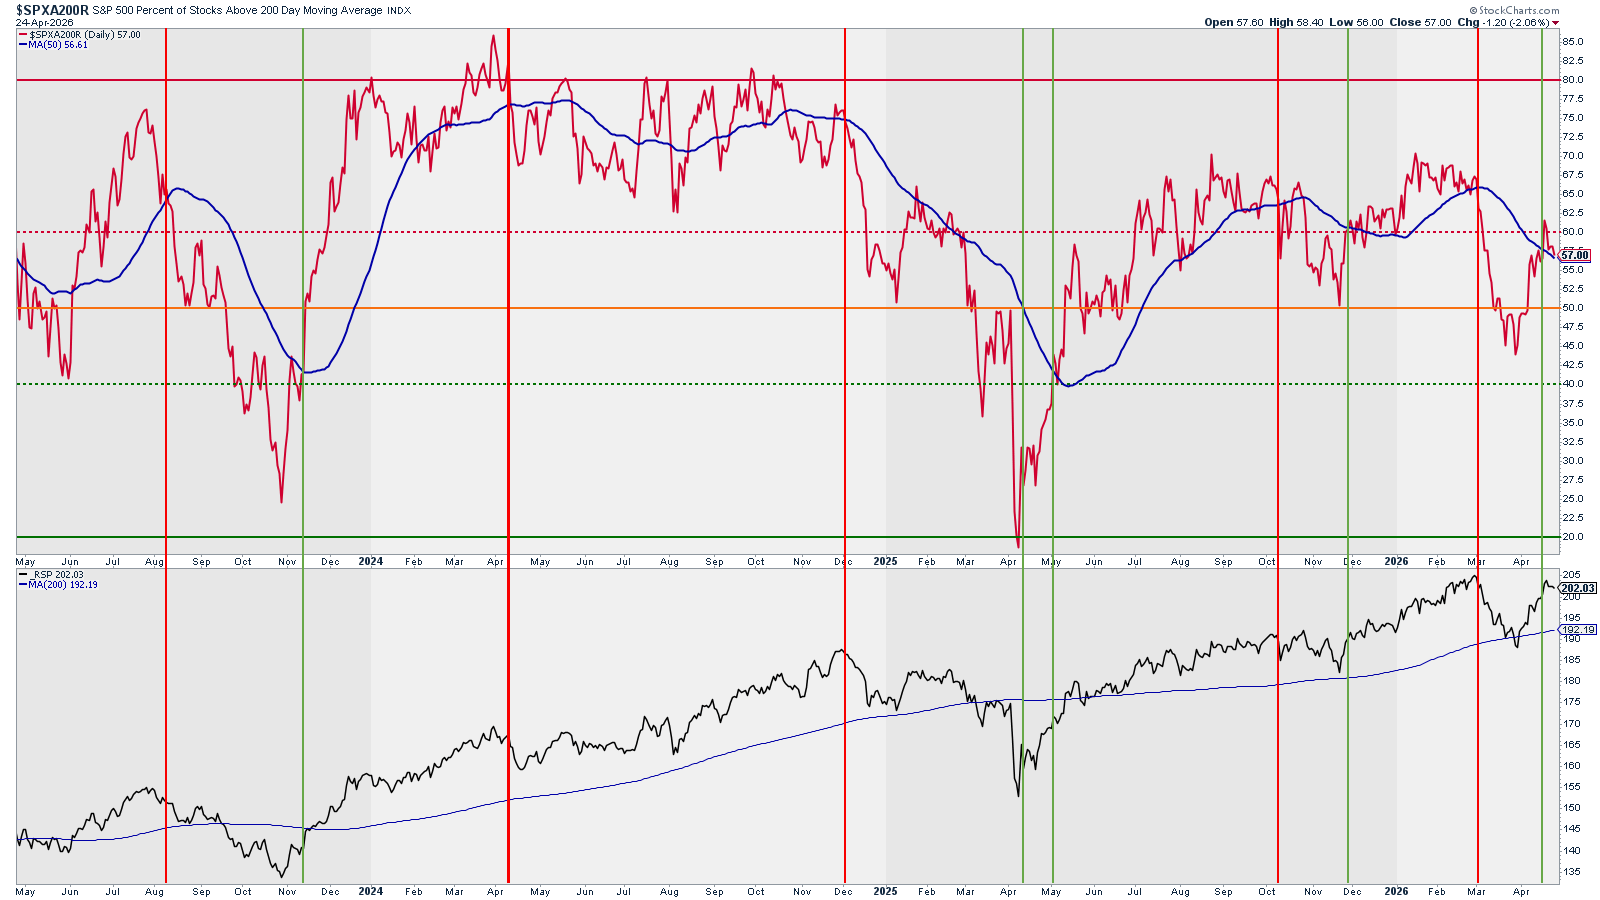
Analysis: Important retracement in breadth. We are very close to trigger the bearish signal. I’m downgrading the outlook from Bullish to Neutral
Outlook: Neutral
Breadth & Volatility: RSP and % Stocks above 200, 50, and 20 SMA
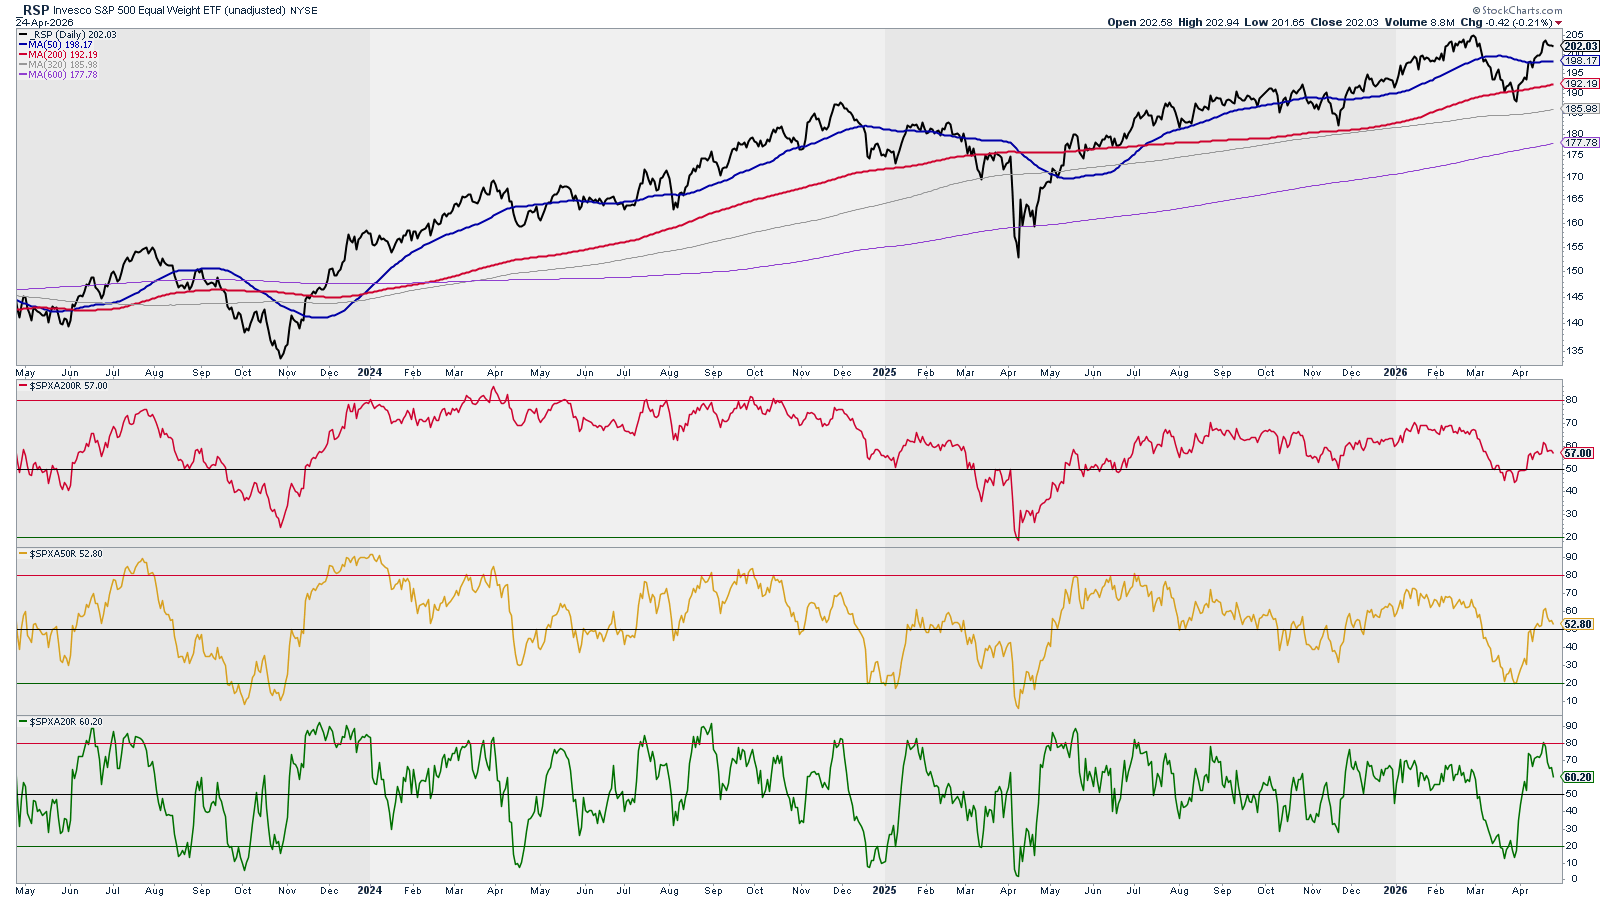
Analysis: 20D confirms that in the near-term, the bullish momentum may face some resistance. 50D SMAs shows that there is still room for more bullish action. The outlook gets downgraded from Bullish to Neutral
Outlook: Neutral
Breadth & Volatility: Bullish Pct. Index & McClellan Summation Index
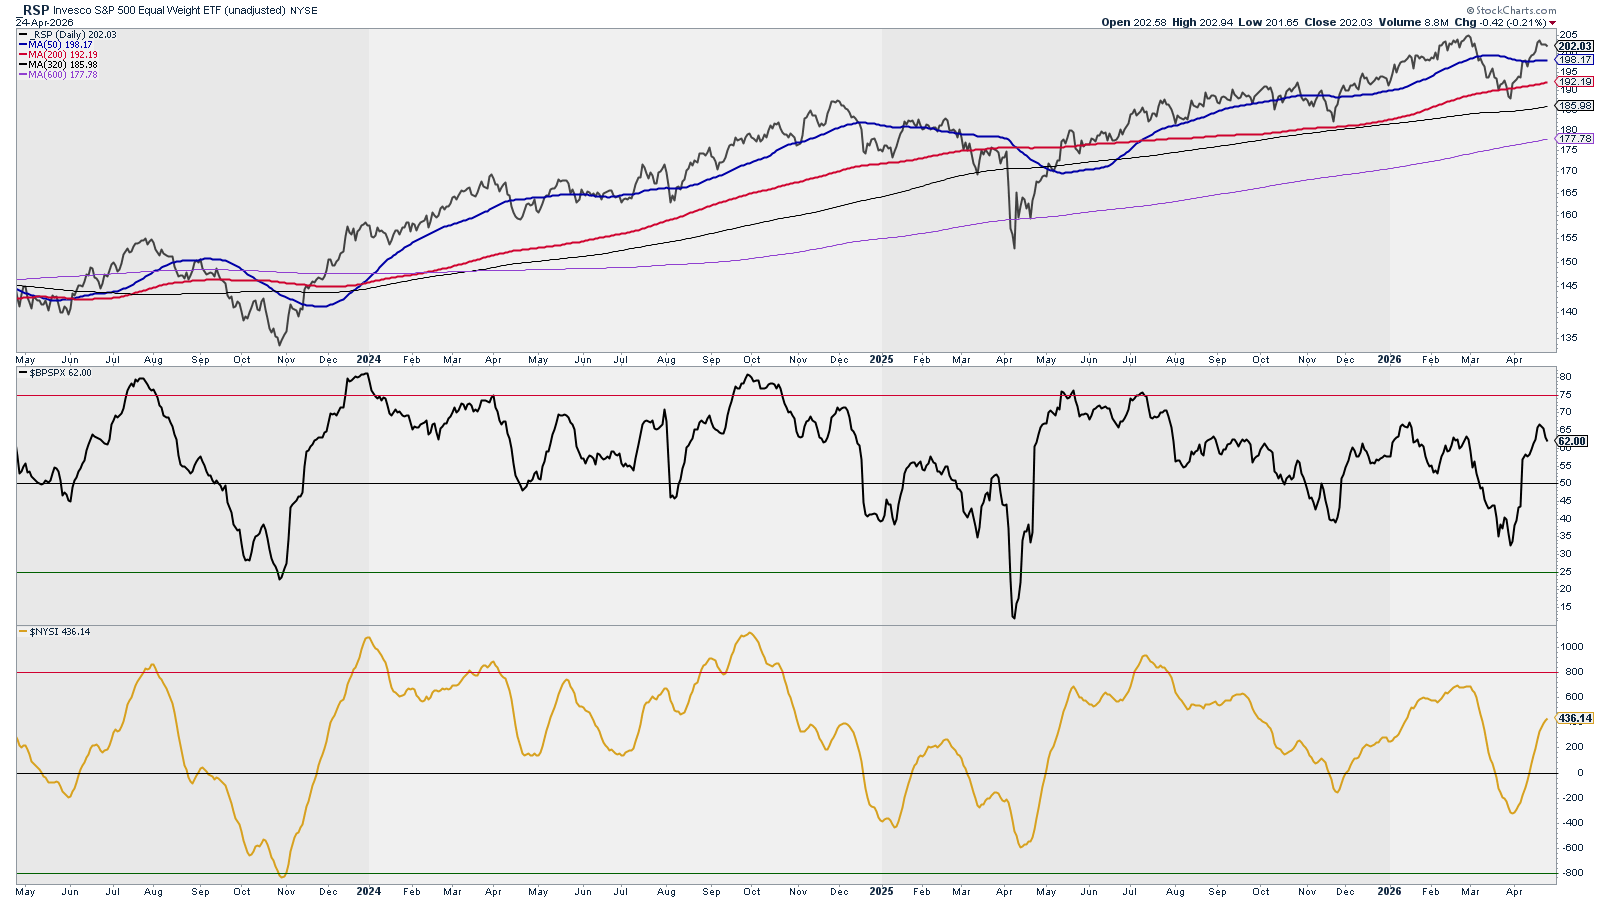
Analysis: No changes since last week. Both signals in synch with market action and far away from any overbought or oversold area.
Outlook: Bullish
Breadth & Volatility: Ratio Low Volatility Stocks / SPY vs. SPY and RSP
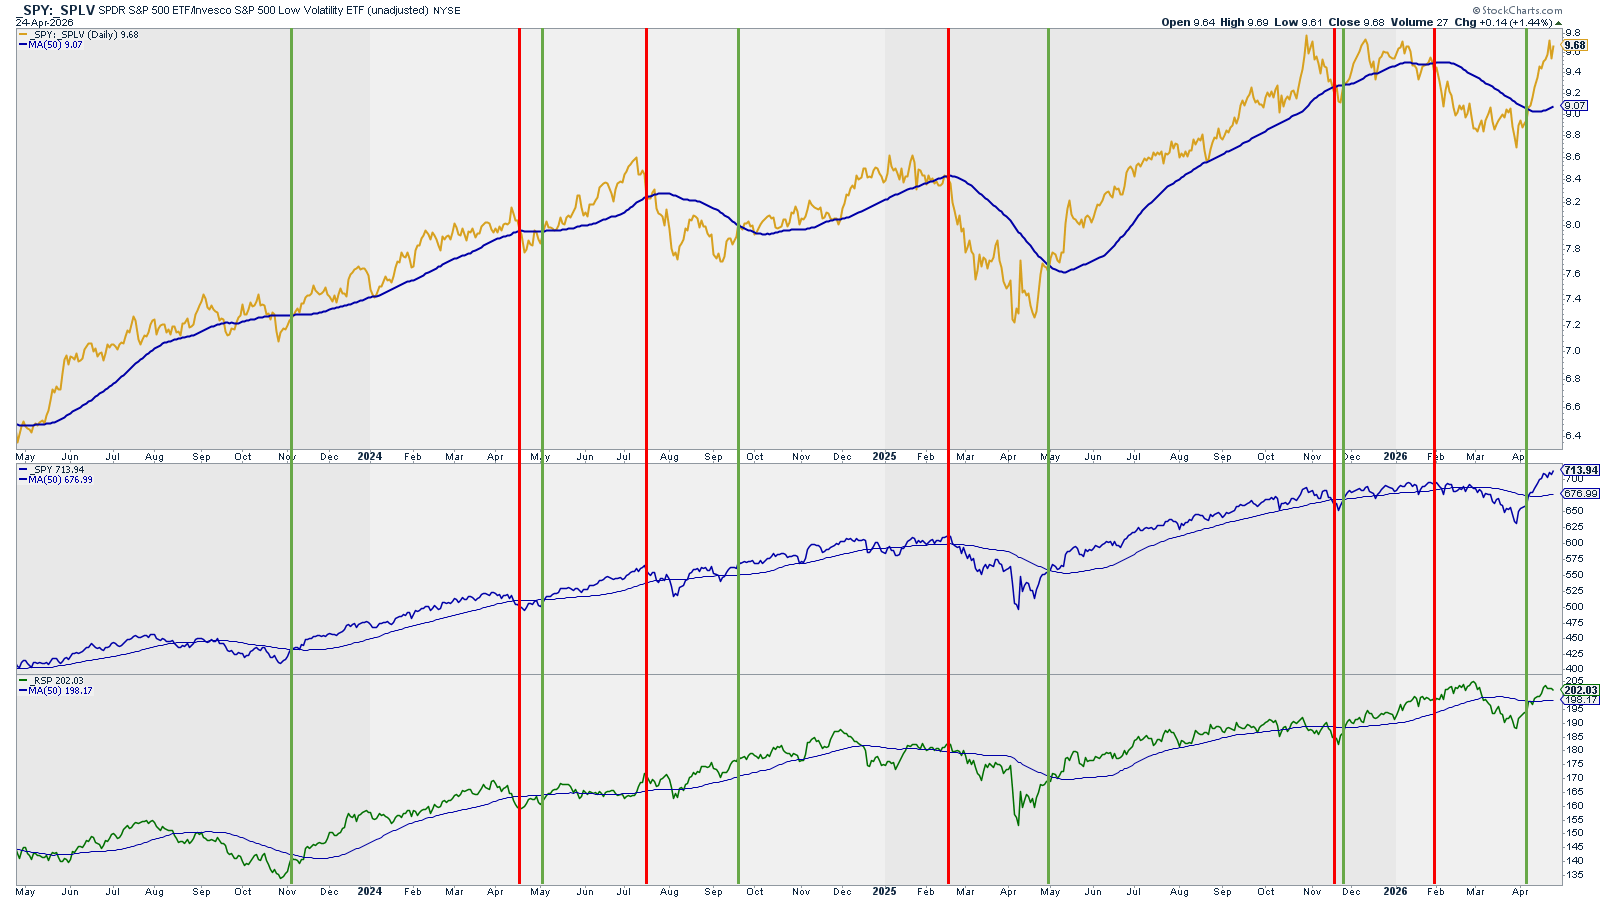
Analysis: No changes since last week.
Outlook: Bullish
Breadth & Volatility: New Highs vs. SPY & RSP
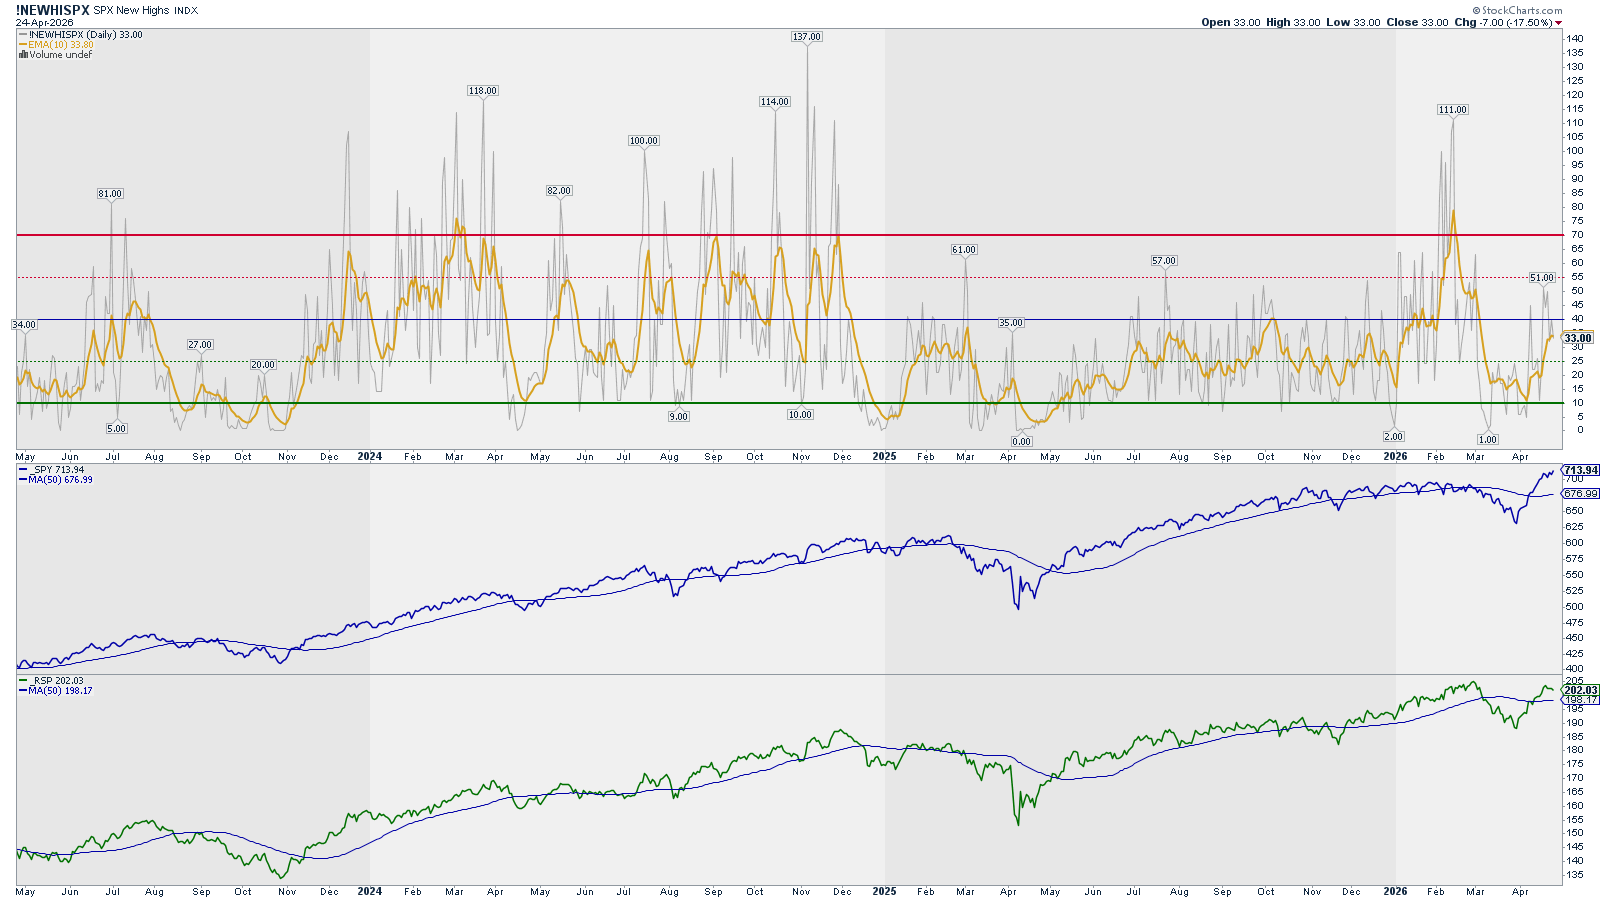
Analysis: No signs of extreme new highs/lows. As we are coming from a lower level, I maintain the Bullish outlook.
Outlook: Bullish
Breadth & Volatility: VIX vs. SPY & RSP
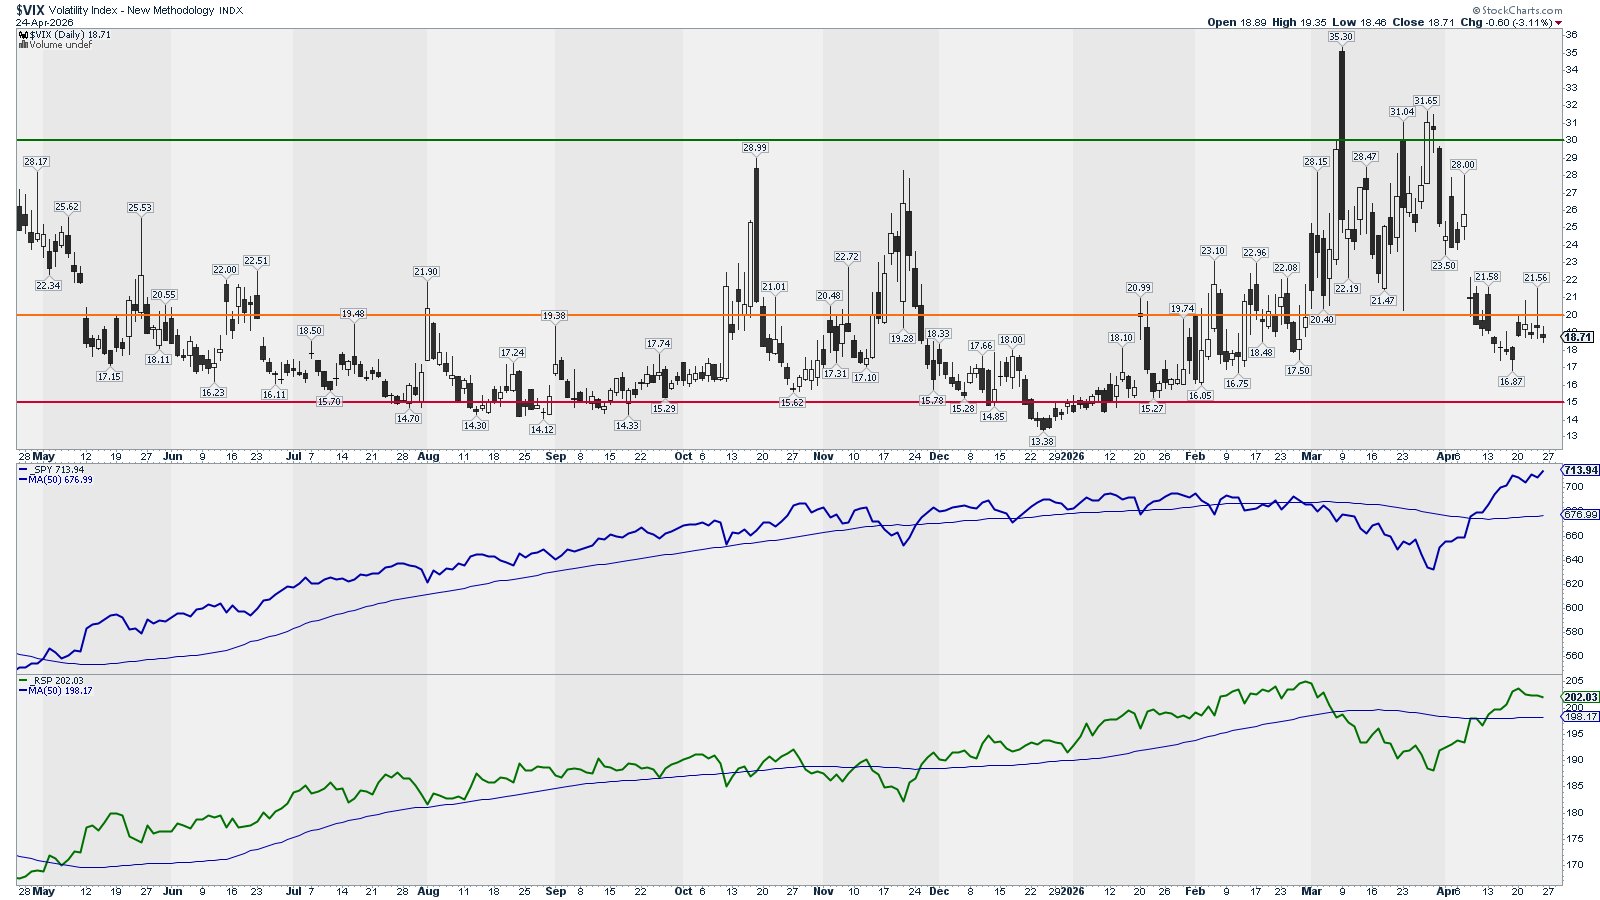
This chart is mainly to detect market bottoms.
Analysis: The trend has changed. The volatility has dropped below 20. This normally is good for the market.
Outlook: Expect normal volatility
Options: (Inverted) Put/Call Ratio vs. SPY
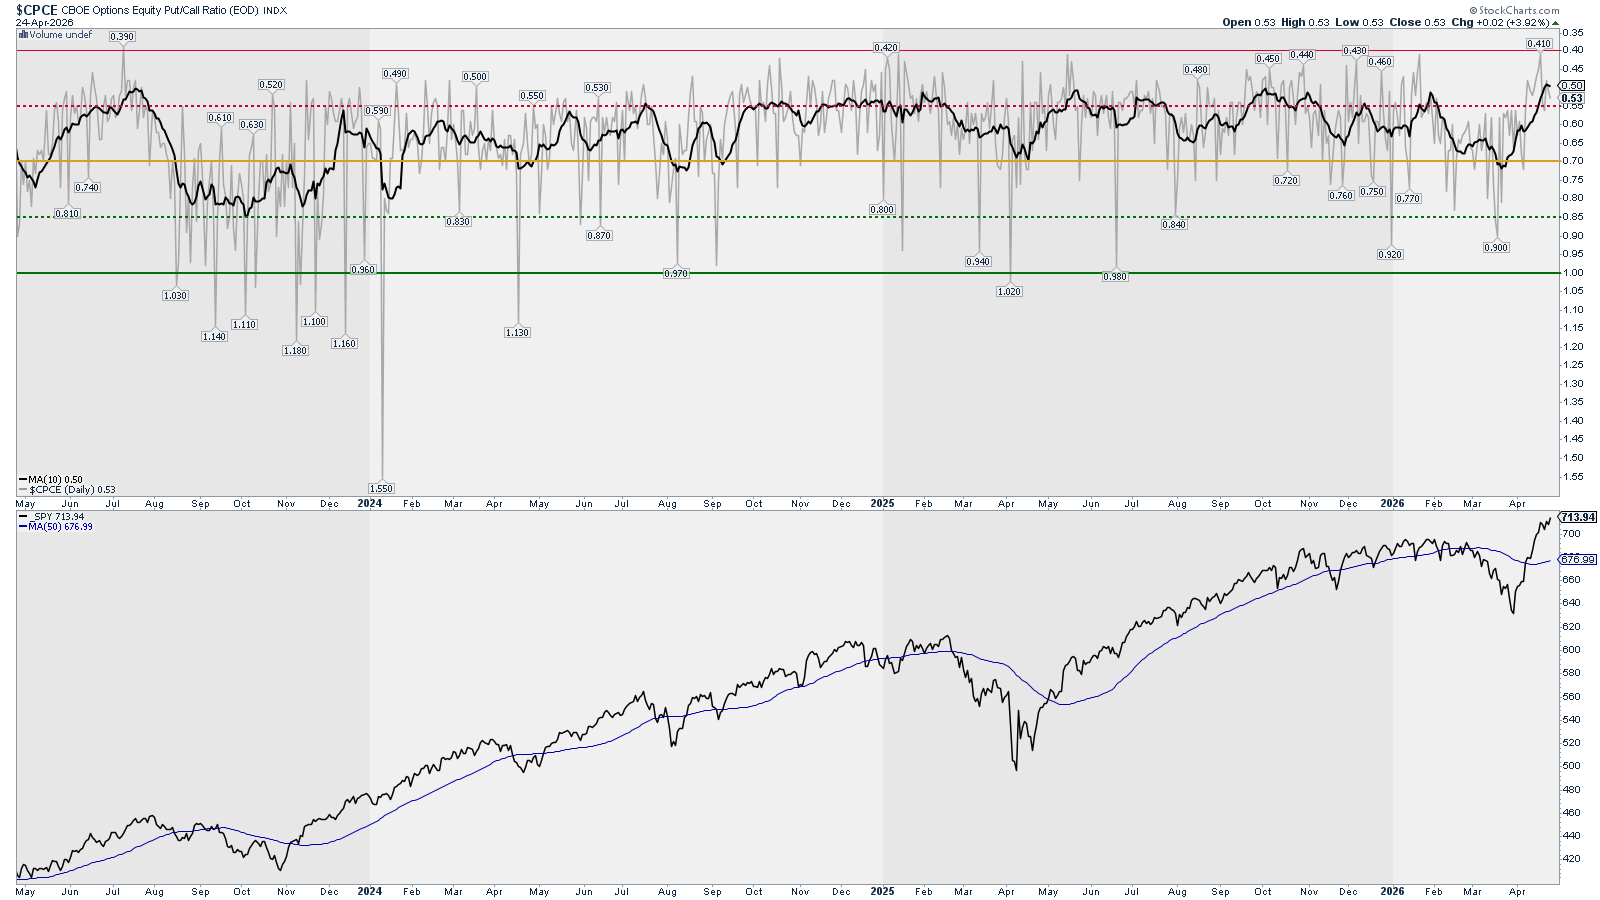
Analysis: A extreme read on daily P/C ratio (grey) may signal a short-term top. I’m downgrading the outlook to Bearish.
Outlook: Bearish
Options: Gamma Exposure – SPX
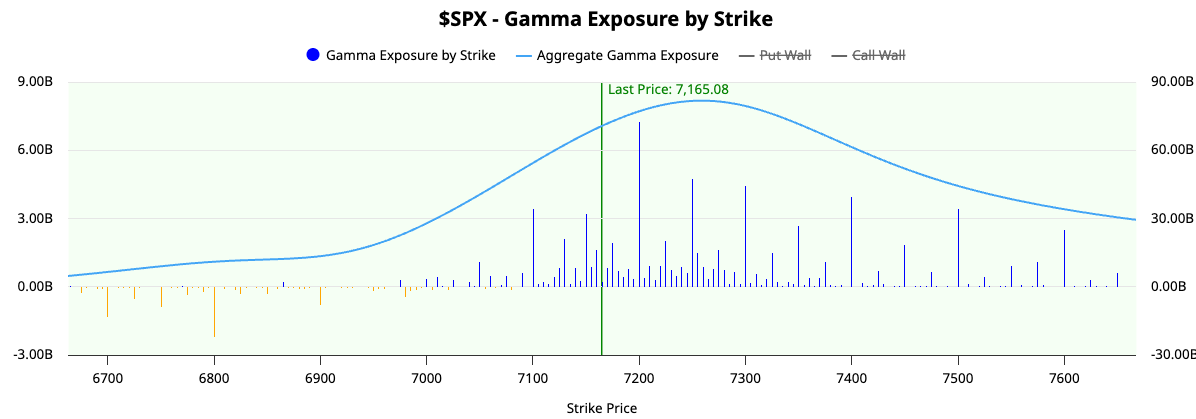
Analysis: Very positive Gamma with key level at 7,100 and 7,200. The Gamma tail is positive.
Outlook: Bullish
Level 2: What is happening? Summary
Price Action: Neutral
Breadth & Volatility: Neutral
Options: Neutral to Bearish
Where is it happening? – Level 3
Bulls vs. Bears: RSP vs. RSPD (Cons. Disc. – Bulls) and RSPS (Cons. Sta. – Bears)
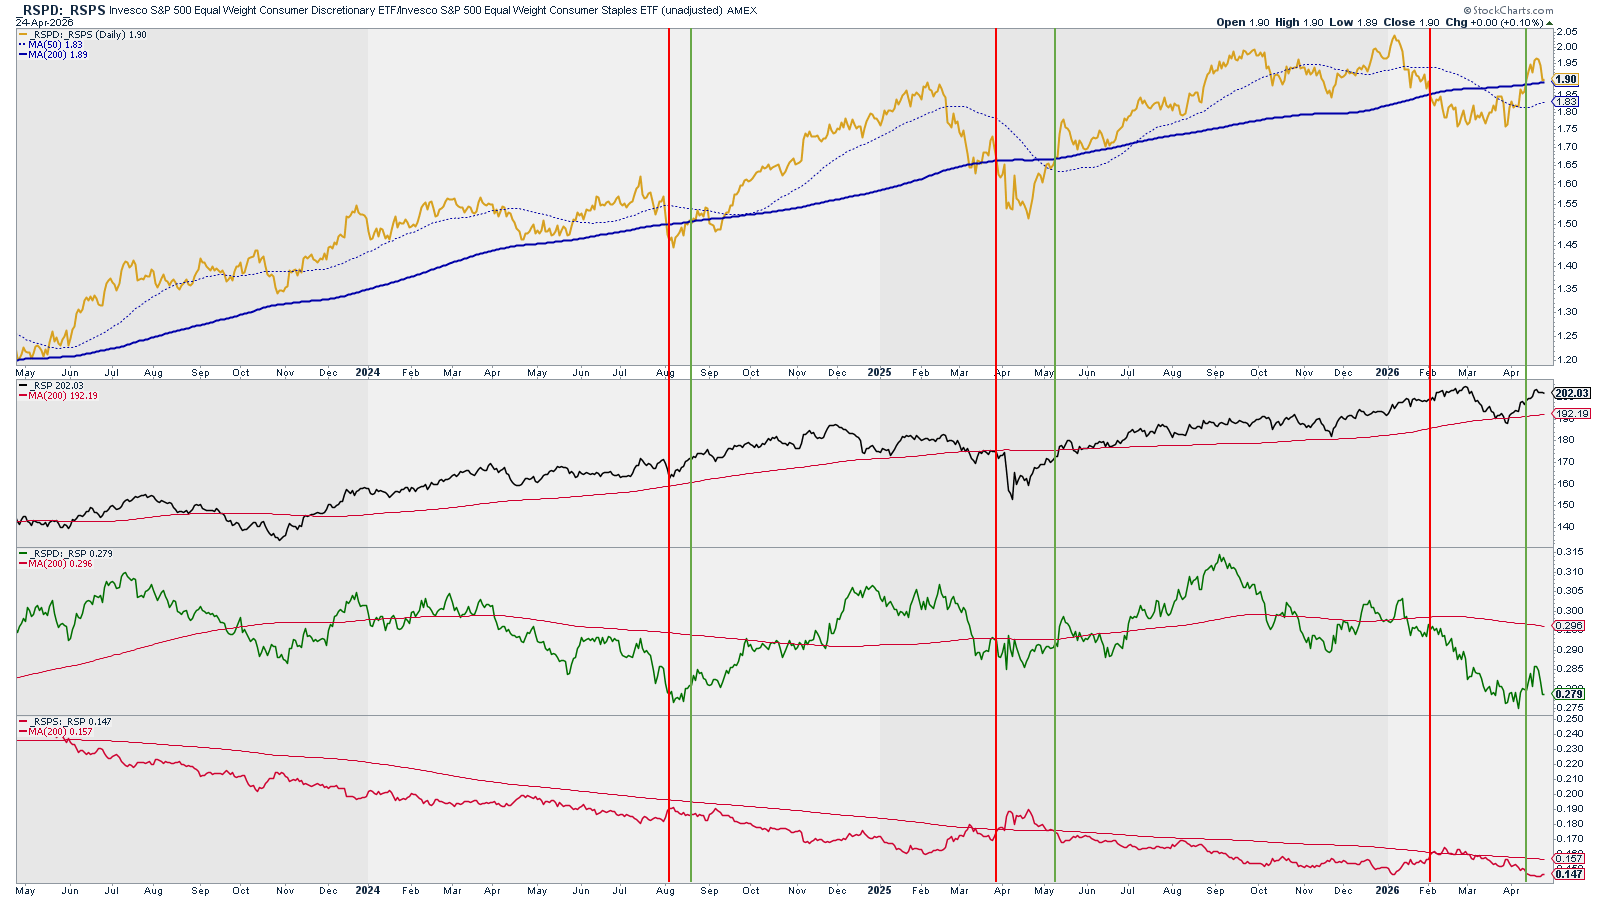
Analysis: We are about to make a Bearish signal (yellow) and Bulls (green) are very weak and not getting stronger.
Outlook: Bearish
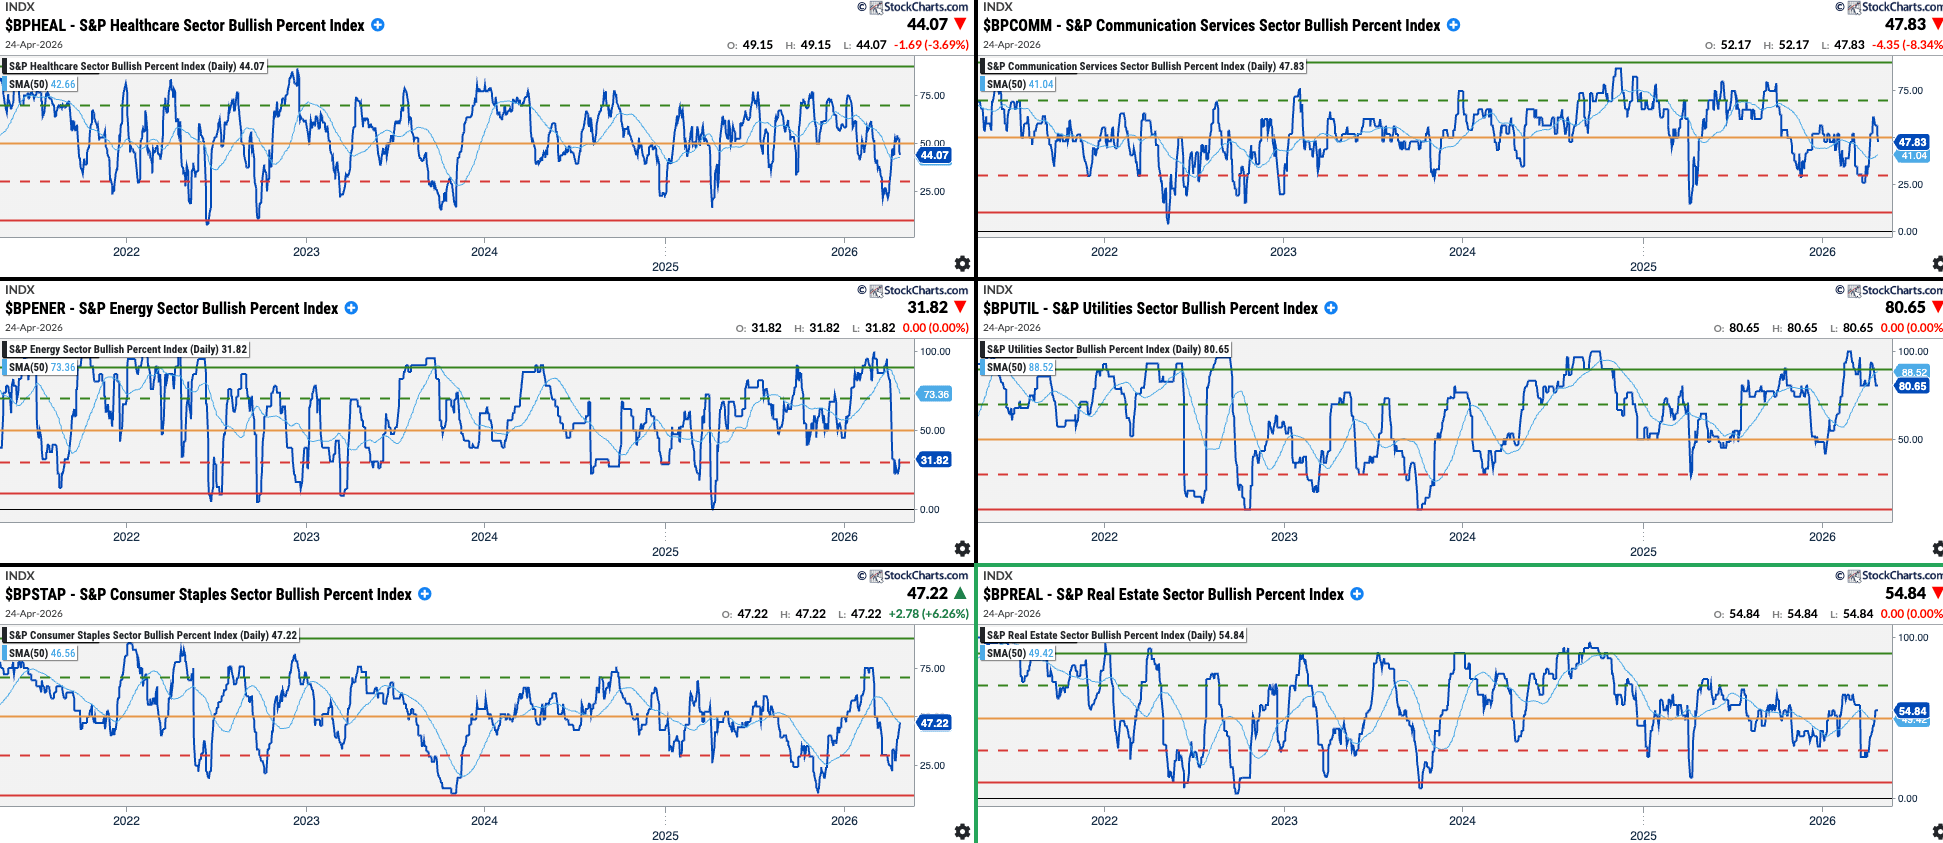
Sectors Rotation: Sectors Bullish Percent Index
Growth Sectors:
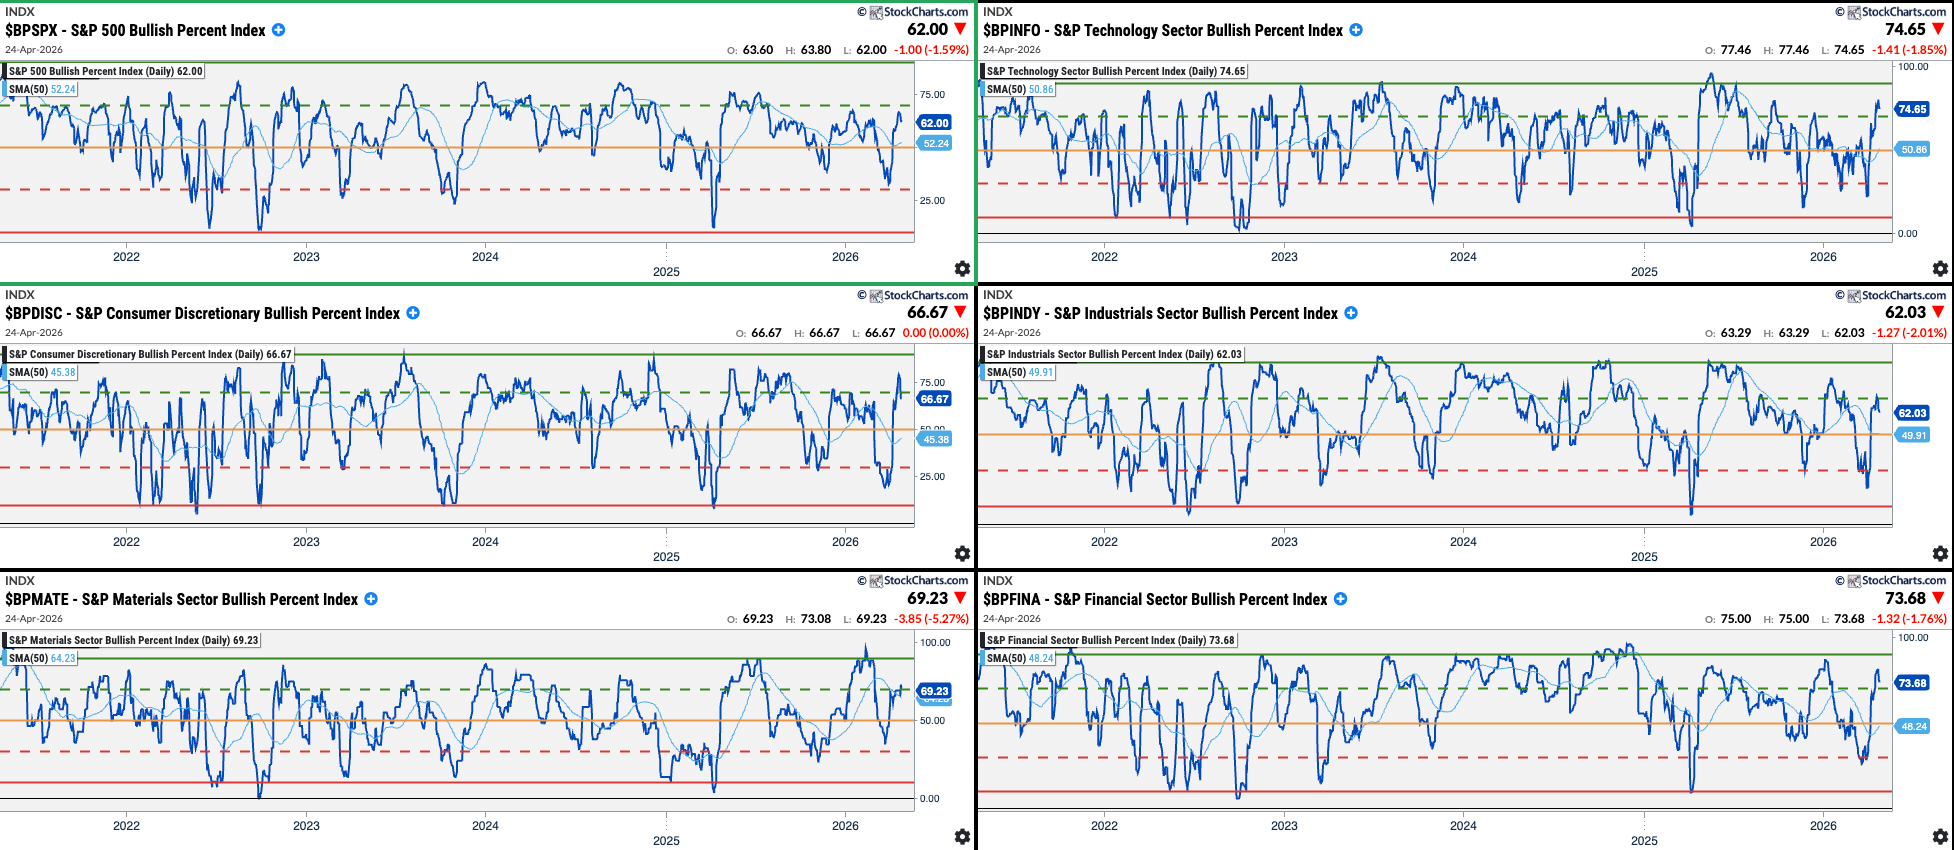
Value Sectors:
US Sectors order by ISM PMI Correlation (between parenthesis)
Growth Sectors - shall outperform when the market is bullish:
XLK: Technology (71%)
XLY: Cons. Discretionary (67%)
XLI: Industrials (66%)
XLB: Basic Materials (66%)
XLF: Financials (59%)
Value Sectors - shall outperform when the market is bearish:
XLV: Healthcare (55%)
XLC: Communications (49%)
XLE: Energy (44%)
XLU: Utilities (35%)
XLP: Cons. Staples (30%)
XLRE: Real Estate (16%)
Analysis:
Any sectors below their red levels are good opportunities to find great companies at good valuations or buy sector ETFs (buy cheap). Those sectors above their Green levels are candidates to be sold (sell expensive).
Buy Opportunities:
Sell Opportunities: XLU
Market & Economy Rotation
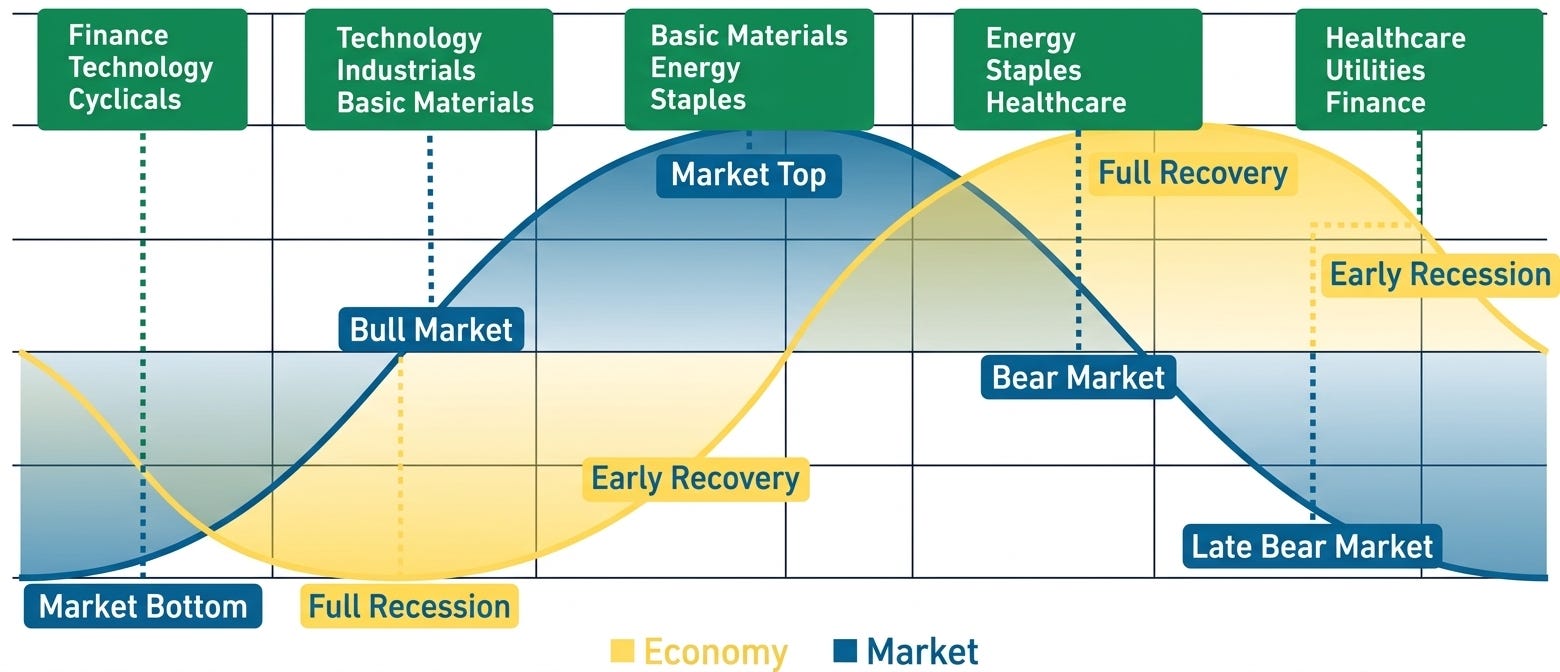
Analysis:
With a market moving at this speed is difficult to decide in which moment of the cycle we are. We know that the economy is improving from lower levels, so we could consider it “Early Recovery”. The market, after the noise brought by the Iran war, is signalling towards a Bull Market as we shall see Technology and Industrials leading.
Level 3: Where is it happening? Summary
Bulls vs. Bears: Bearish
Market & Economy Rotation: Bull Market
All Levels Summary and Final Thoughts
Level 1 Summary
Economic Data (long-term): Bullish
USD & Interest Rates: Neutral
Investors Sentiment: Bullish
Level 2 Summary
Price Action: Neutral
Breadth & Volatility: Neutral
Options: Neutral to Bearish
Level 3 Summary
Bulls vs. Bears: Bearish
Market & Economy Rotation: Bull Market
Final Thoughts
Dominant Narrative: Is this a bull trap?
New all time highs! And in the middle of a war, with a new Fed chairman starting soon, and mid-term elections in the horizon. But are really all time-highs?
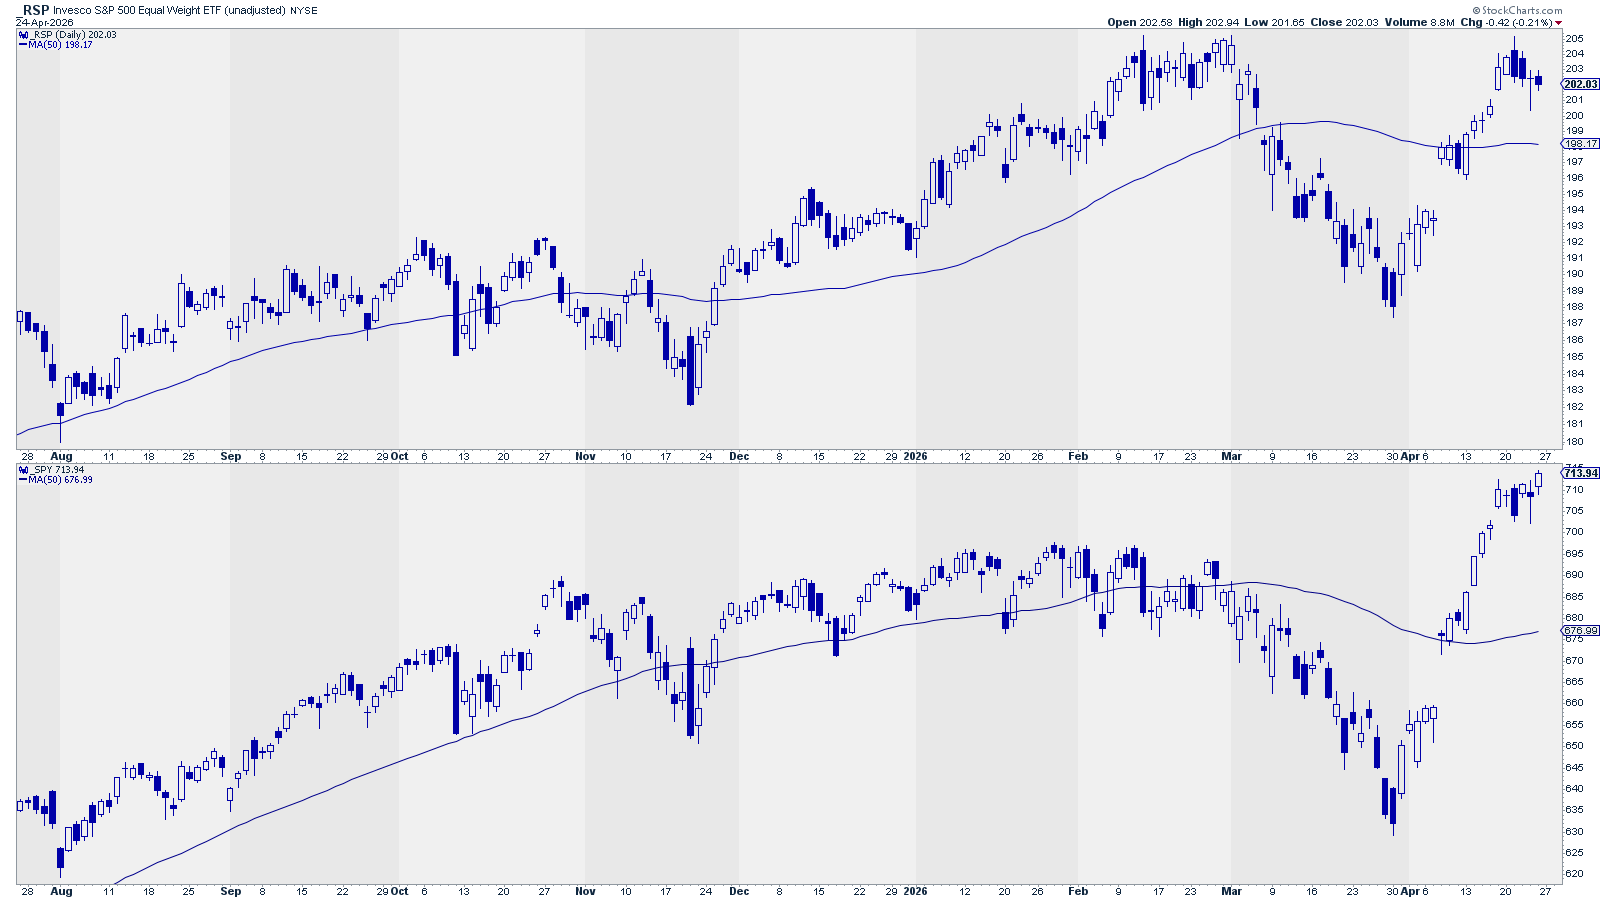
It depends on what you are looking at. In the chart above, the top chart is the RSP, which is the equal-weighted S&P500 ETF, and in the chart below the SPY, which is market-cap. weighted (plus the 50D SMA in both).
The RSP has found resistance at previous ATHs while the SPY has blasted through previous ATH levels. This over performance in SPY is due to technology, and knowing that software is not really having the best of its moments, then we know that Semiconductors are behind this move:
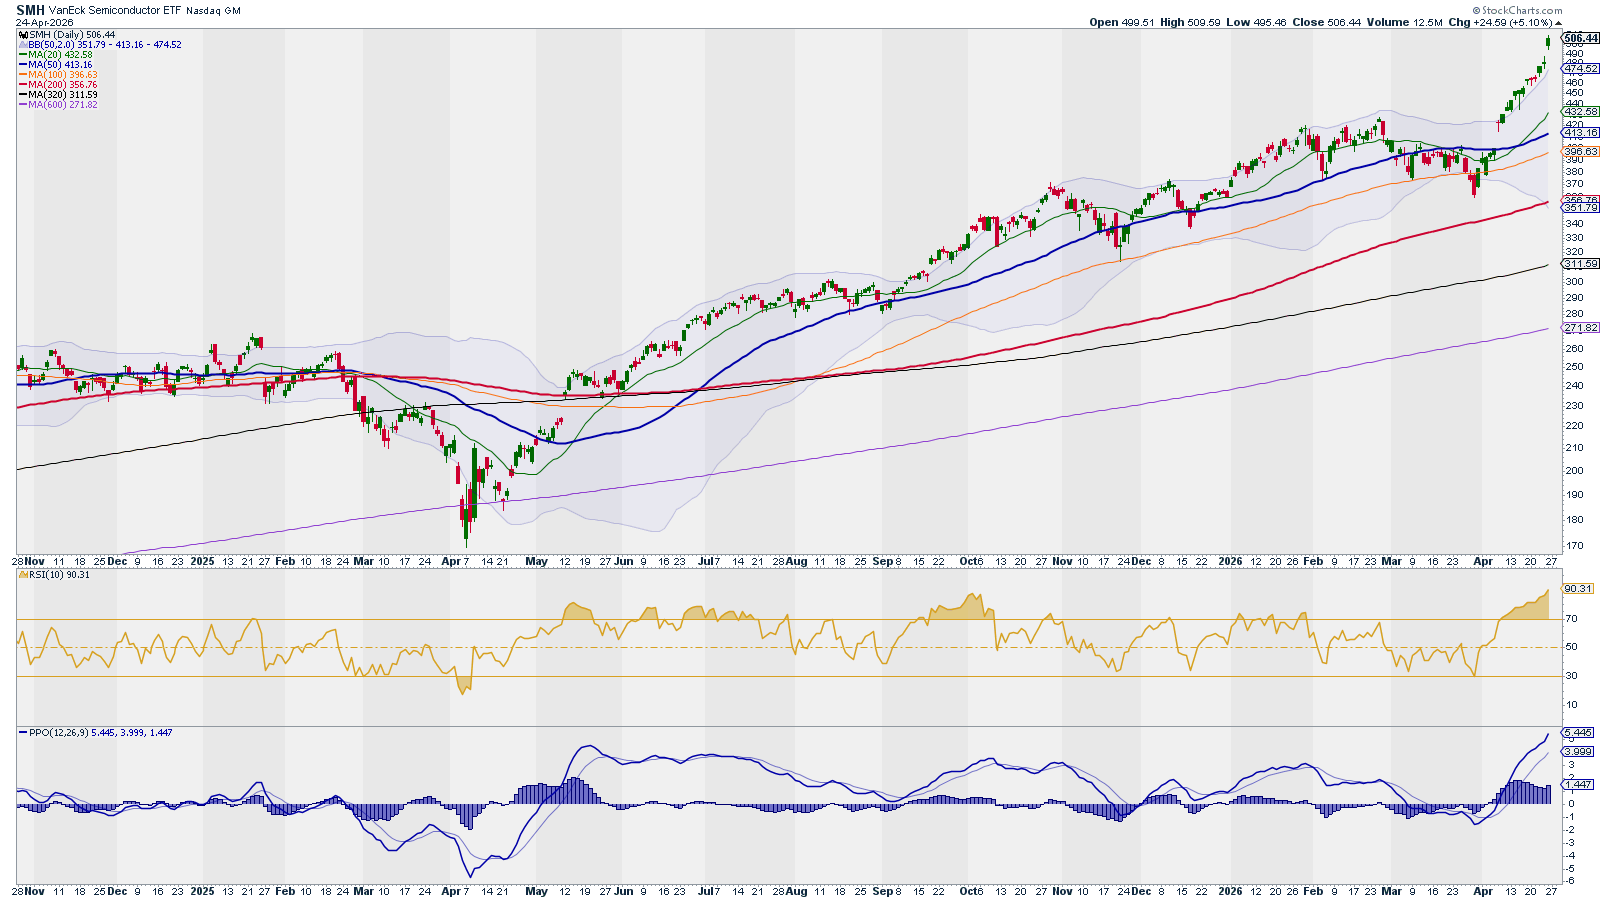
Can Semiconductors sustain this rally? Let’s have a look at history. This is the weekly chart for the last 10 years for semiconductors:
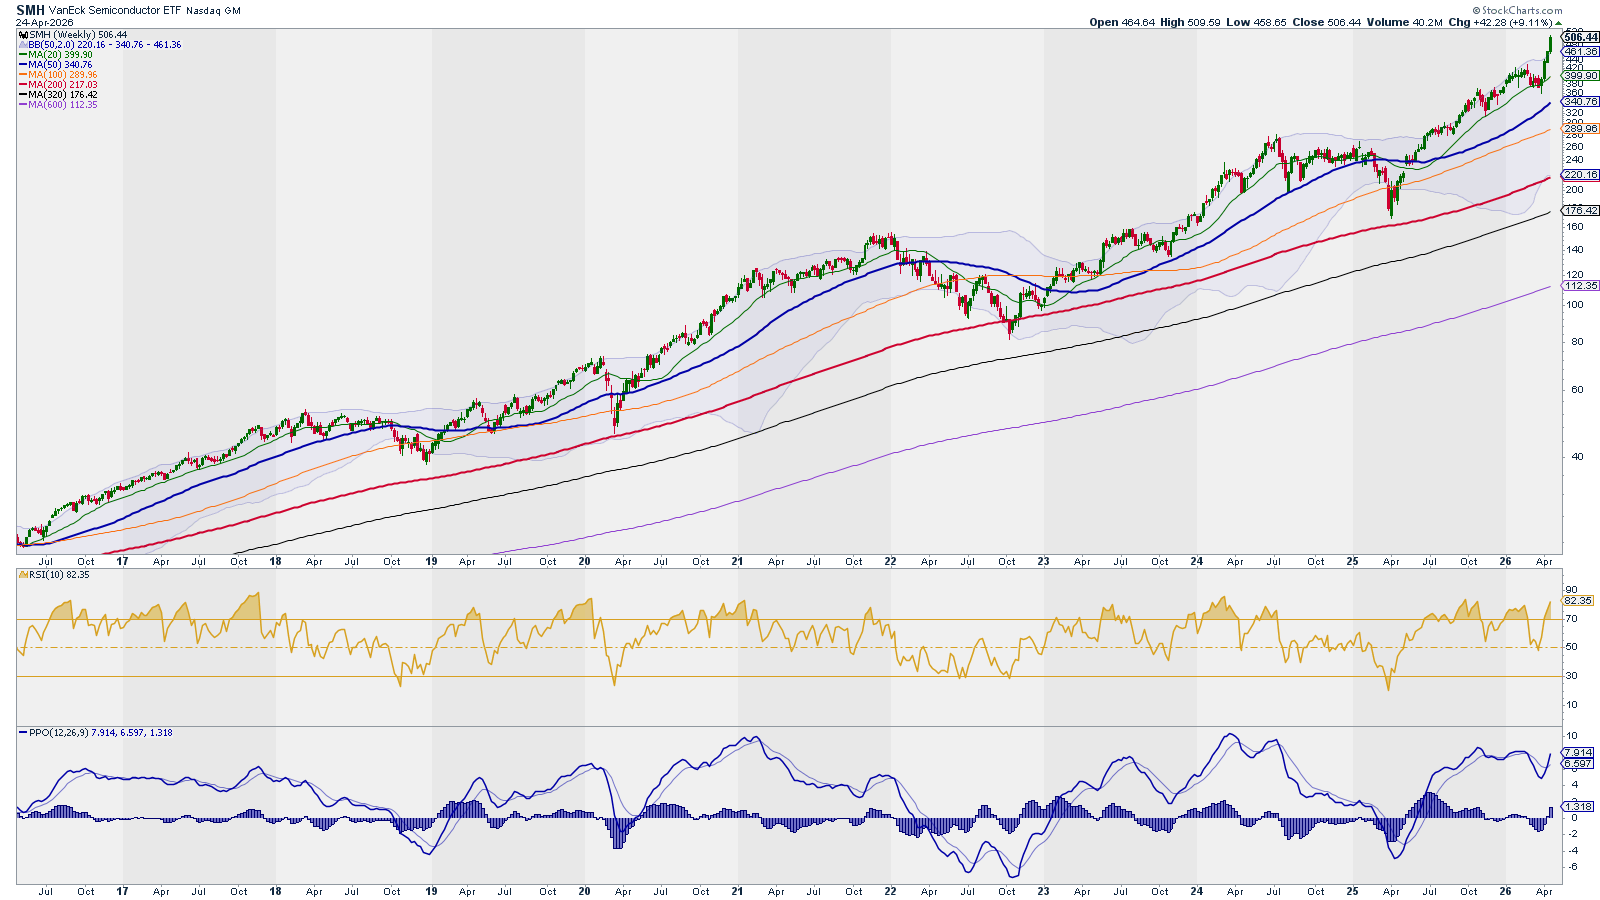
On the very left we have prices around $25, today we are above $500…
And if you don’t like semiconductors that much and prefer to invest in something more “real”, like infrastructure (railroads, highways, bridges, etc.) you could have taken those $25 5 years ago and invest in PAVE ETF:
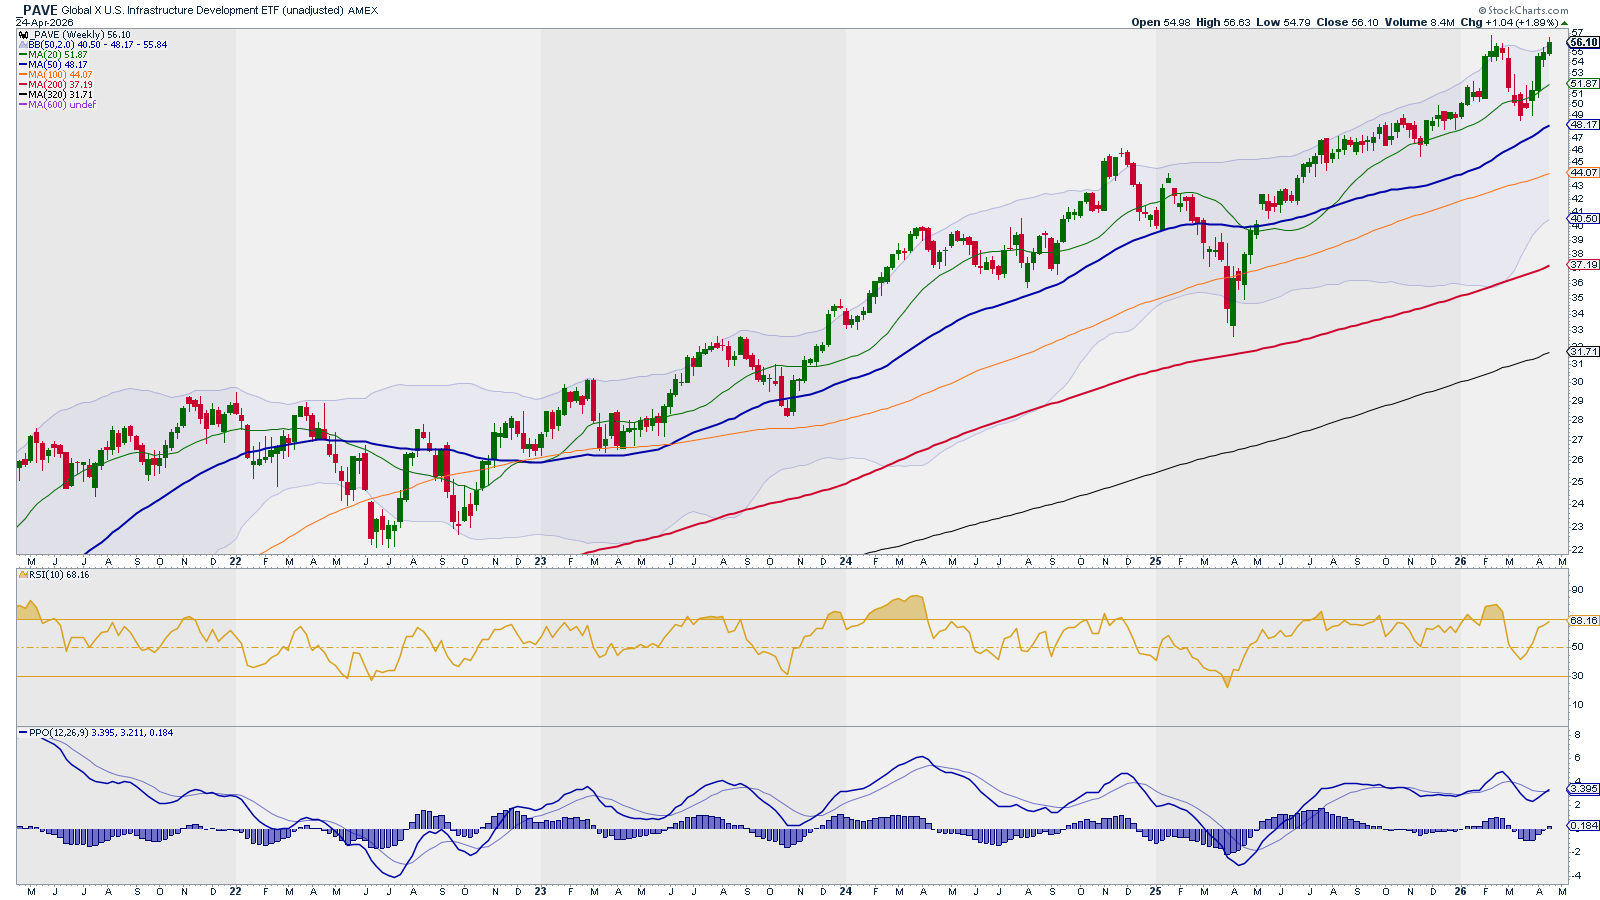
I think that it pays to invest in the infrastructure behind the real or the digital world. Specially in a type of infrastructure that is always in need of renovation.

Disclaimer: The content on AMAT Investing is strictly for educational and learning purposes. The author is not a licensed financial advisor and holds no formal financial education. This post does not constitute professional financial advice. All investing involves risk of loss. Always conduct your own research and consult a licensed professional before making any investment decisions.