

Weekly Review - 2026-Apr-17
And the market said... war?... what war???

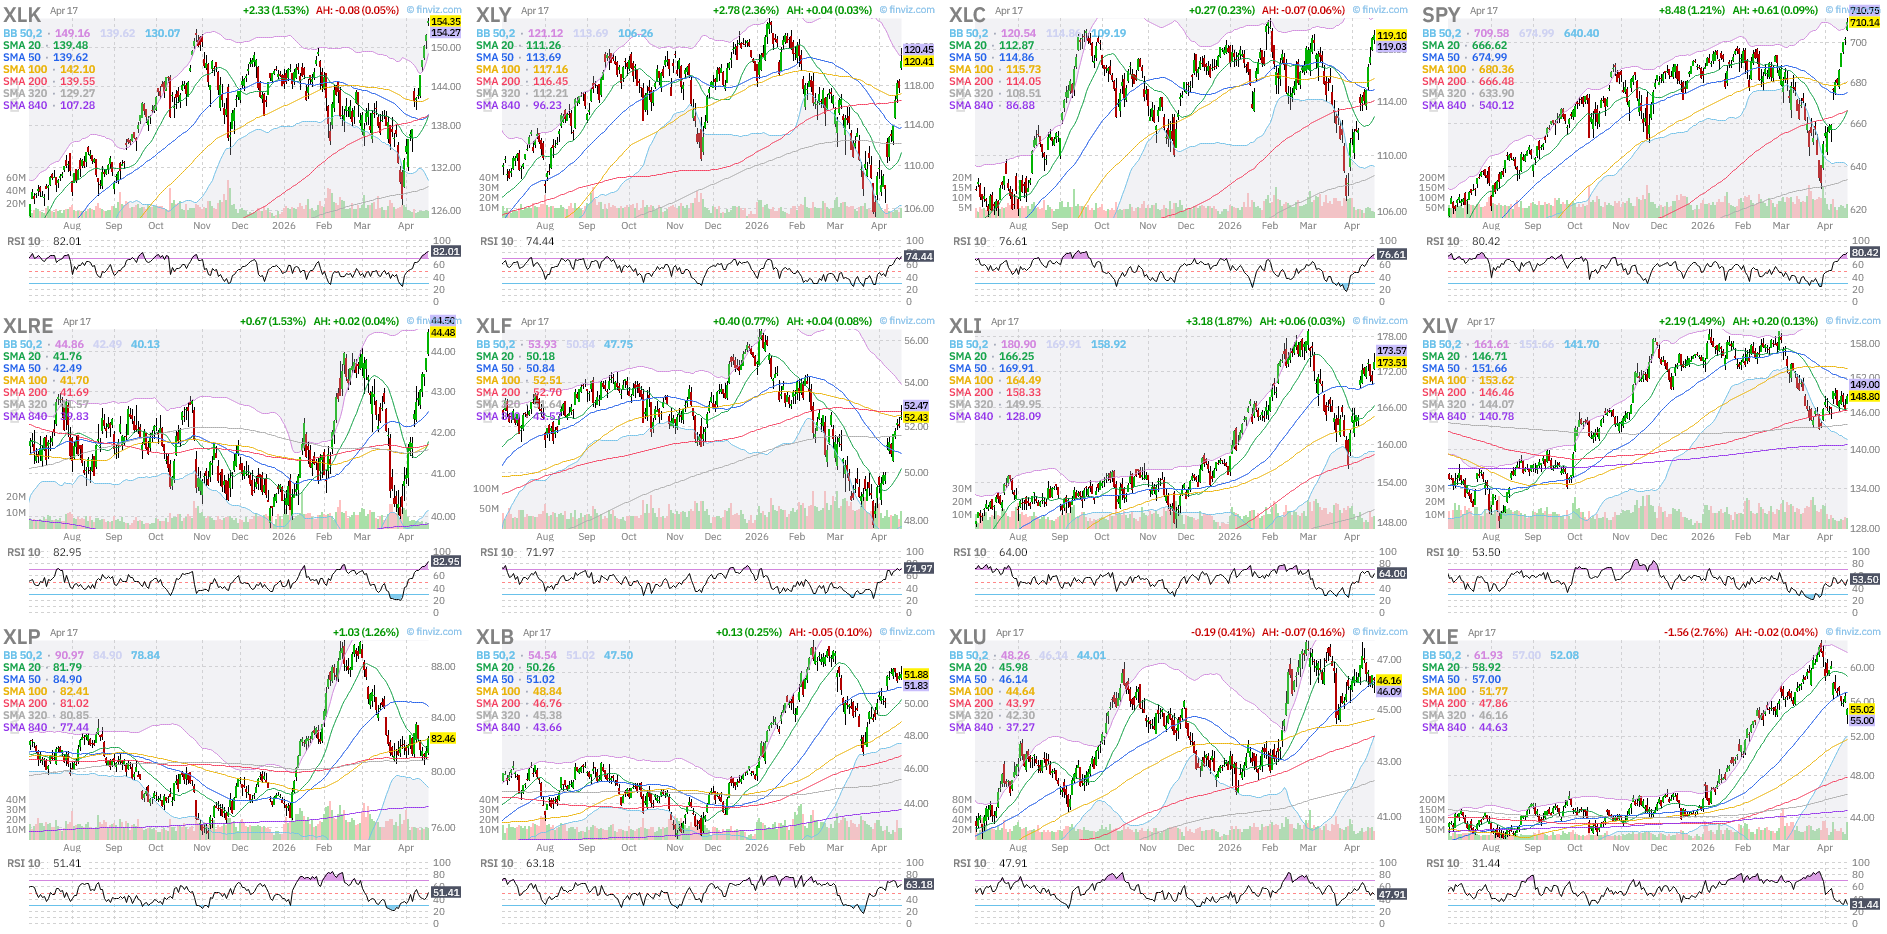
US Cap. Weighted Sectors ordered by weekly performance (desc):
Weekly:
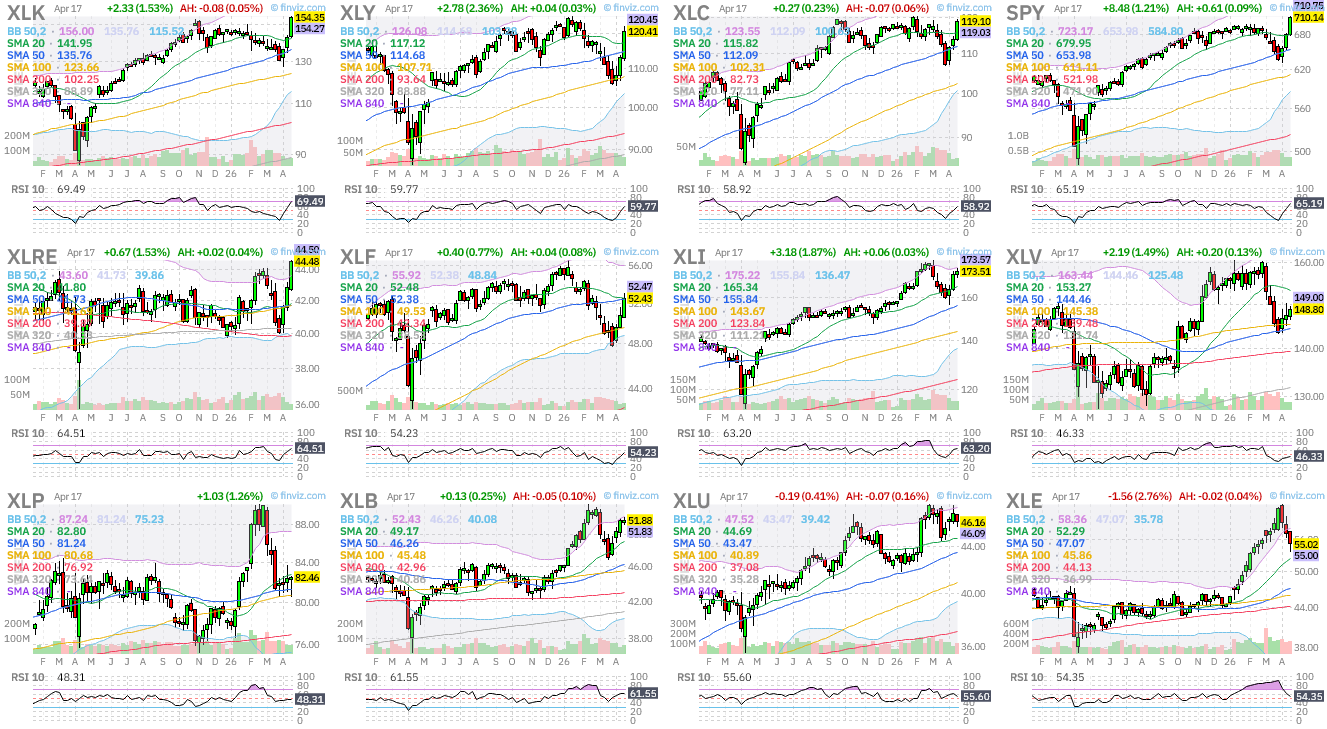
Daily:
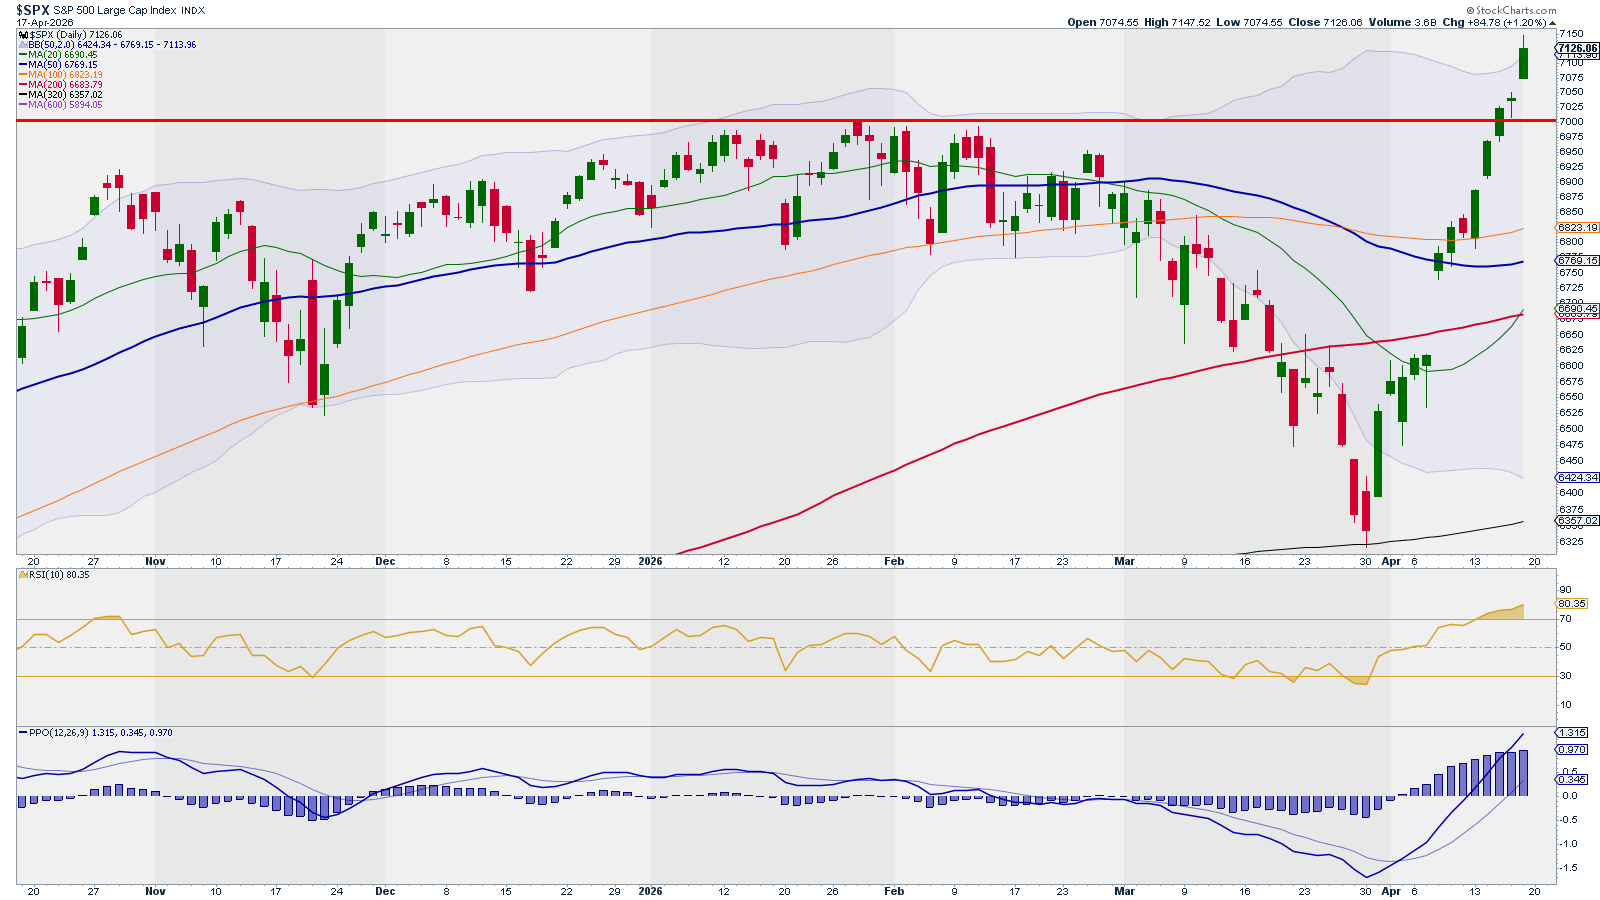
Comment: After finding support in the 320D SMA, the market, in the last 13 sessions, has erased all the losses from the war and launched to all time highs. The previous resistance and round 7,000 level was broken without much fuss. Gaps on the way up created.
In the sectors analysis we see technology leading, that means risk on. The leaders are leading, so the market indexes will raise. The bulls are back with a vengeance!
Level 1: Why is it happening?
Economic Data: Production: ISM PMI vs. SPX
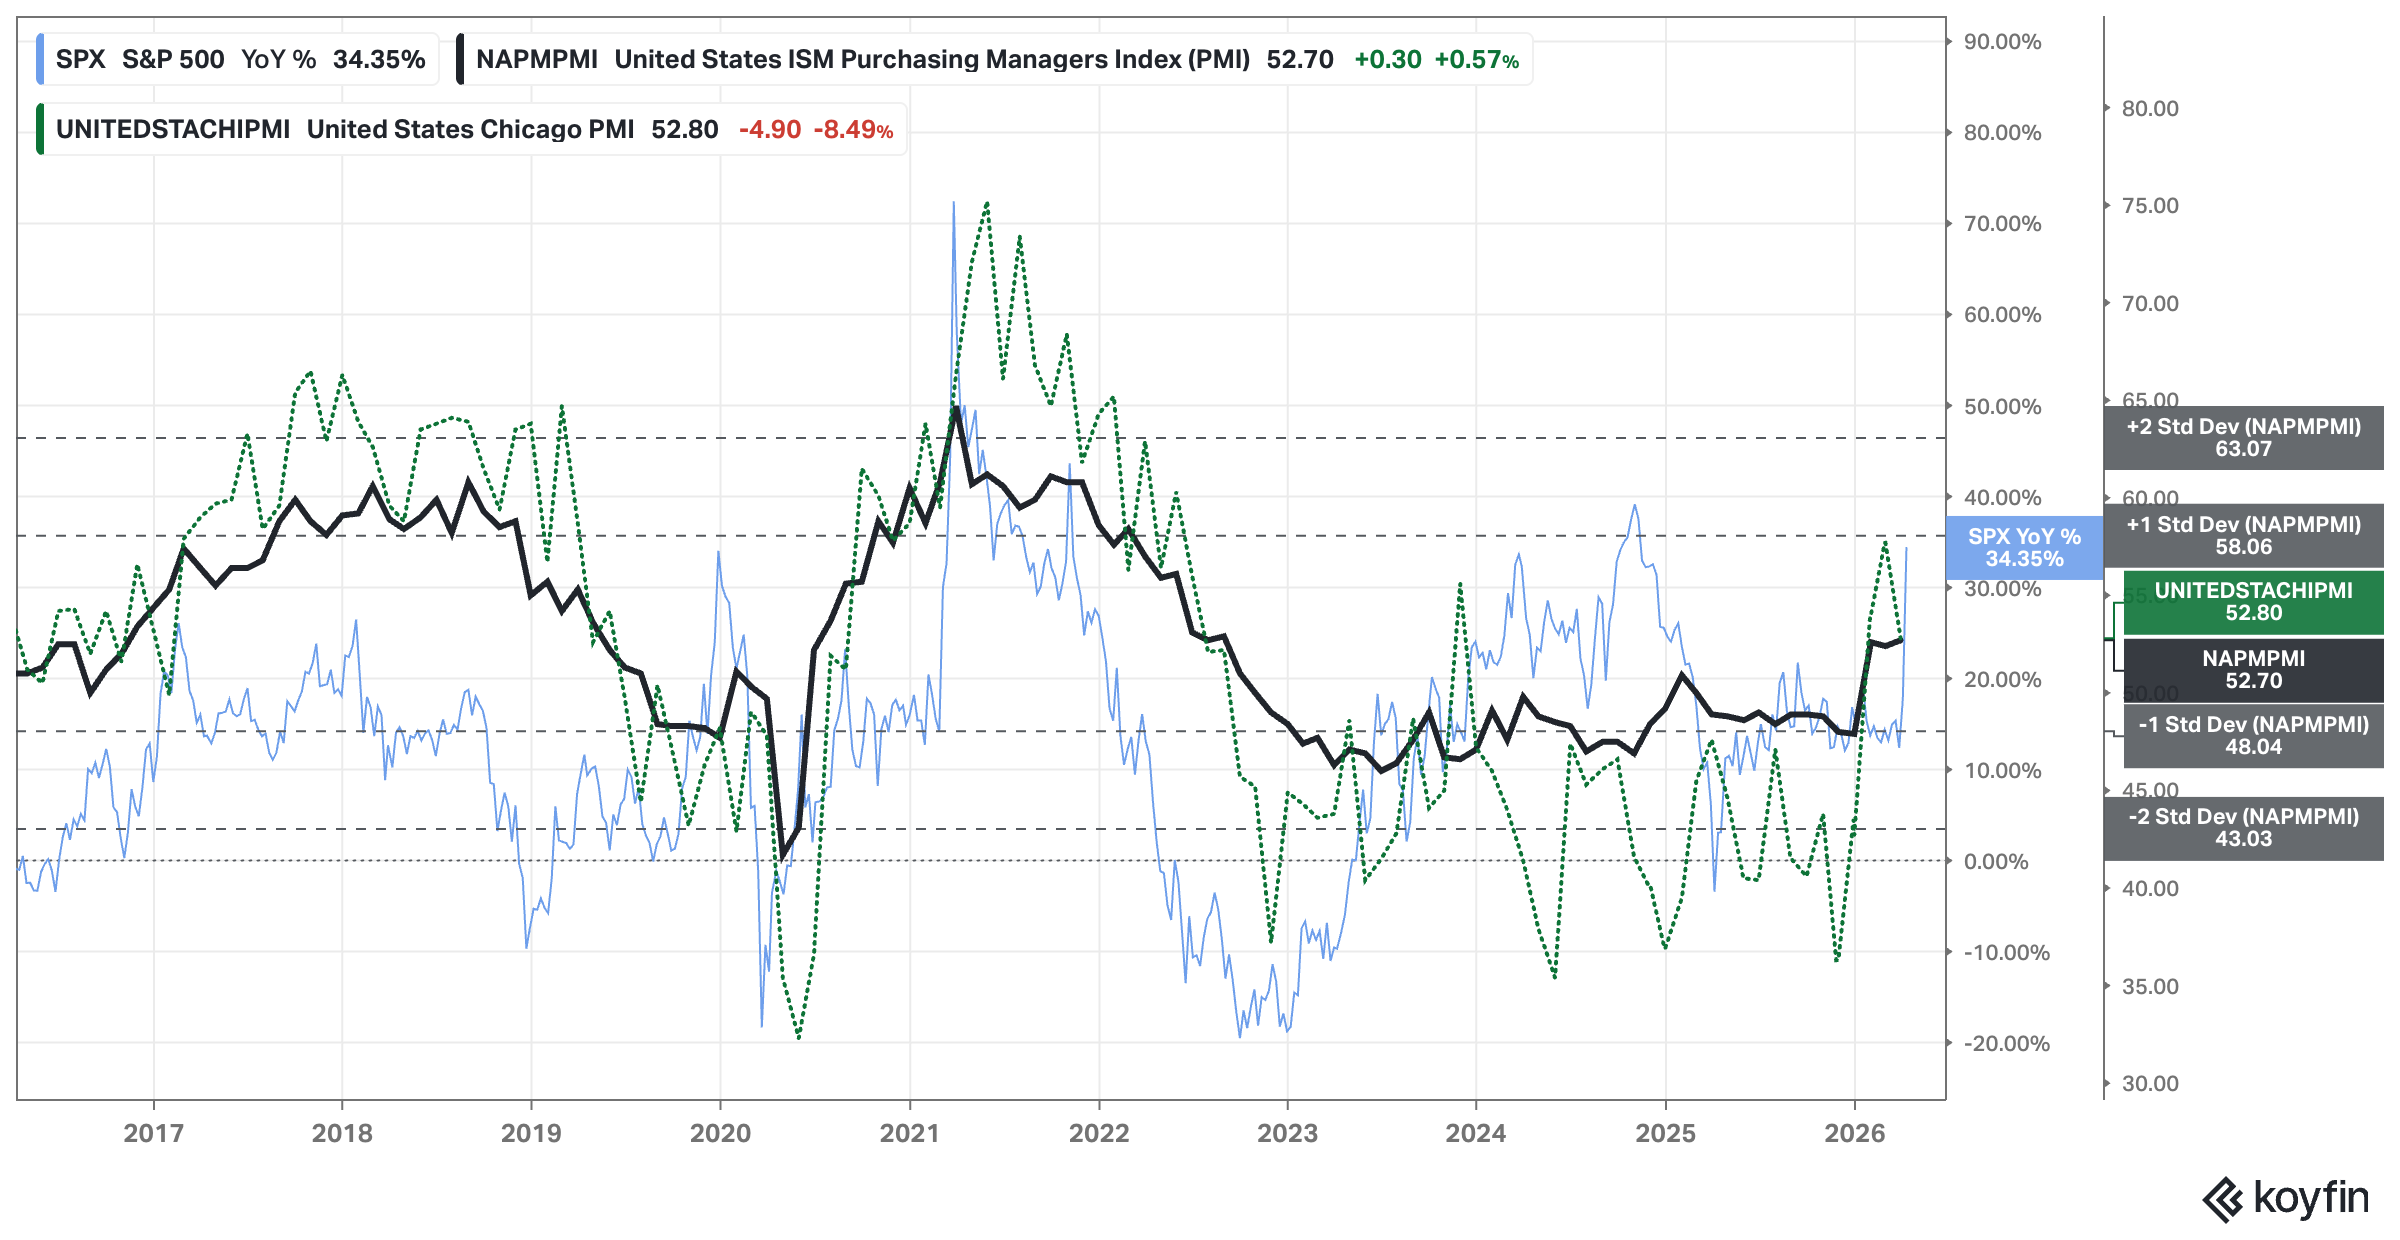
Analysis: No changes since last week.
Outlook: Bullish
Economic Data: Production: Dallas & Philadelphia Manufacturing vs. SPX
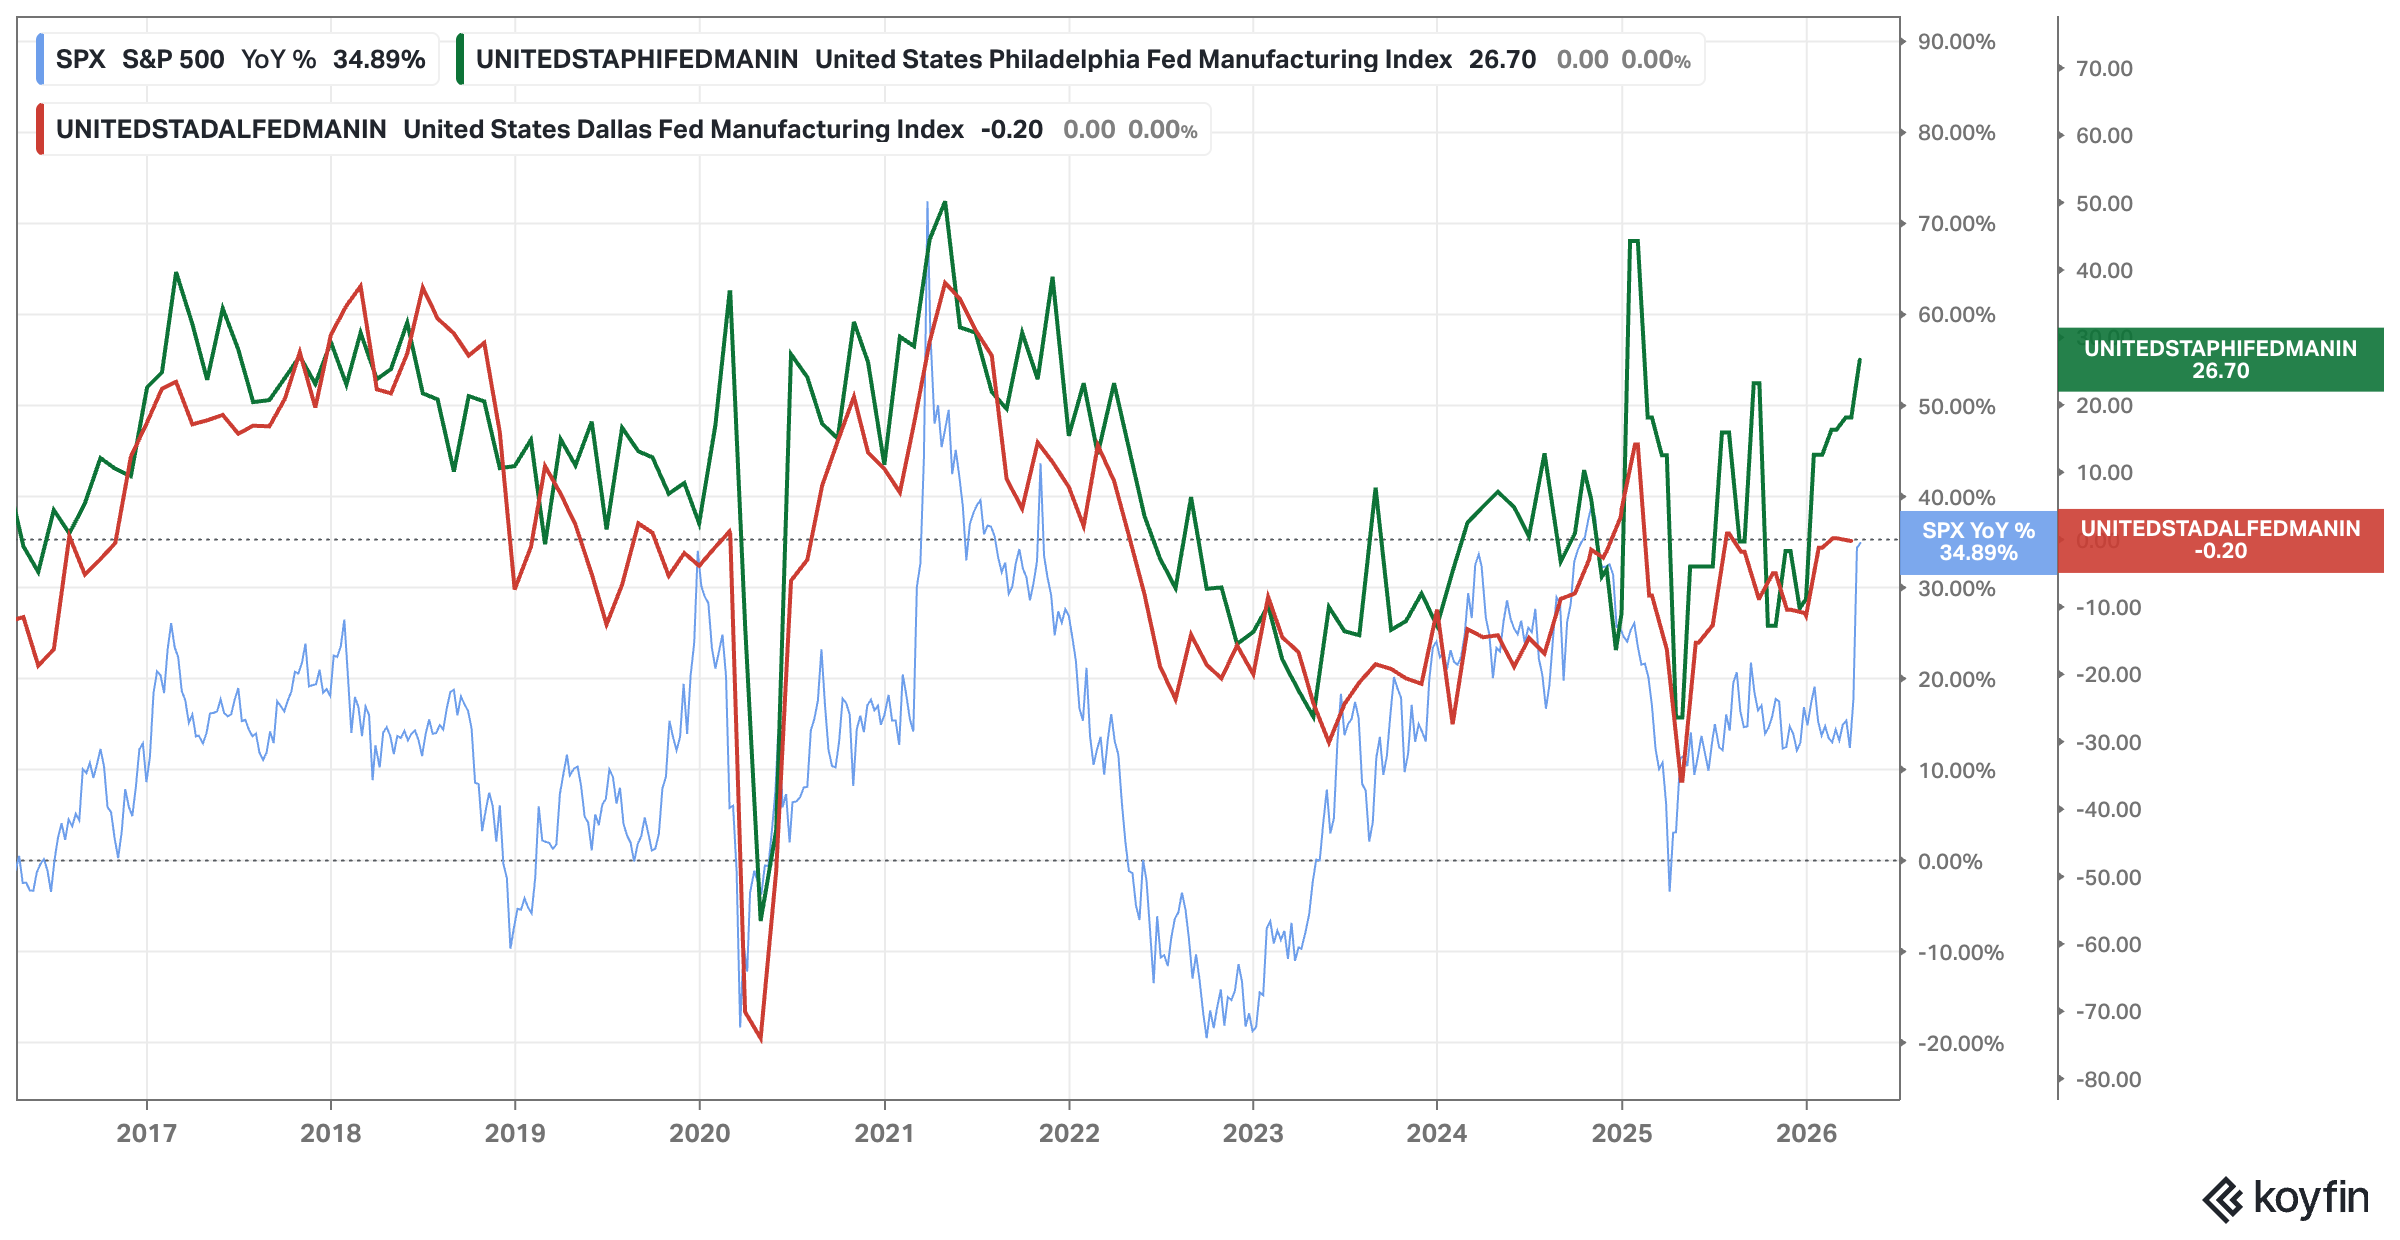
Analysis: Philadelphia manufacturing index increased.
Outlook: Bullish
Economic Data: Consumption: Consumer Sentiment
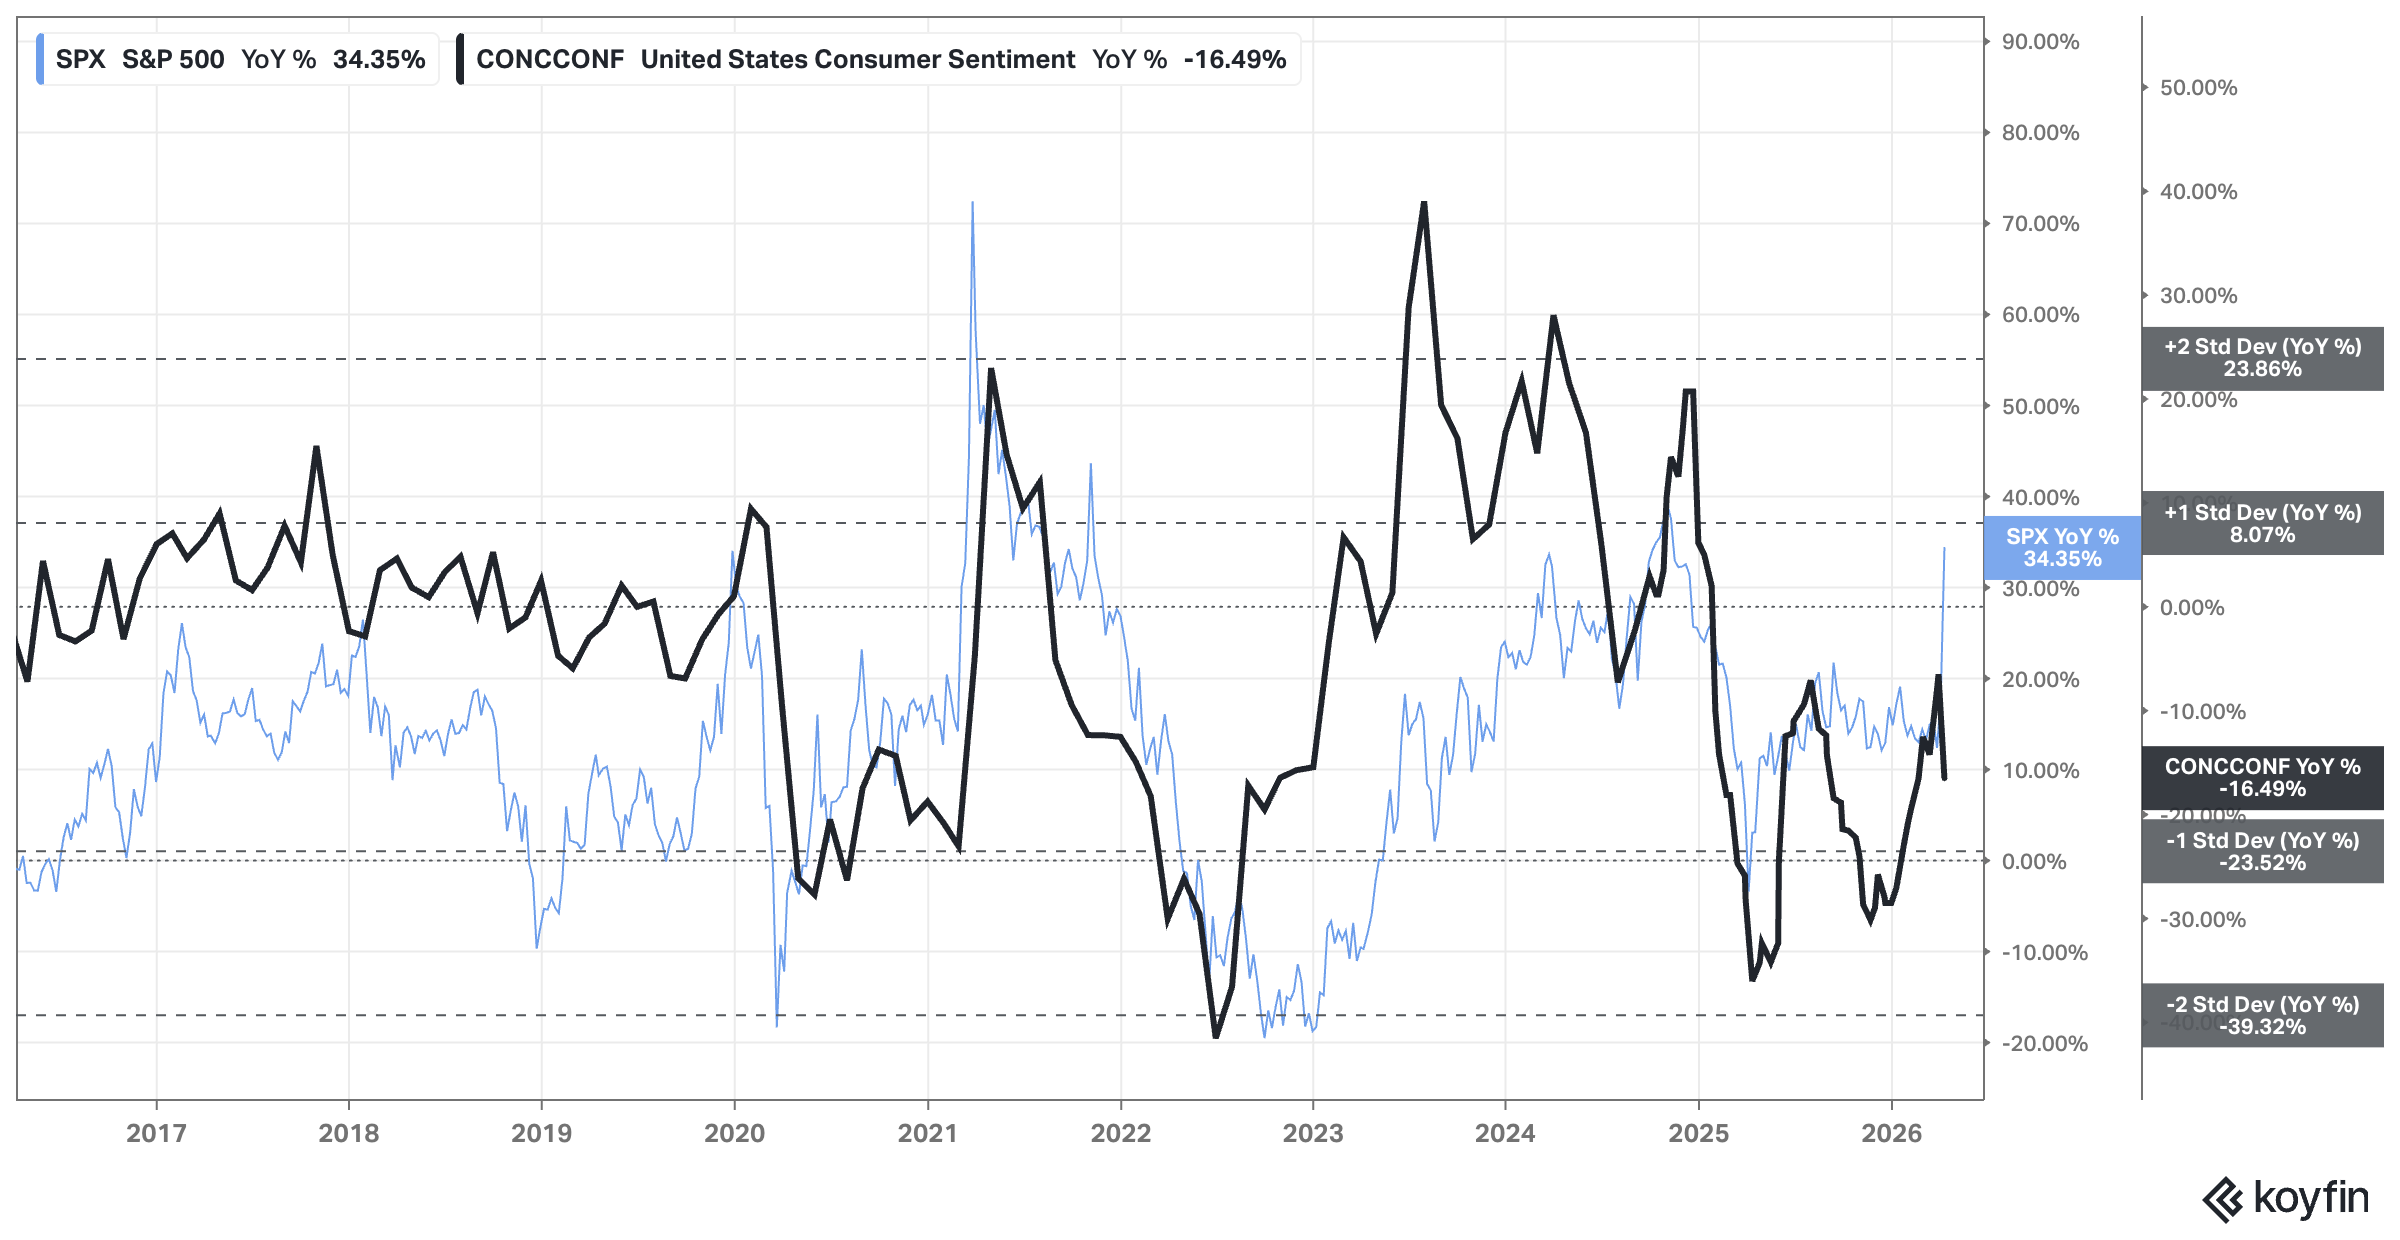
Analysis: The sentiment has deteriorated. Iran-war and the repercussions on gasoline price and overall fear of higher inflation have contributed to lower consumers’ optimism. We remain bullish as the Iran-war impact will be temporary and the sentiment was already quite low compared to previous readings (the consumer shall become more enthusiastic in the near future than the opposite).
Outlook: Bullish
USD & Interest Rates: FED, 2yr, 10yr, and 30yr Rates
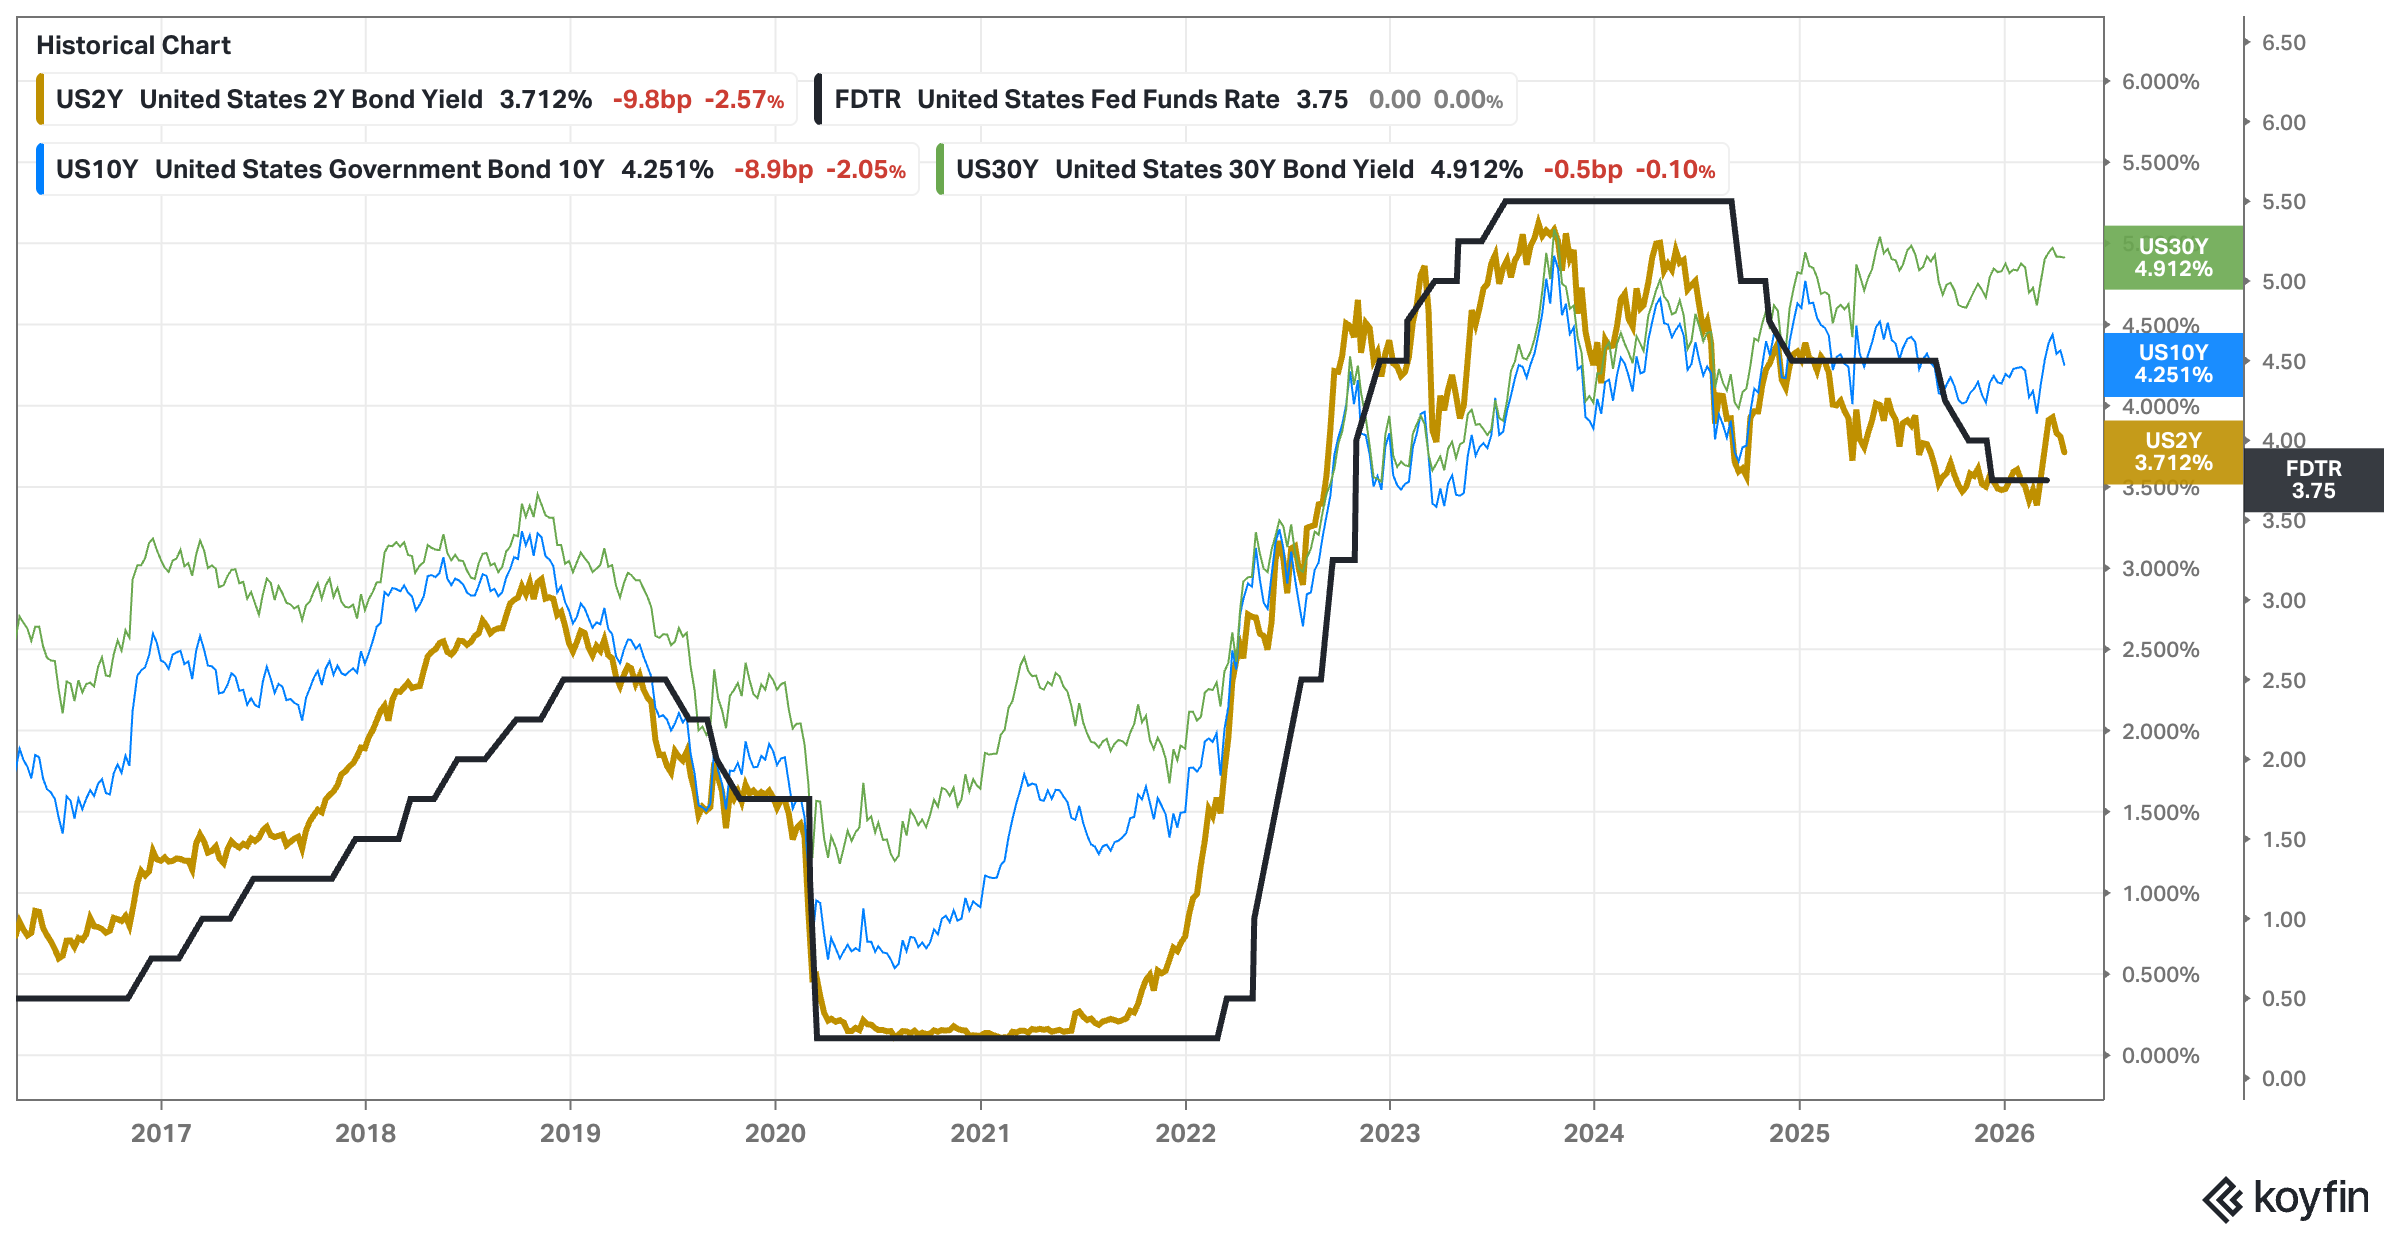
Analysis: Turnaround in rates. We want to see a continuation to lower readings, and quickly, to declare all clear in the bond market.
Outlook: Neutral to Bearish.
USD & Interest Rates: USD vs EEM and S&P500
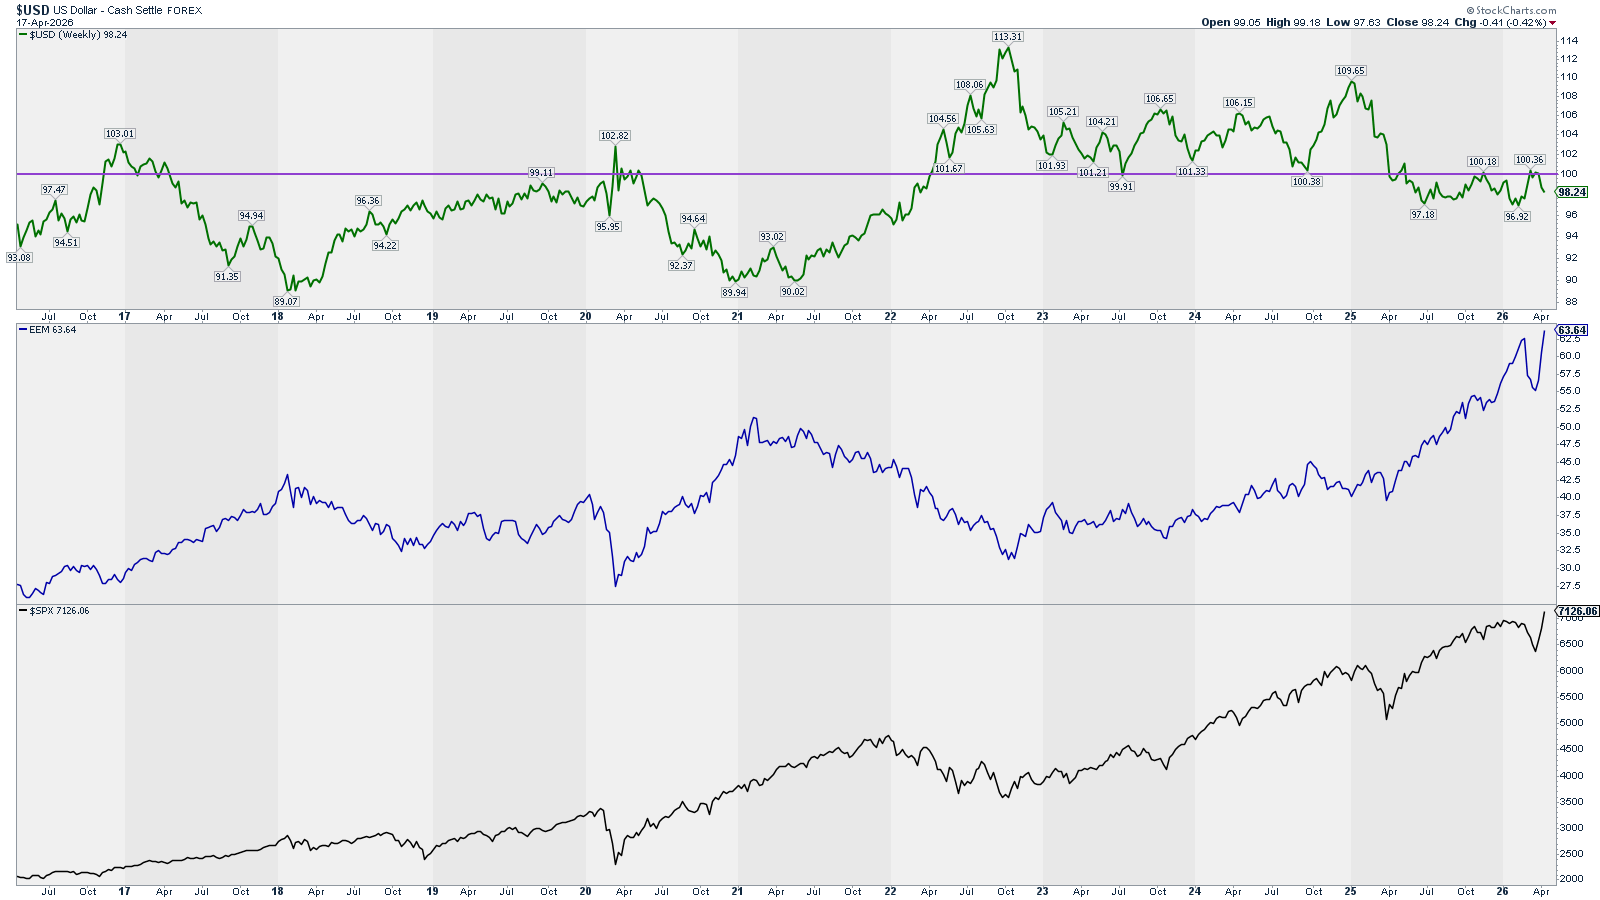
Analysis: USD 100 level resistance is proving to be difficult to break. The Iran-war developments towards peace have ease the pressure on the USD and allowed EEM to rally. I’m improving the outlook from Bearish to Neutral on the hopes of the Iran-war to de-escalate (no need to be resolved).
Outlook: Neutral (the longer the war the higher the oil & gas disruption)
Context Investors Sentiment: Credit Spreads
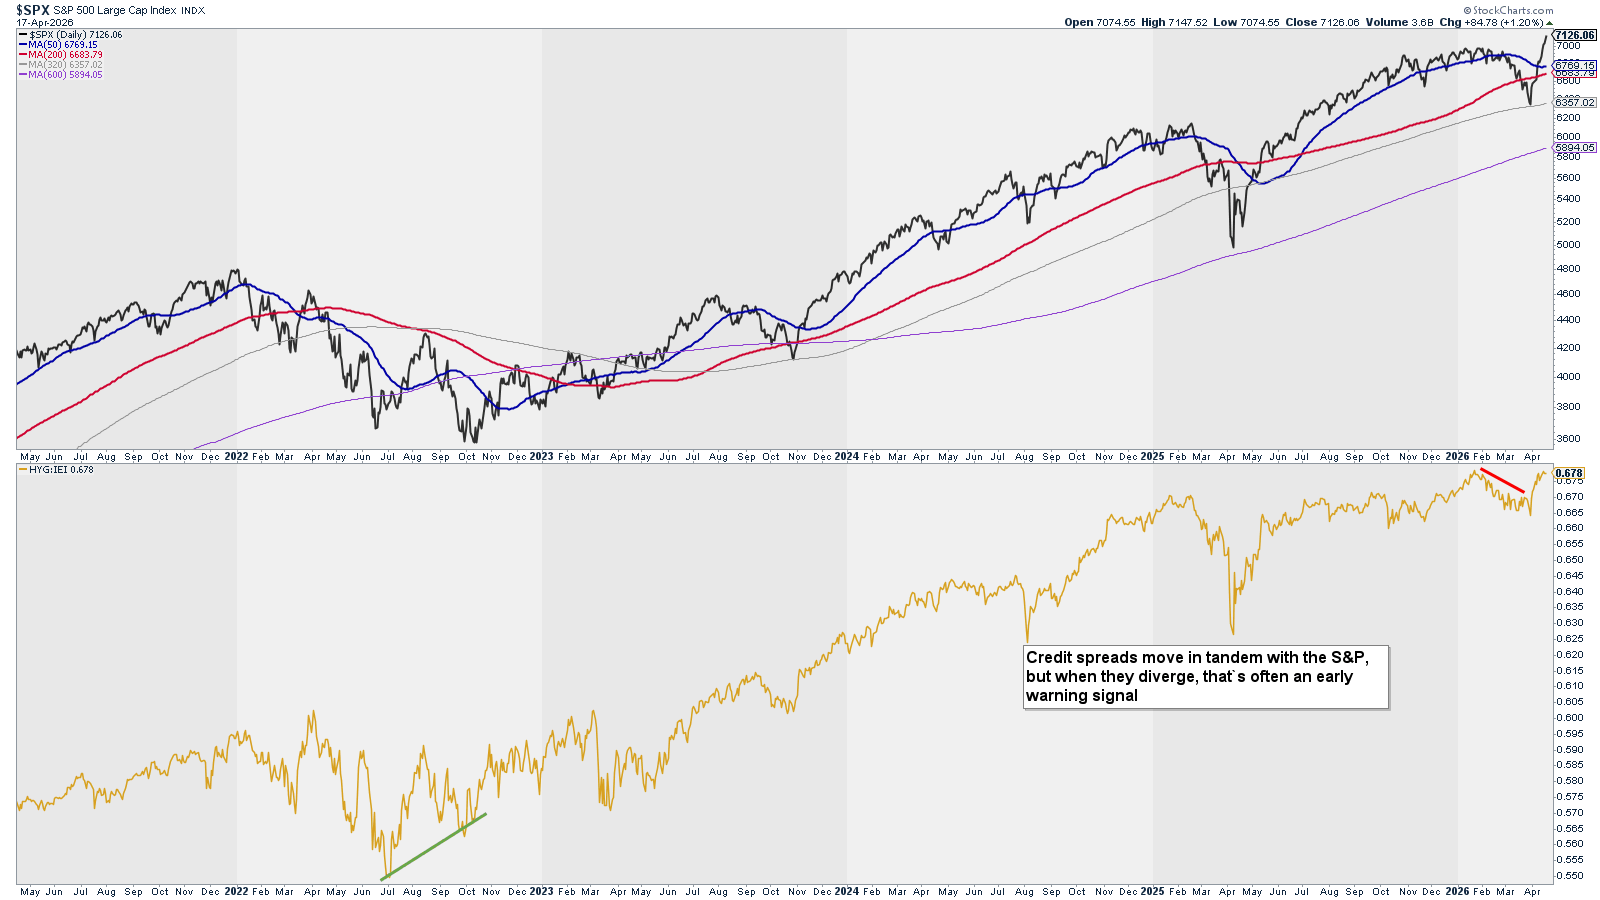
Credit spreads move in tandem with the S&P, but when they diverge, that’s often an early warning signal.
Analysis: Last week we saw the spreads raise. This was a good outlook for the market. This week, the spreads continued to raise, confirming the bullish outlook.
Outlook: Bullish
Level 1: Why is it happening? Summary
Economic Data (long-term): Bullish to Neutral
USD & Interest Rates: Neutral
Investors Sentiment: Bullish
What is happening? – Level 2
Price Action: SPX – Long Trend – 20 & 10 years
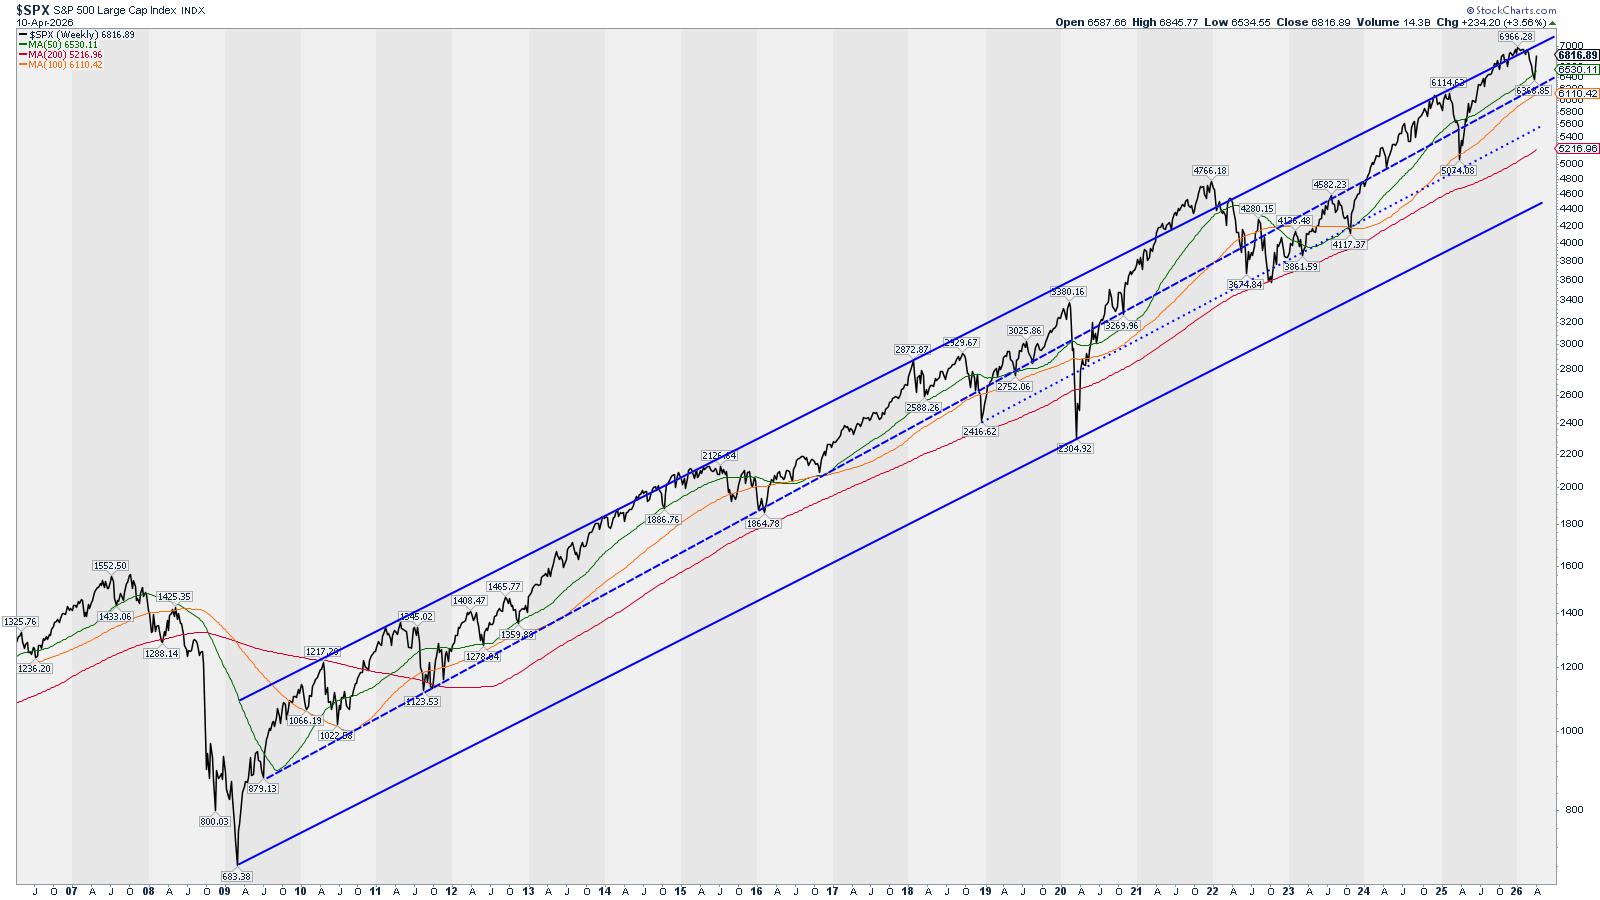
Analysis: The market is moving so fast that we are flip-flopping between bear to bull outlooks. We move from a significant long-term support to be near a long-term resistance in just a couple of weeks. The market still has some room on the upper side but it would be good to see some lateral moves to increase that upside room.
Outlook: Neutral
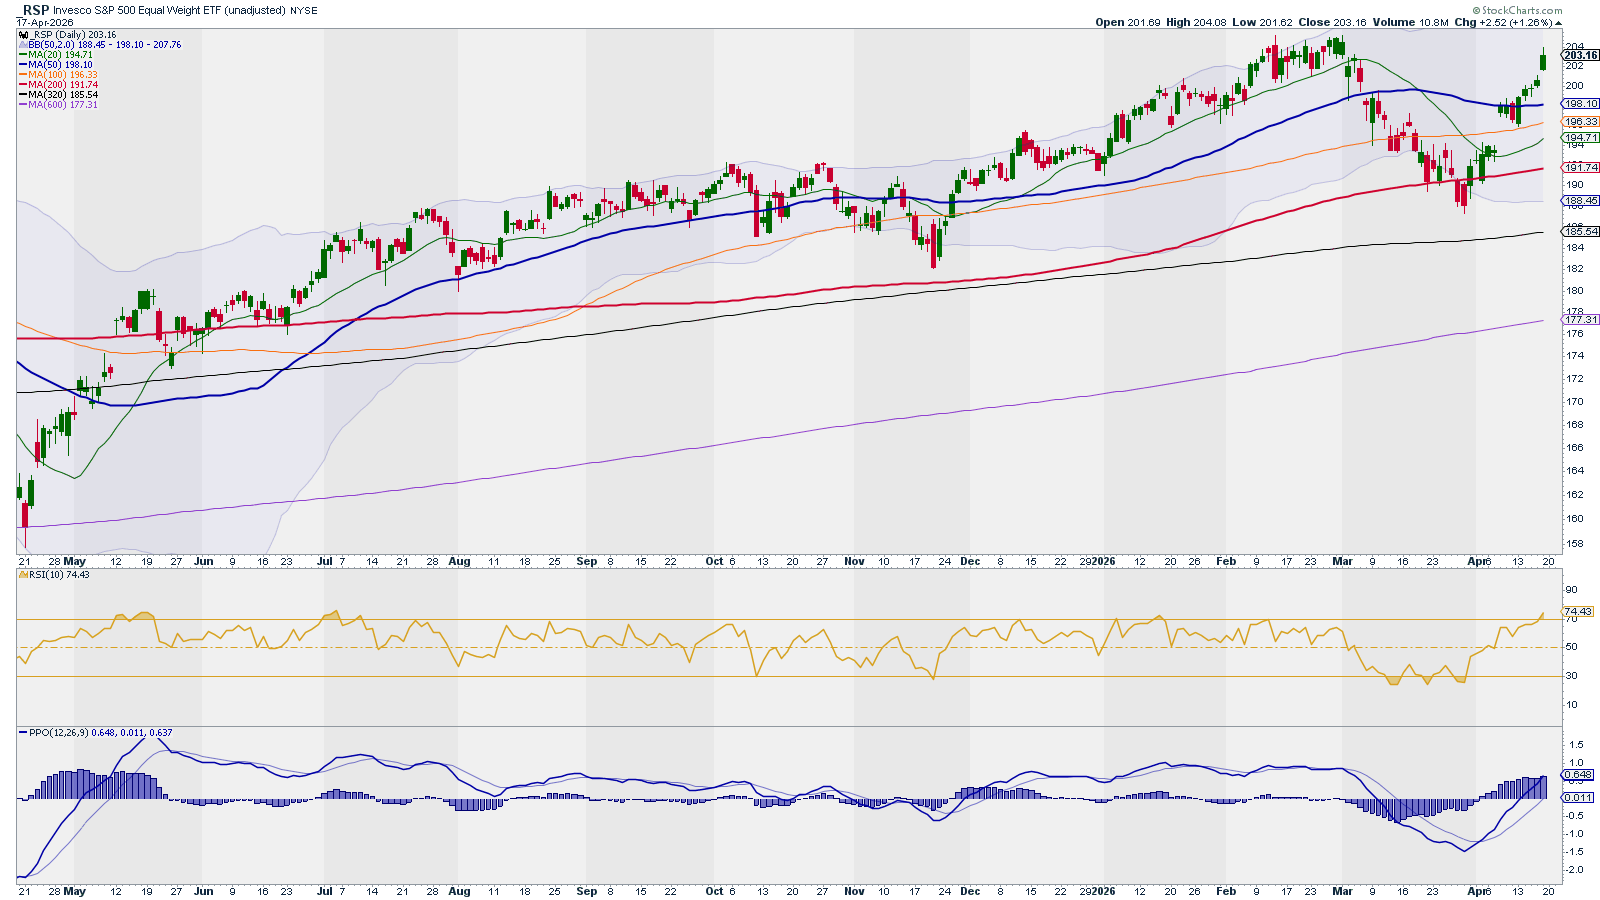
Price Action: RSP – Trend – Weekly

Analysis: We are getting closer to the upper BB band, which shall bring some resistance to the market. RSI is bullish and PPO is about to make a bullish cross.
Outlook: Neutral to Bullish
Price Action: RSP – Trend – Daily
Analysis: All SMA resistances broken in a “face ripping” rally. RSI entering overbought territory, yet that’s bullish. PPO is in a good bullish trend. Price has still upside room to rally.
Outlook: Bullish
Breadth & Volatility: % Stocks above 200 SMA vs. RSP
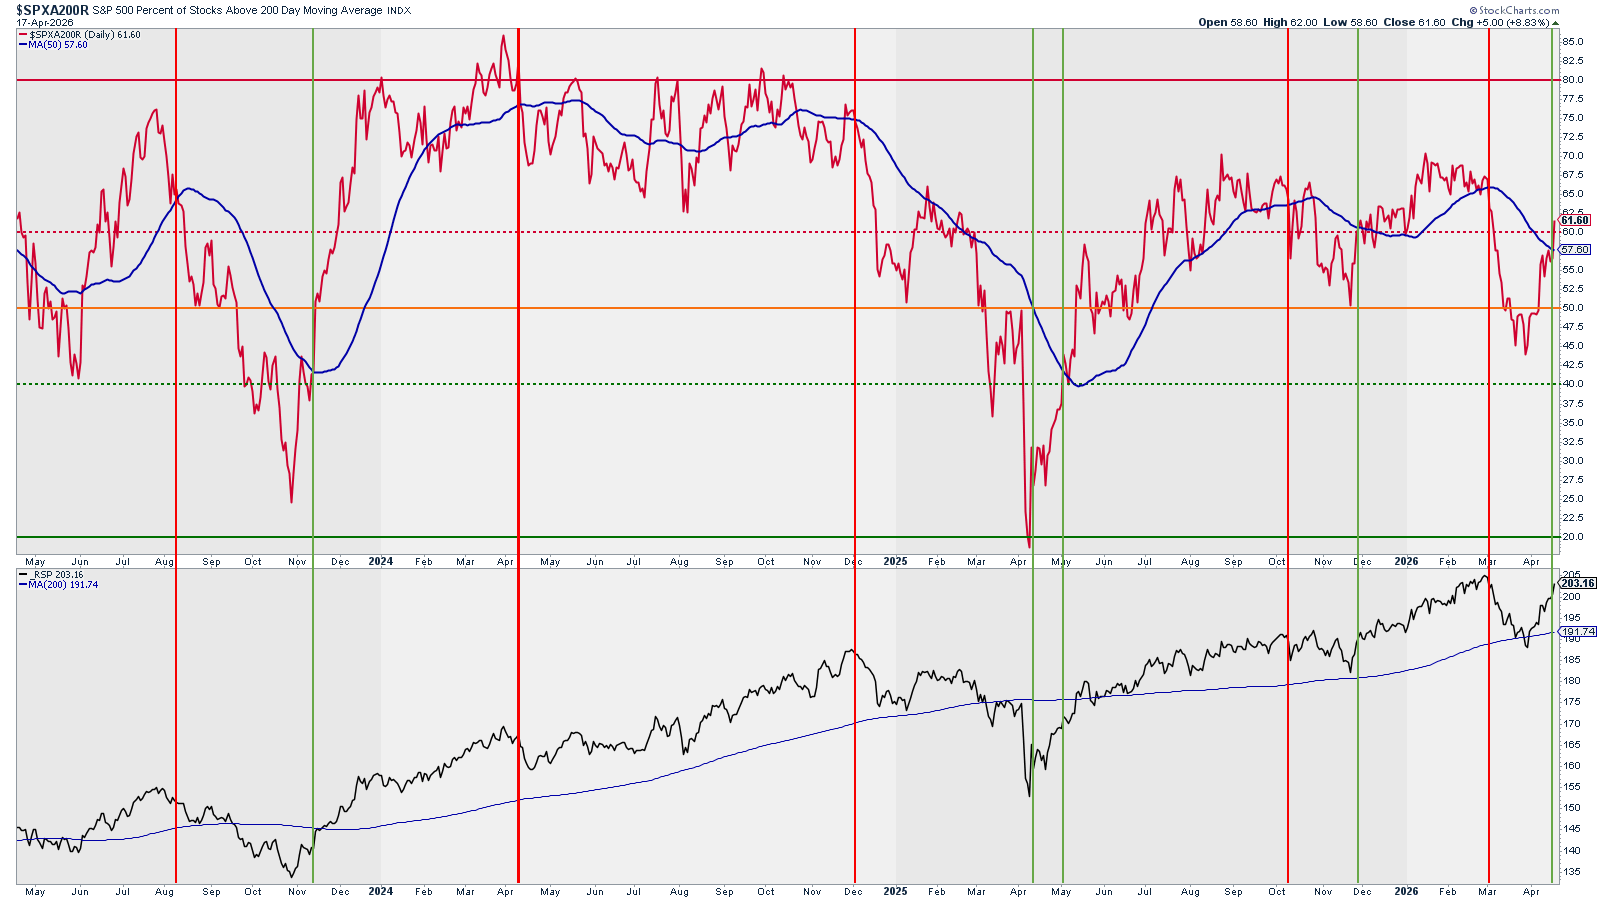
Analysis: Bull signal triggered with a % of stocks above their 200D SMA above it’s 50D SMA and above the 60%. This market still has a lot of room to rally.
Outlook: Bullish
Breadth & Volatility: RSP and % Stocks above 200, 50, and 20 SMA
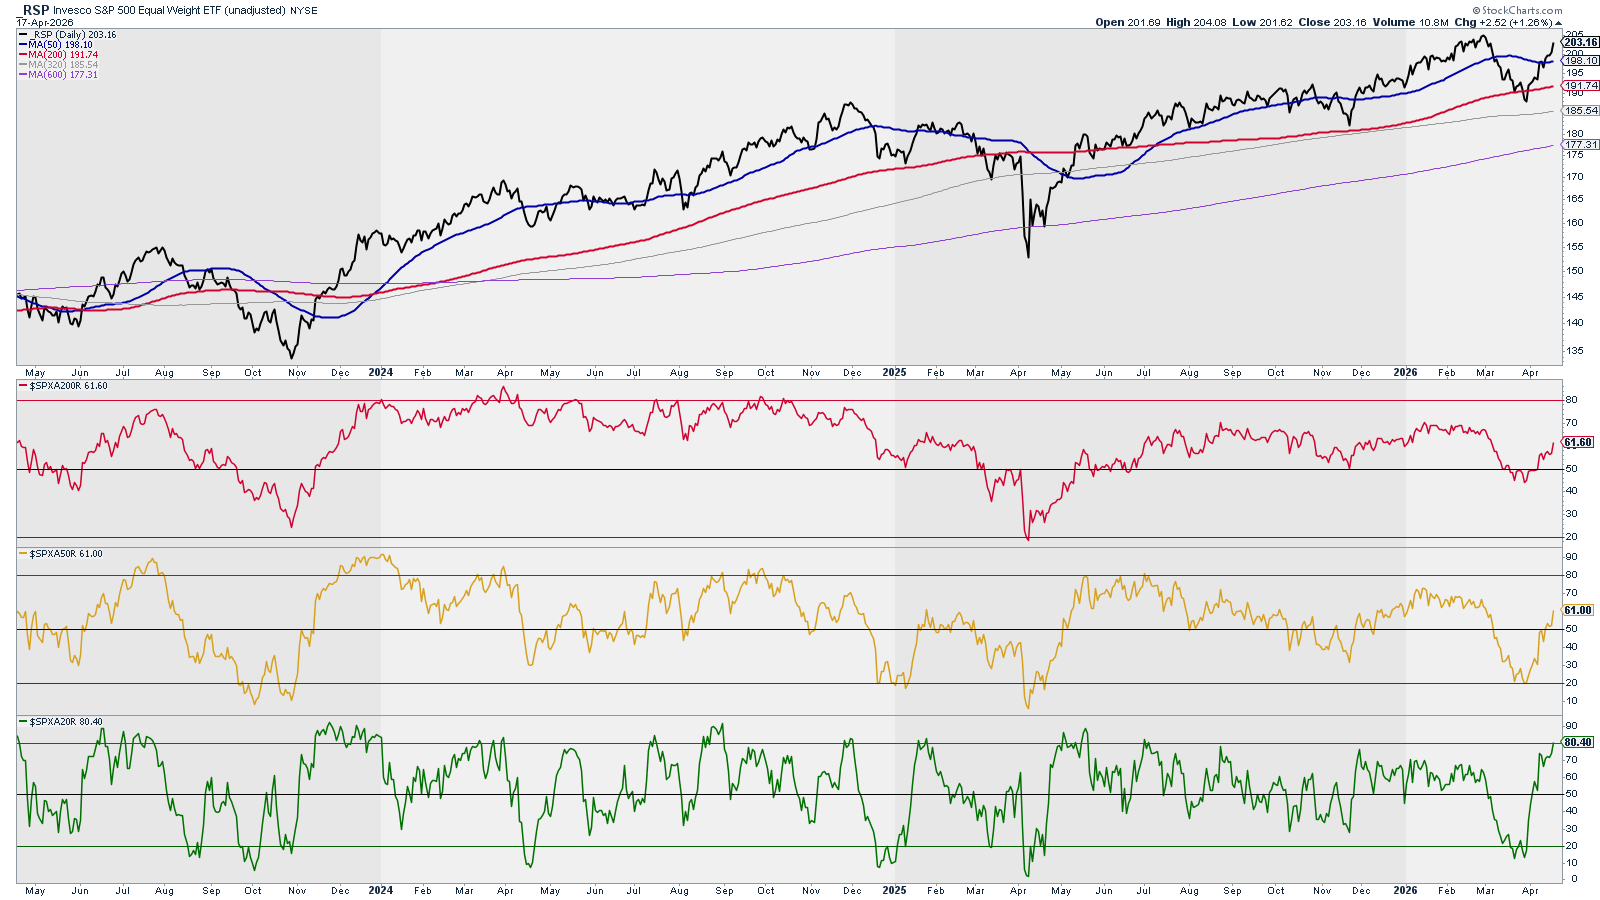
Analysis: A deeper look on the percentage of stocks above their 20D and 50D SMAs shows that there is still room for more bullish action (as per the 50D). Some choppiness, or side movement, could come from the 20D, but nothing long lived.
Outlook: Bullish
Breadth & Volatility: Bullish Pct. Index & McClellan Summation Index
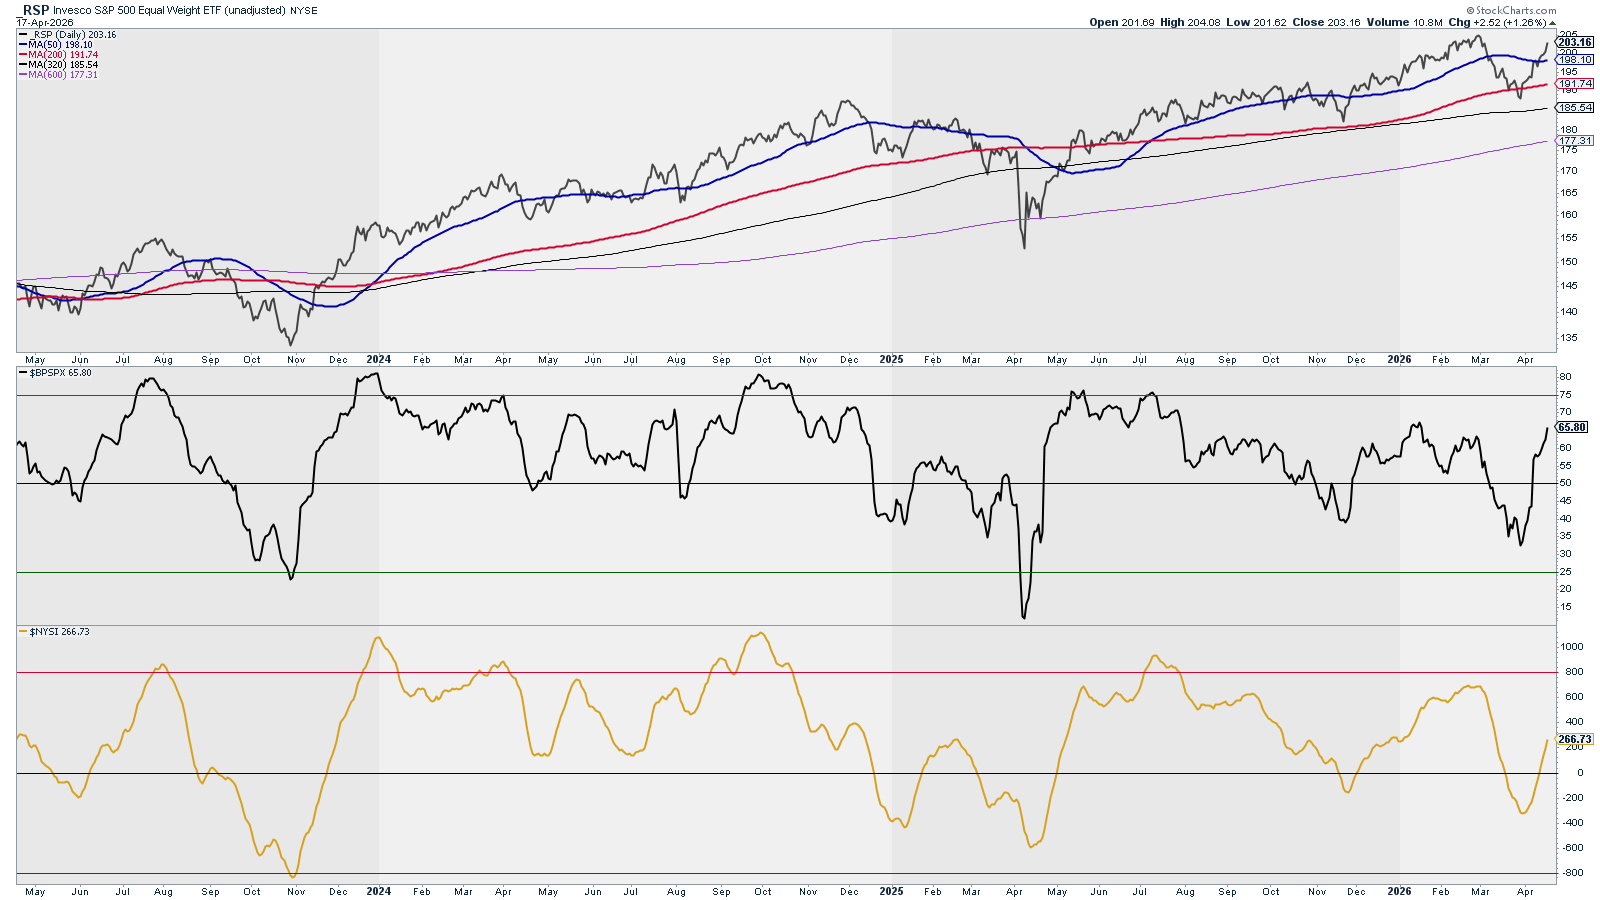
Analysis: Both signals in synch with market action and far away from any overbought or oversold area.
Outlook: Bullish
Breadth & Volatility: Ratio Low Volatility Stocks / SPY vs. SPY and RSP
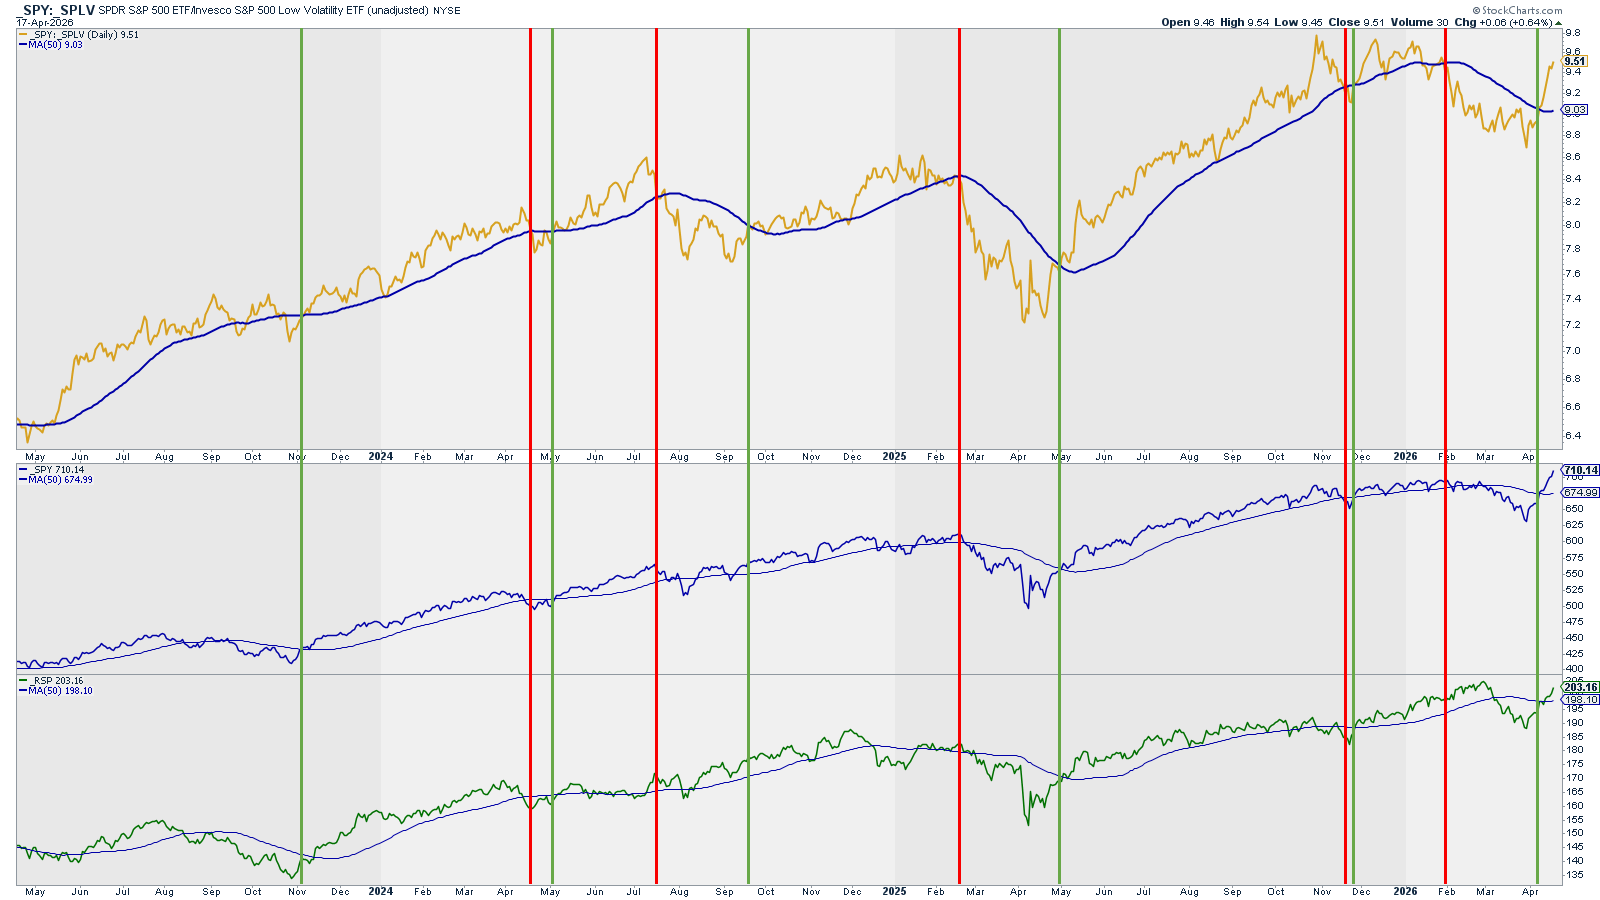
Analysis: Last week the bullish signal triggered and it did not fail. This is one of the most reliable signals.
Outlook: Bullish
Breadth & Volatility: New Highs vs. SPY & RSP
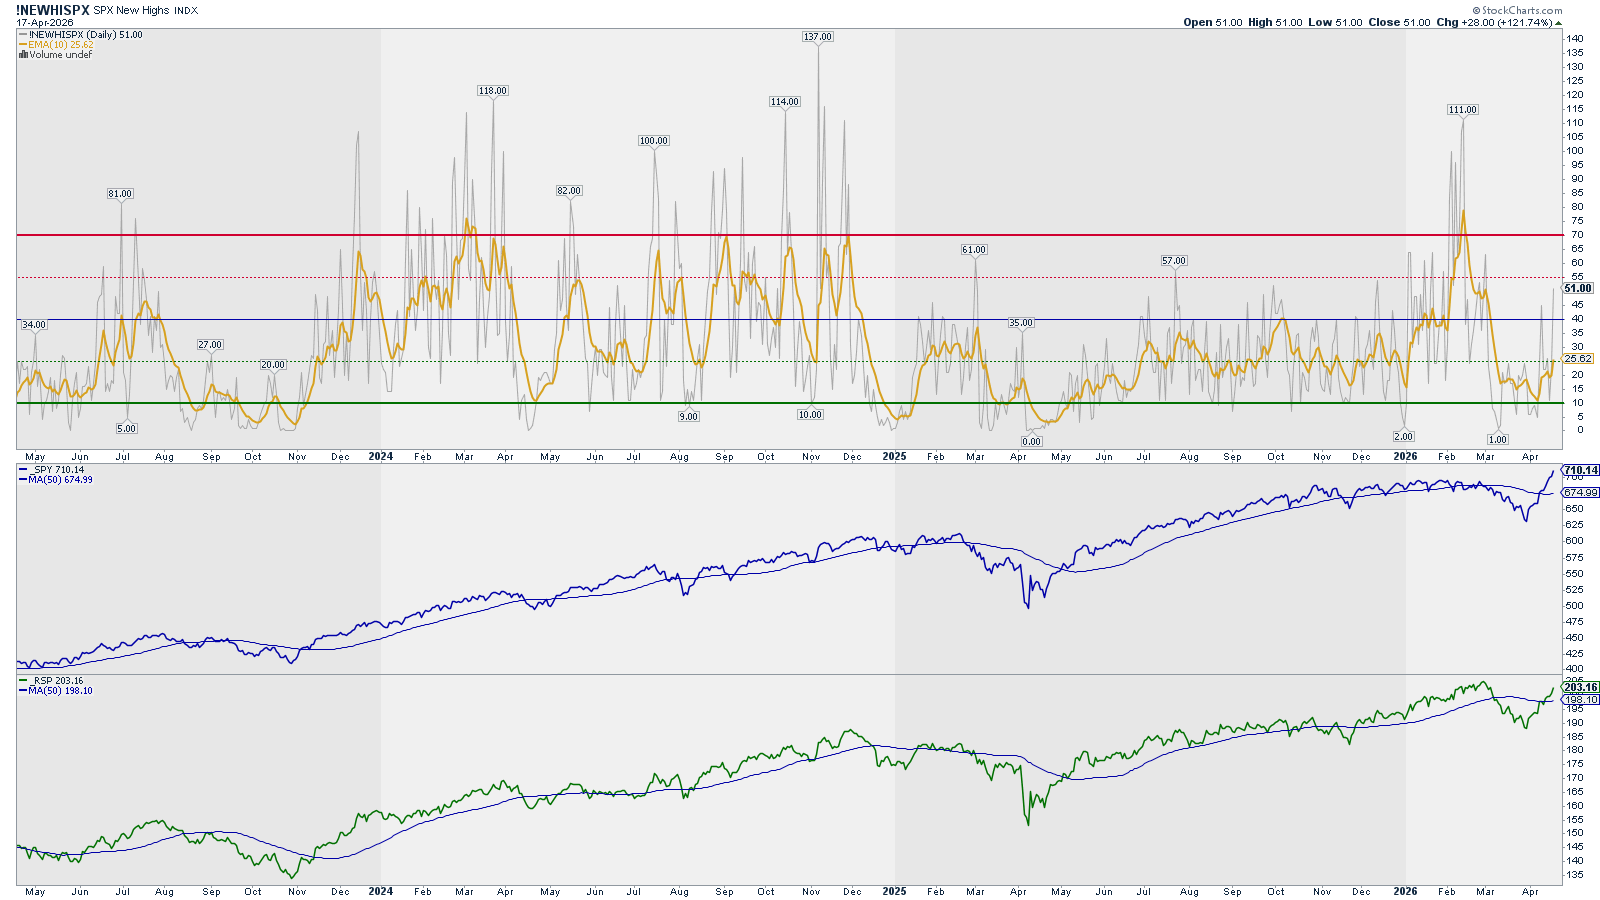
Analysis: Another reliable signal. The market stops going down (or up) when there is nothing left to sell (or to buy) - at least in the short to medium term.
Outlook: Bullish
Breadth & Volatility: VIX vs. SPY & RSP
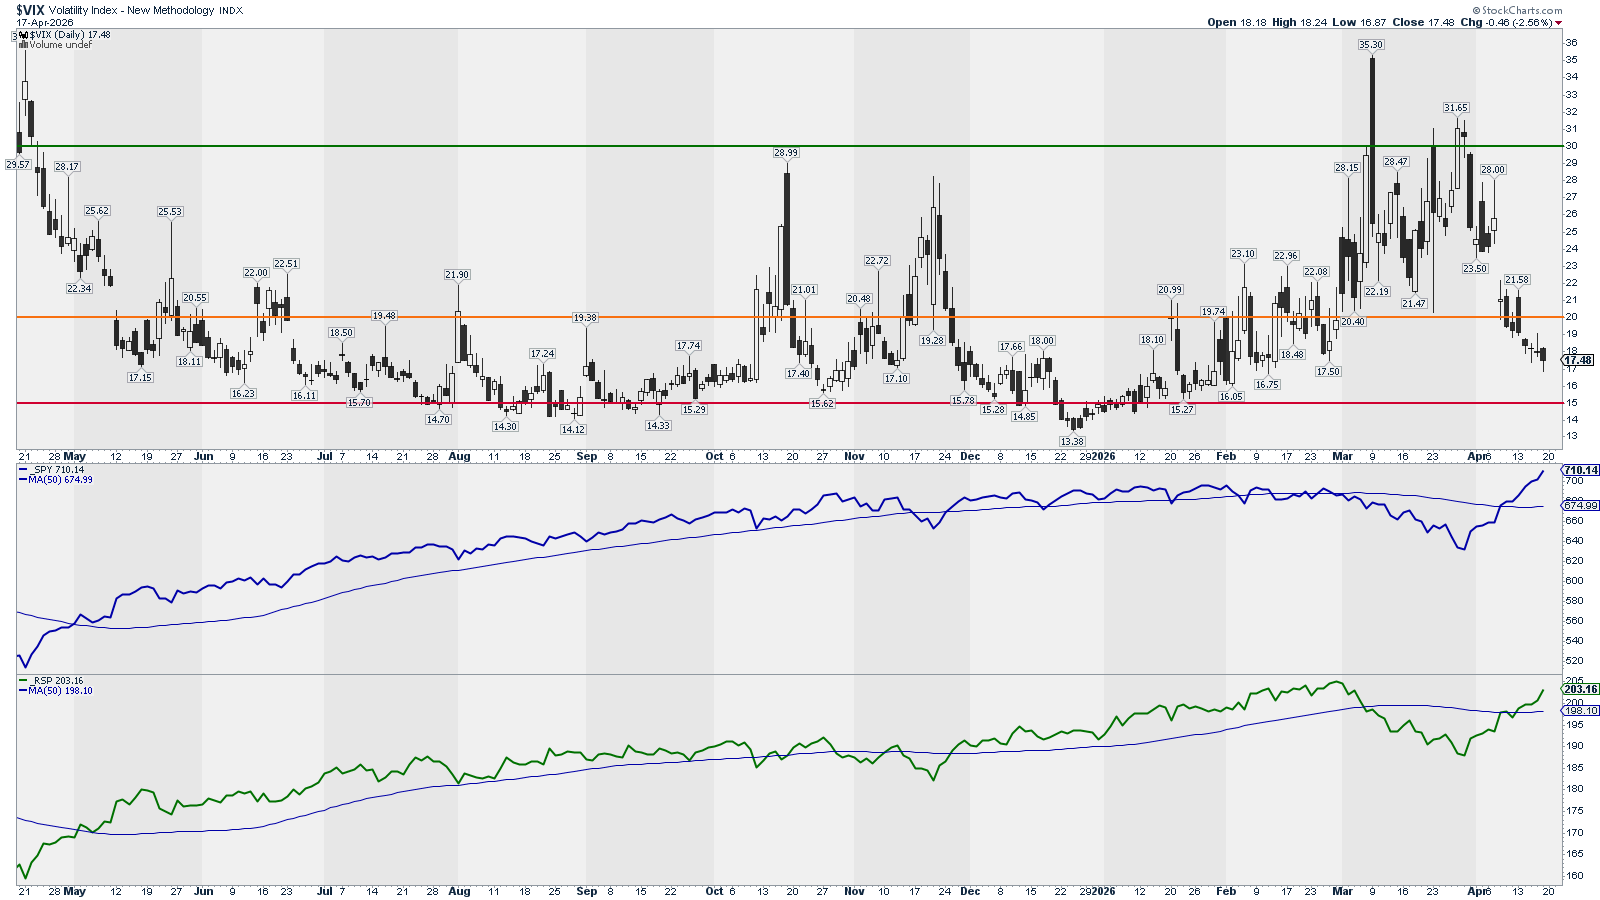
This chart is mainly to detect market bottoms.
Analysis: The trend has changed. The volatility has dropped below 20. This normally is good for the market.
Outlook: Expect normal volatility
Options: (Inverted) Put/Call Ratio vs. SPY
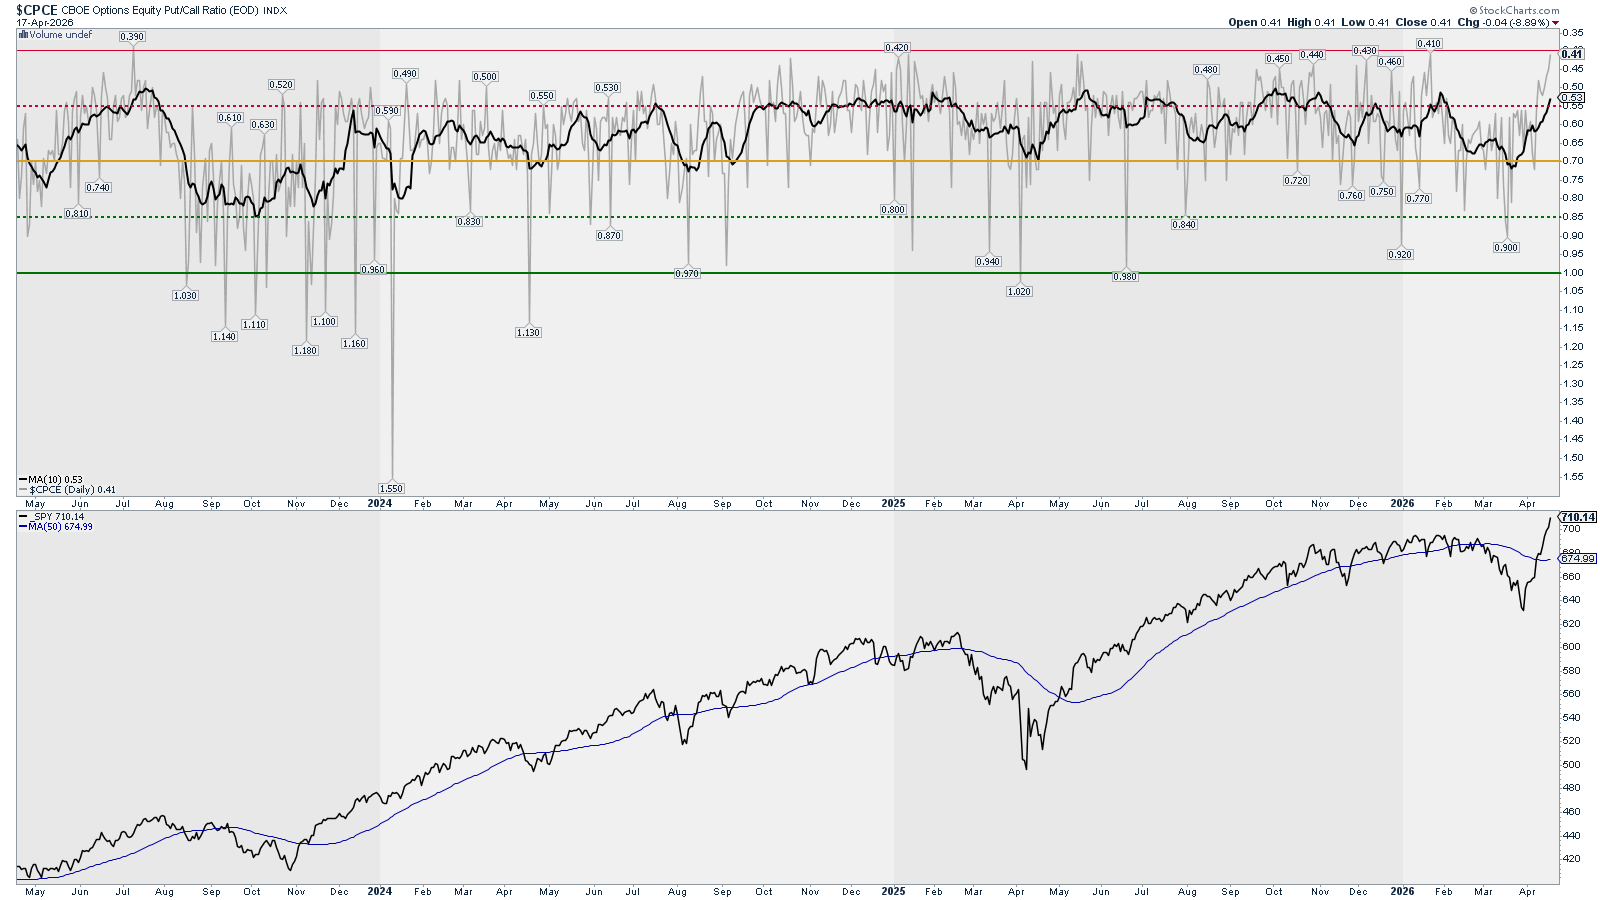
Analysis: Last week, the options market told us above this week’s rally. Now, we see the market getting overstretched. We could see a local top and the market rally halting for a while.
Outlook: Bullish to Neutral
Options: Gamma Exposure – SPX
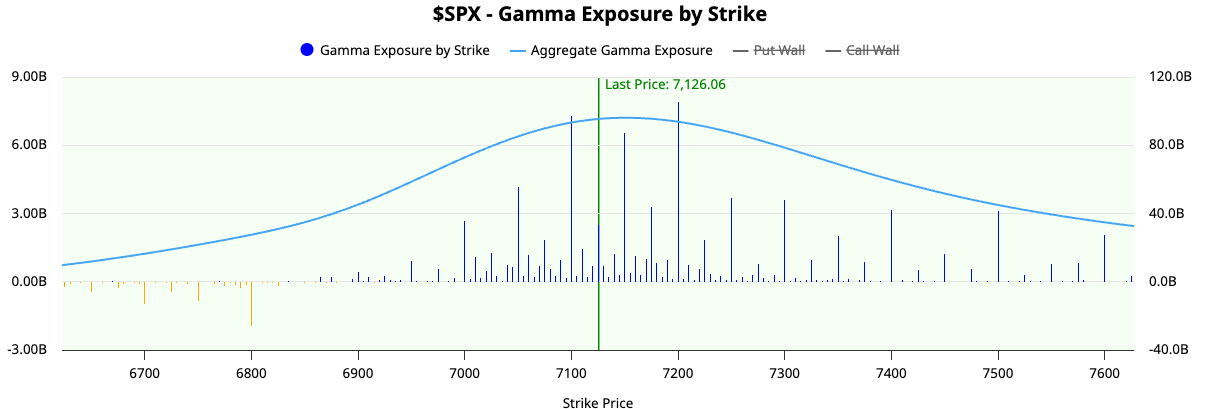
Analysis: Very positive Gamma with key level at 7,100 and 7,200. The Gamma tail is positive.
Outlook: Bullish
Level 2: What is happening? Summary
Price Action: Neutral to Bullish
Breadth & Volatility: Bullish
Options: Bullish to Neutral
Where is it happening? – Level 3
Bulls vs. Bears: RSP vs. RSPD (Cons. Disc. – Bulls) and RSPS (Cons. Sta. – Bears)
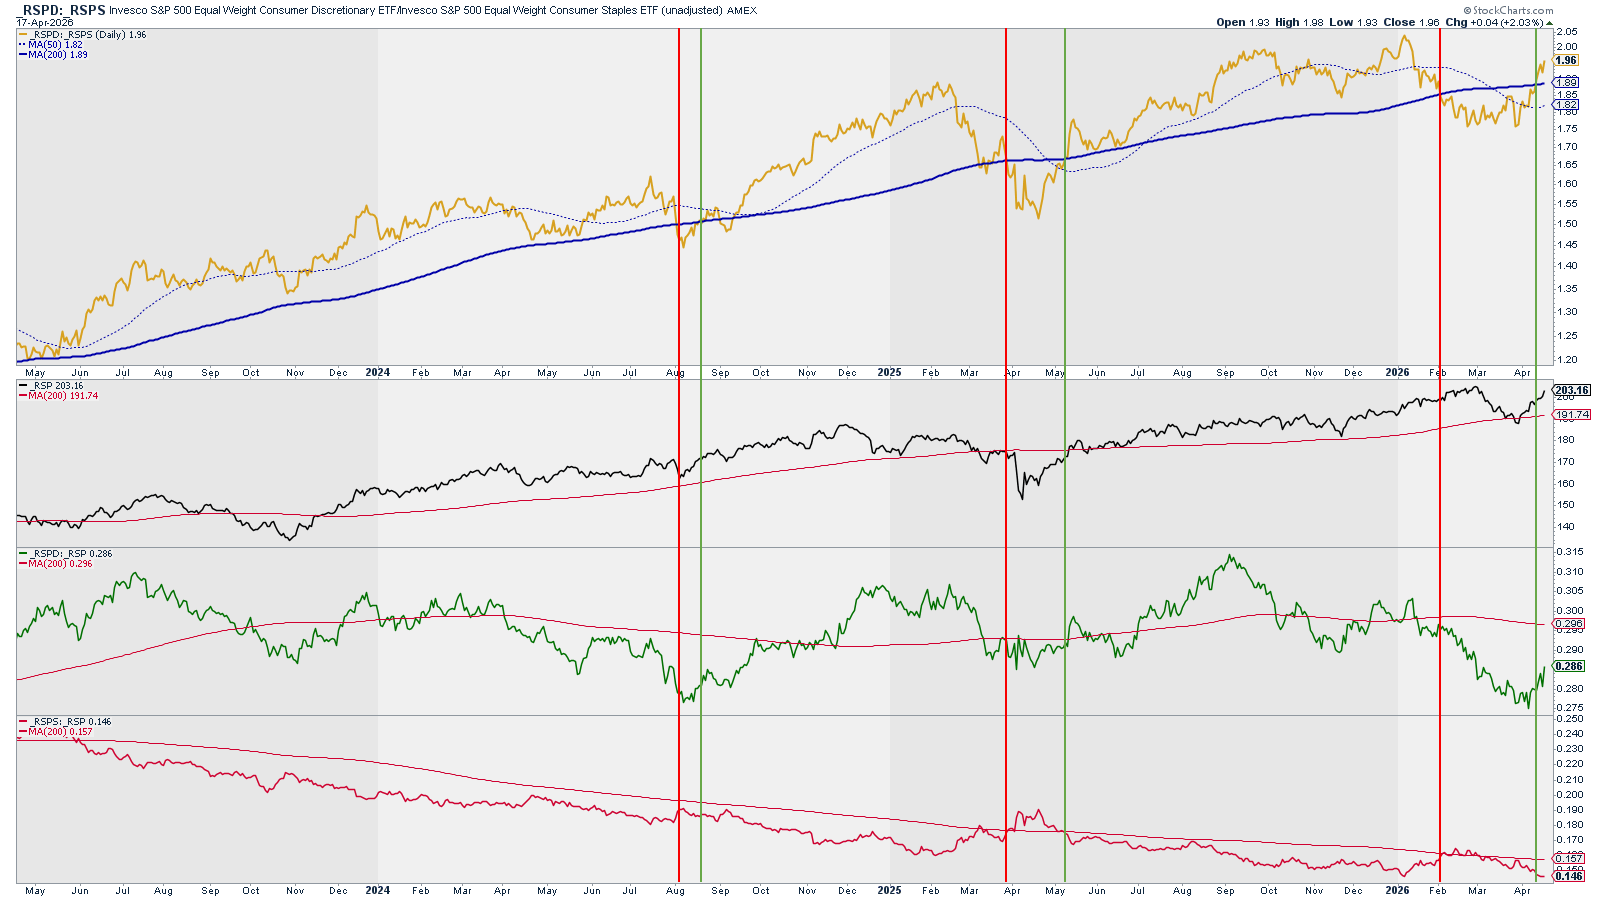
Analysis: Bullish signal (yellow) triggered. Bulls (green) are still weak but getting stronger.
Outlook: Bullish
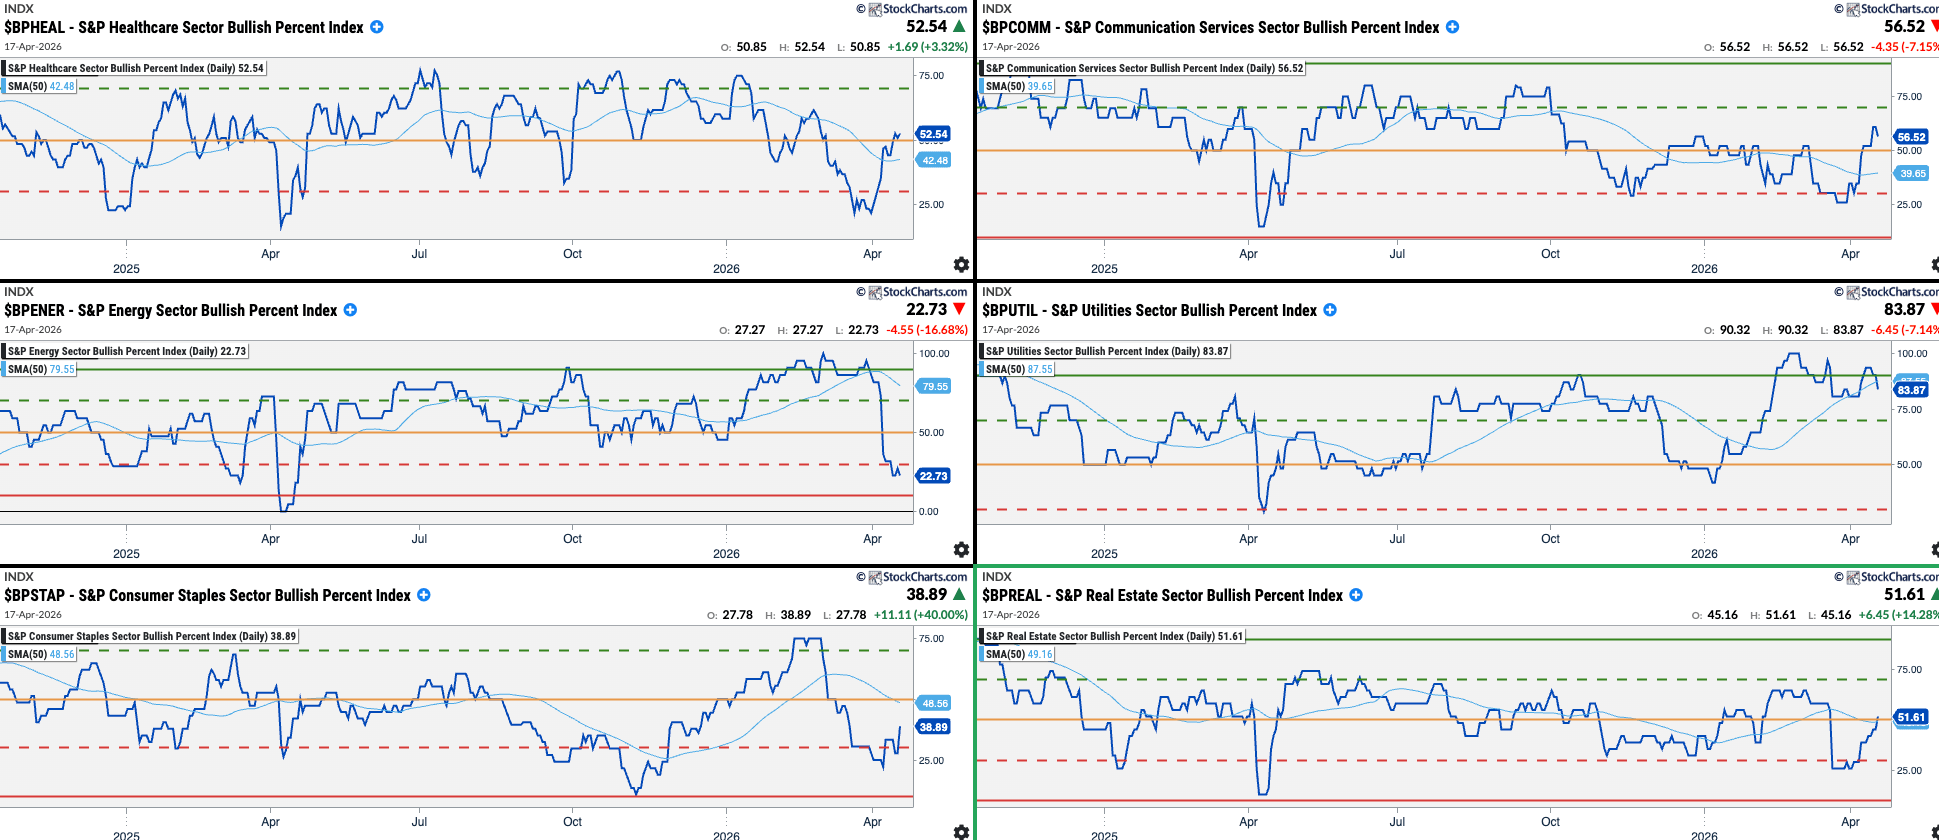
Sectors Rotation: Sectors Bullish Percent Index
Growth Sectors:
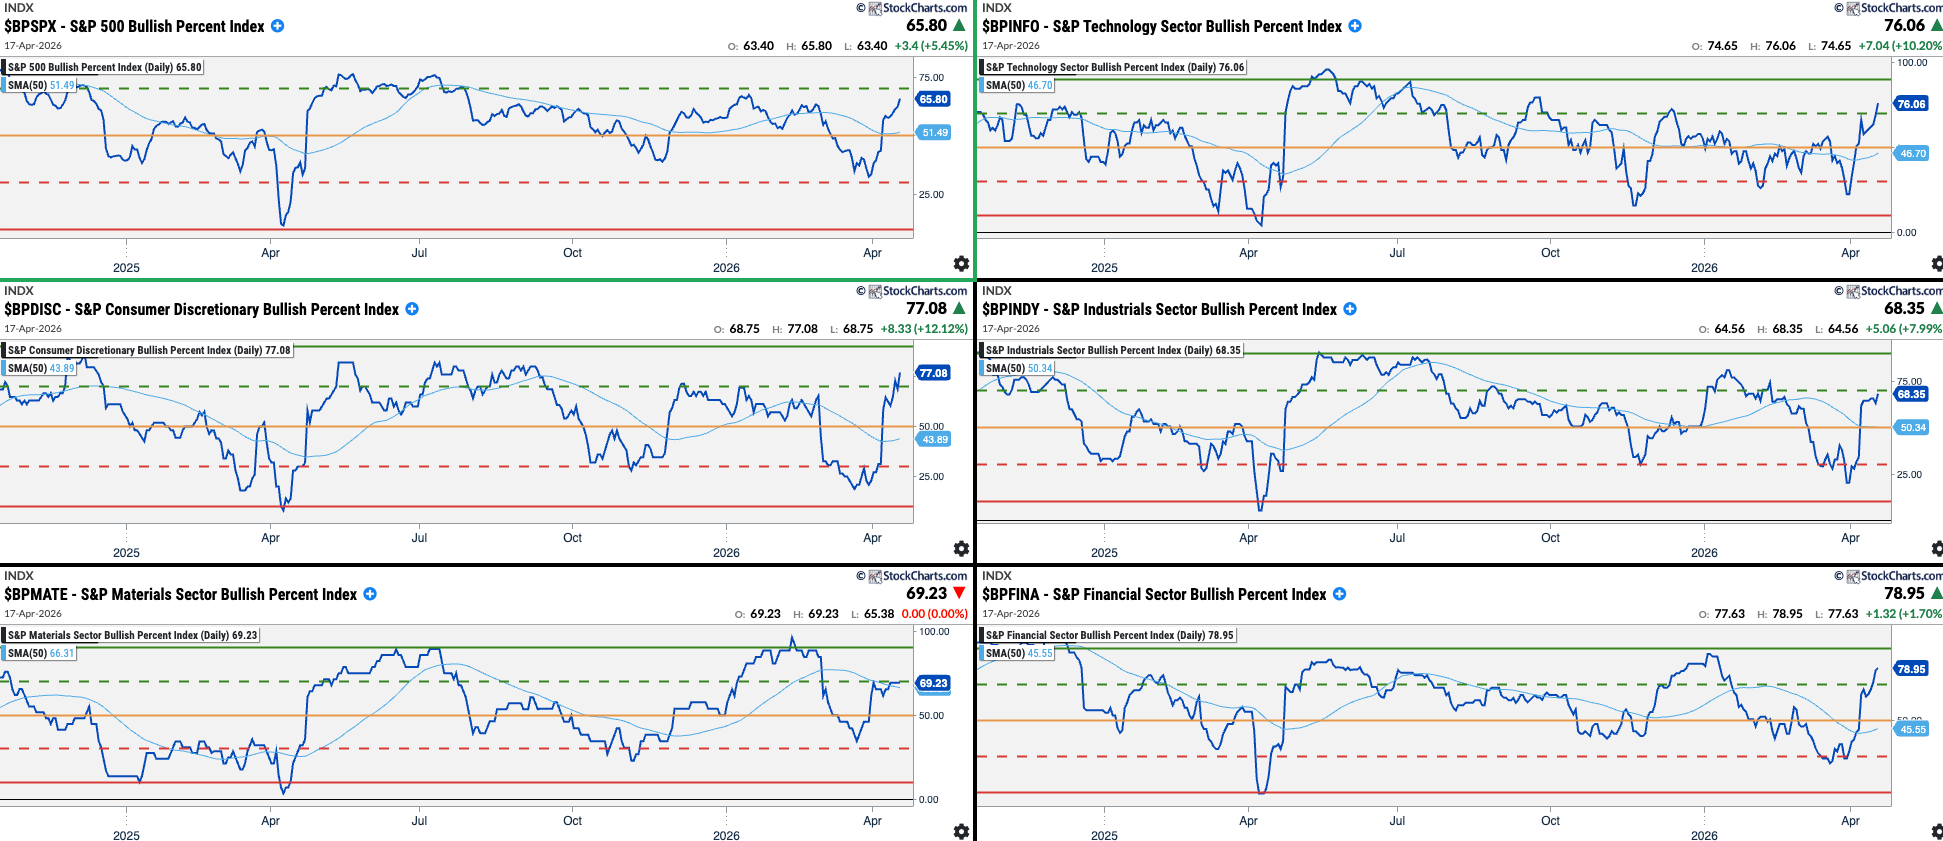
Value Sectors:
US Sectors order by ISM PMI Correlation (between parenthesis)
Growth Sectors - shall outperform when the market is bullish:
XLK: Technology (71%)
XLY: Cons. Discretionary (67%)
XLI: Industrials (66%)
XLB: Basic Materials (66%)
XLF: Financials (59%)
Value Sectors - shall outperform when the market is bearish:
XLV: Healthcare (55%)
XLC: Communications (49%)
XLE: Energy (44%)
XLU: Utilities (35%)
XLP: Cons. Staples (30%)
XLRE: Real Estate (16%)
Analysis:
Any sectors below their red levels are good opportunities to find great companies at good valuations or buy sector ETFs (buy cheap). Those sectors above their Green levels are candidates to be sold (sell expensive).
Buy Opportunities:
- XLRE has increased 10% in the last two weeks and yet the Bullish Percent Index is just getting above 50%. Is the market telling us that there are good opportunities in Real Estate?
- All growth sectors
Sell Opportunities: XLE and XLU
Market & Economy Rotation
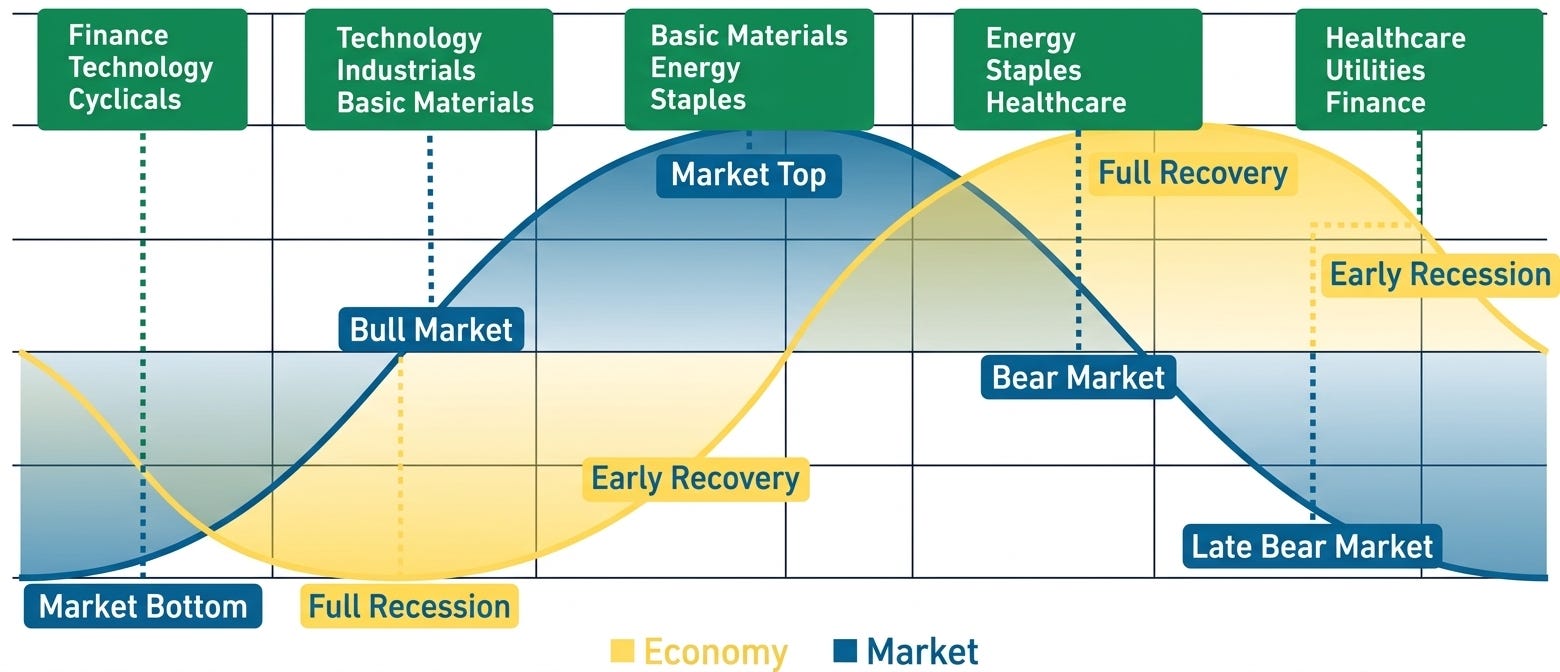
Analysis:
With a market moving at this speed is difficult to decide in which moment of the cycle we are. We know that the economy is improving from lower levels, so we could consider it “Early Recovery”. The market, after the noise brought by the Iran war, is signalling towards a Bull Market as we shall see Technology and Industrials leading.
Level 3: Where is it happening? Summary
Bulls vs. Bears: Bullish
Market & Economy Rotation: Bull Market
All Levels Summary and Final Thoughts
Level 1 Summary
Economic Data (long-term): Bullish to Neutral
USD & Interest Rates: Neutral
Investors Sentiment: Bullish
Level 2 Summary
Price Action: Neutral to Bullish
Breadth & Volatility: Bullish
Options: Bullish to Neutral
Level 3 Summary
Bulls vs. Bears: Bullish
Market & Economy Rotation: Bull Market
Final Thoughts
Dominant Narrative: Iran’s war peace negotiations
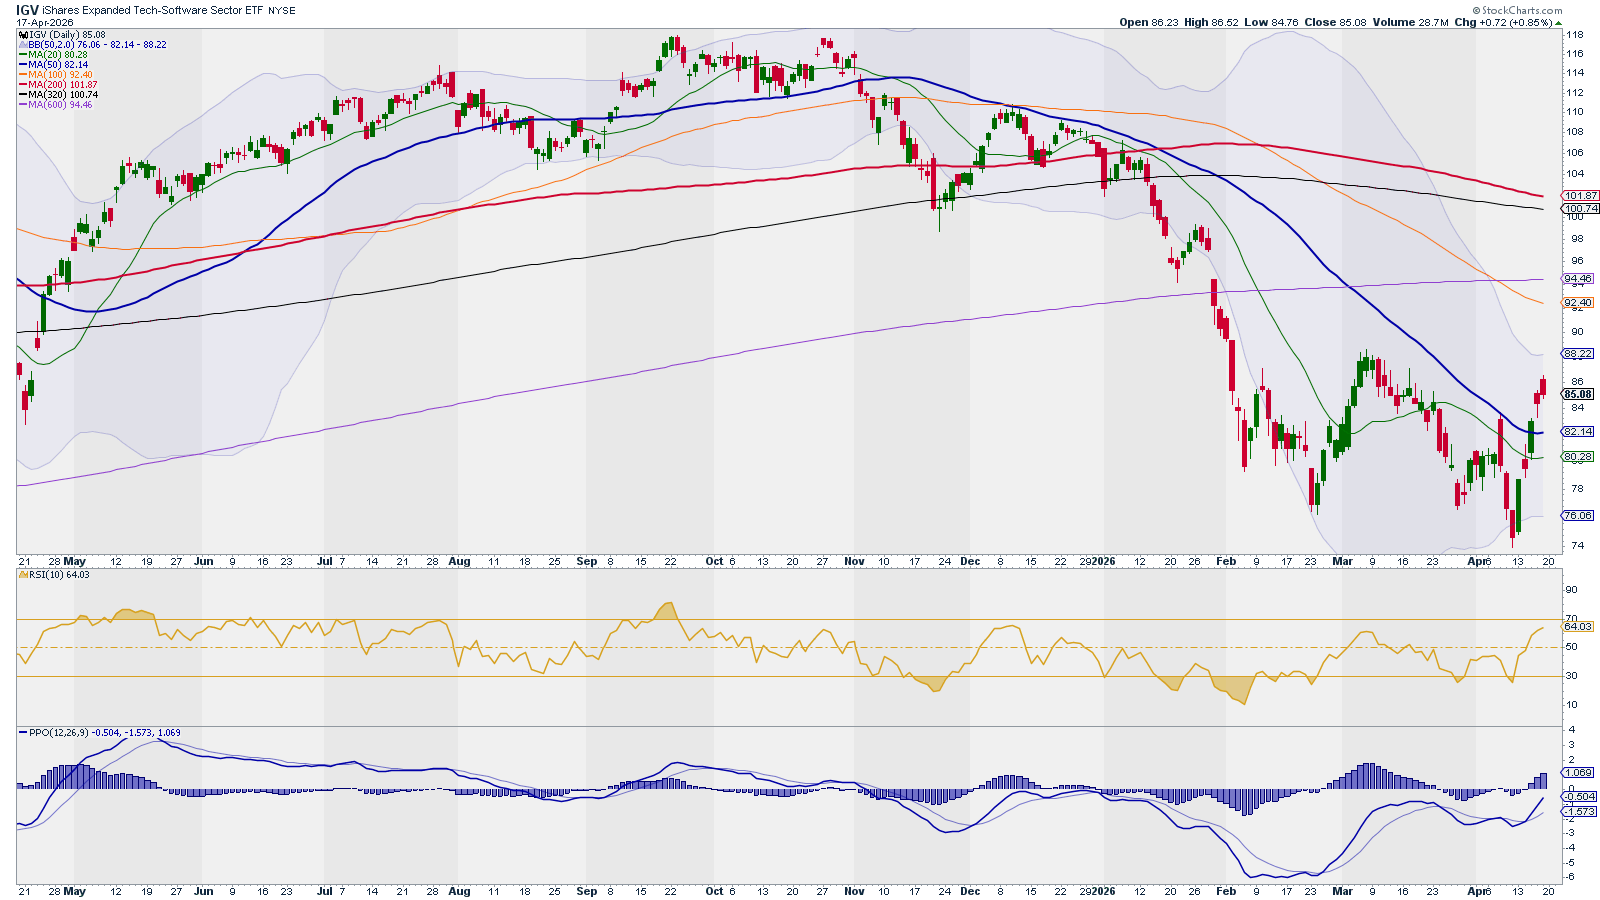
Who would have said? A couple of weeks the world was about to end. No oil. Economic crisis. Chaos and war. Last Friday… All time highs! Technology is back, cyclicals are back, banks reported great earnings, and even software is rallying!
Will this last? The market seems to say yes. Will geopolitics behave and let us all enjoy a healthy bull market? Time will tell…
Disclaimer: The content on AMAT Investing is strictly for educational and learning purposes. The author is not a licensed financial advisor and holds no formal financial education. This post does not constitute professional financial advice. All investing involves risk of loss. Always conduct your own research and consult a licensed professional before making any investment decisions.