

Weekly Review - 2026-Apr-10
Is the bull back?

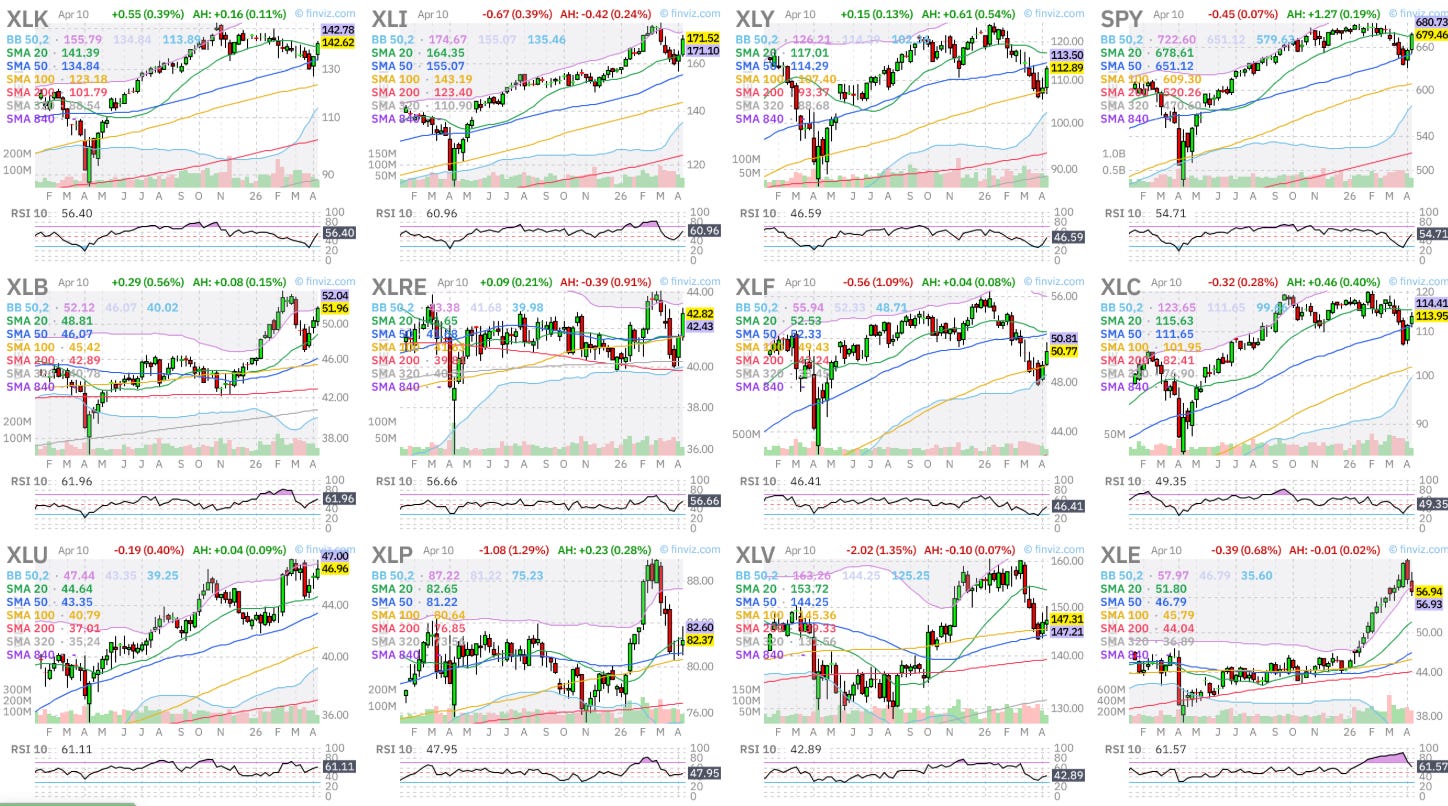
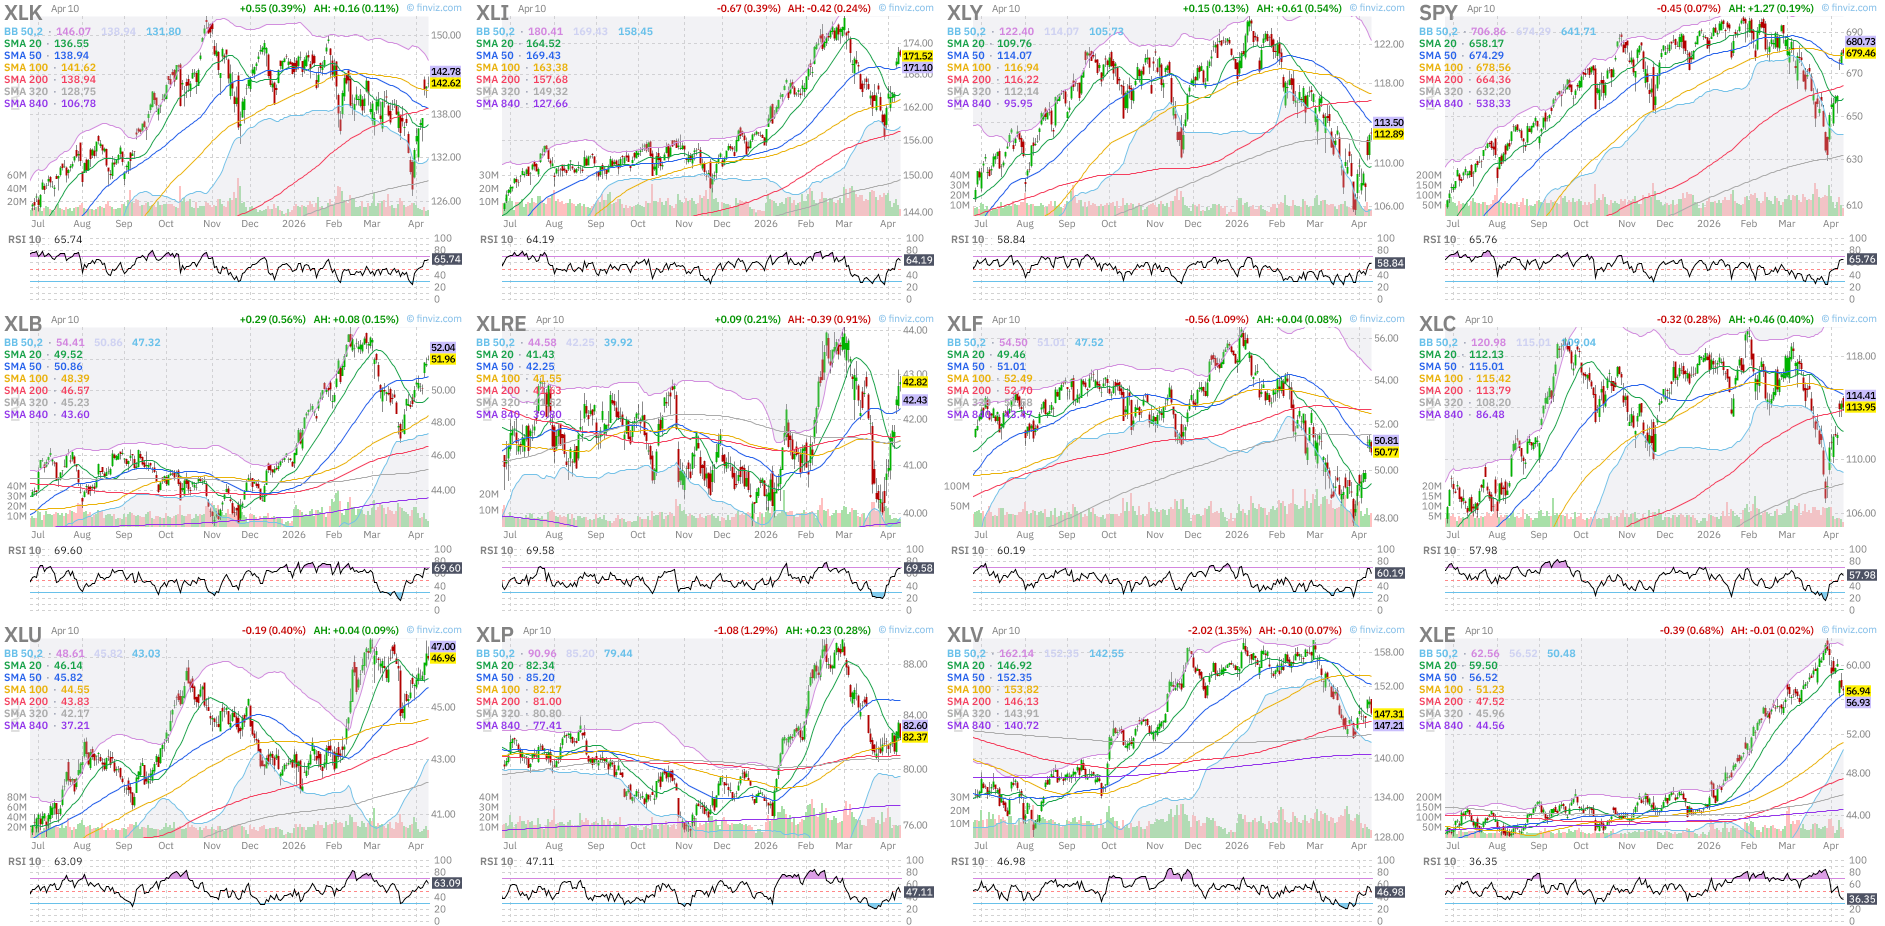
US Cap. Weighted Sectors ordered by weekly performance (desc):
Weekly:
Daily:
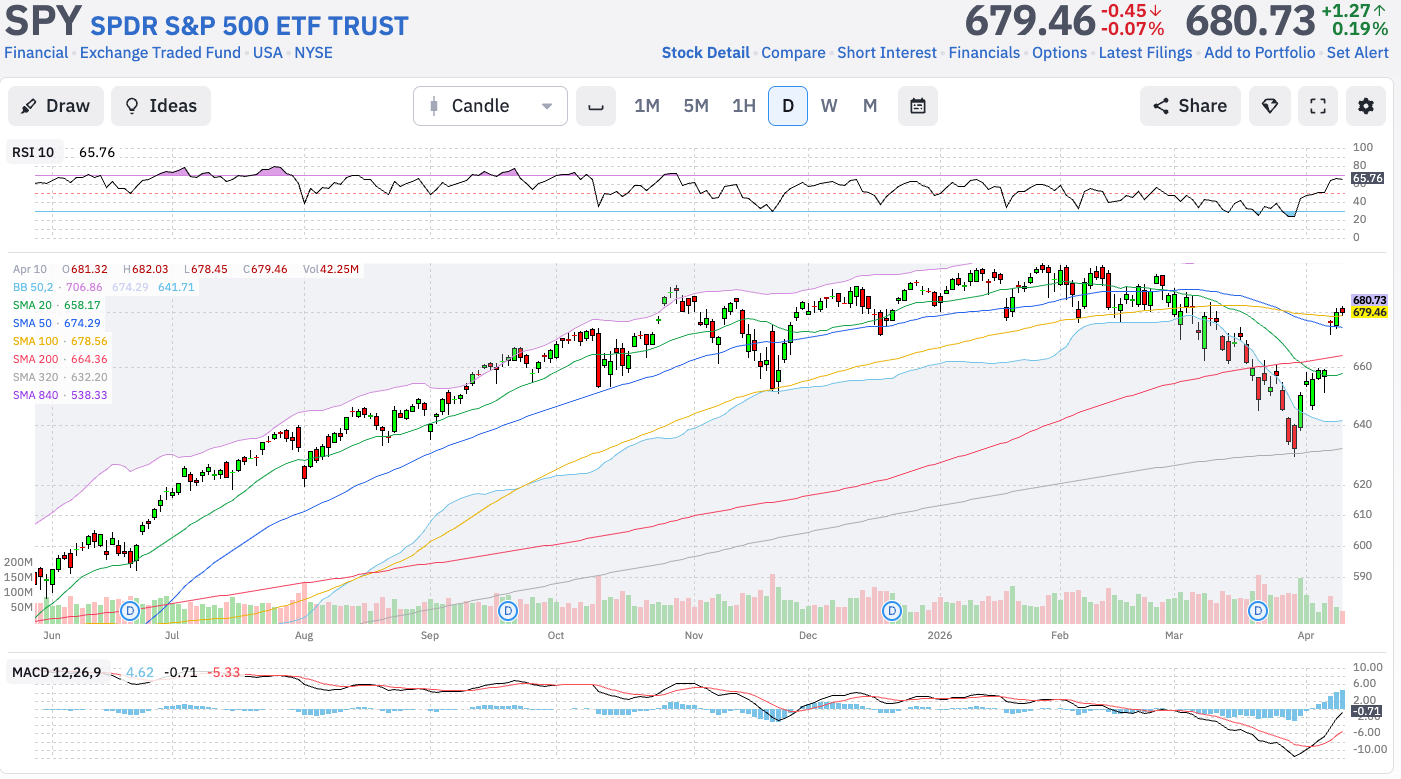
Comment: The S&P found support at the daily SMA the 320 and rallied since then driven by the geopolitical news of a possible Iran-war resolution. Price has crossed all the daily SMAs that we follow: 200, 100, 50, and 20, closing on Friday at what it seems the daily SMA 100 support.
Why is it happening? – Level 1
Economic Data: Production: ISM PMI vs. SPX
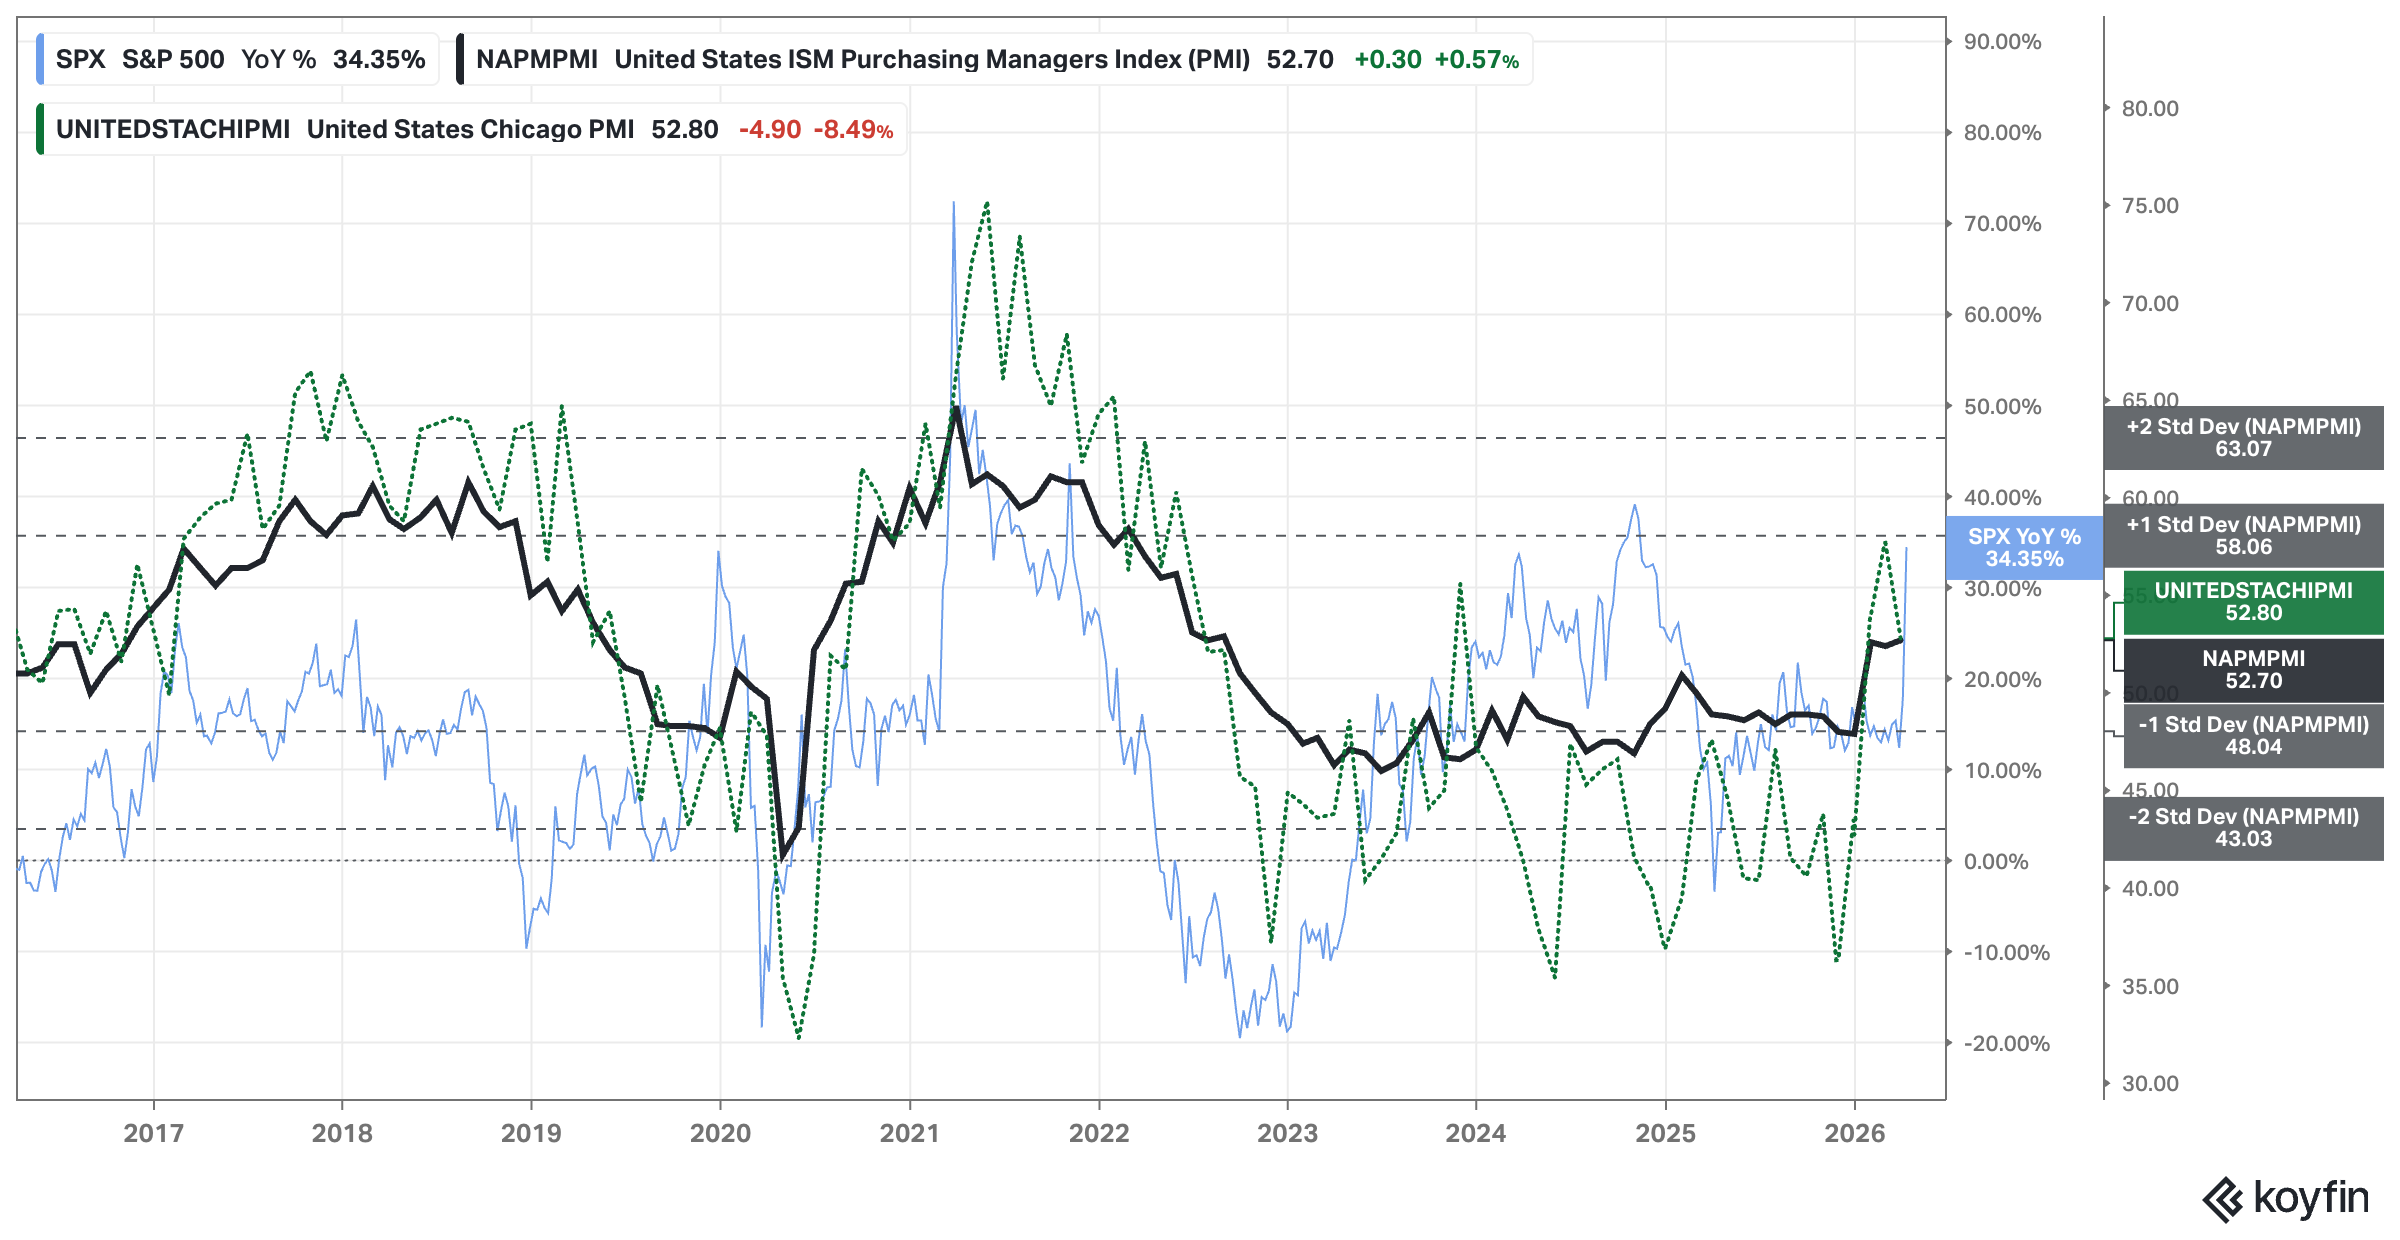
Analysis: No changes since last week.
Outlook: Bullish
Why is it happening? – Level 1
Economic Data: Production: Dallas & Philadelphia Manufacturing vs. SPX
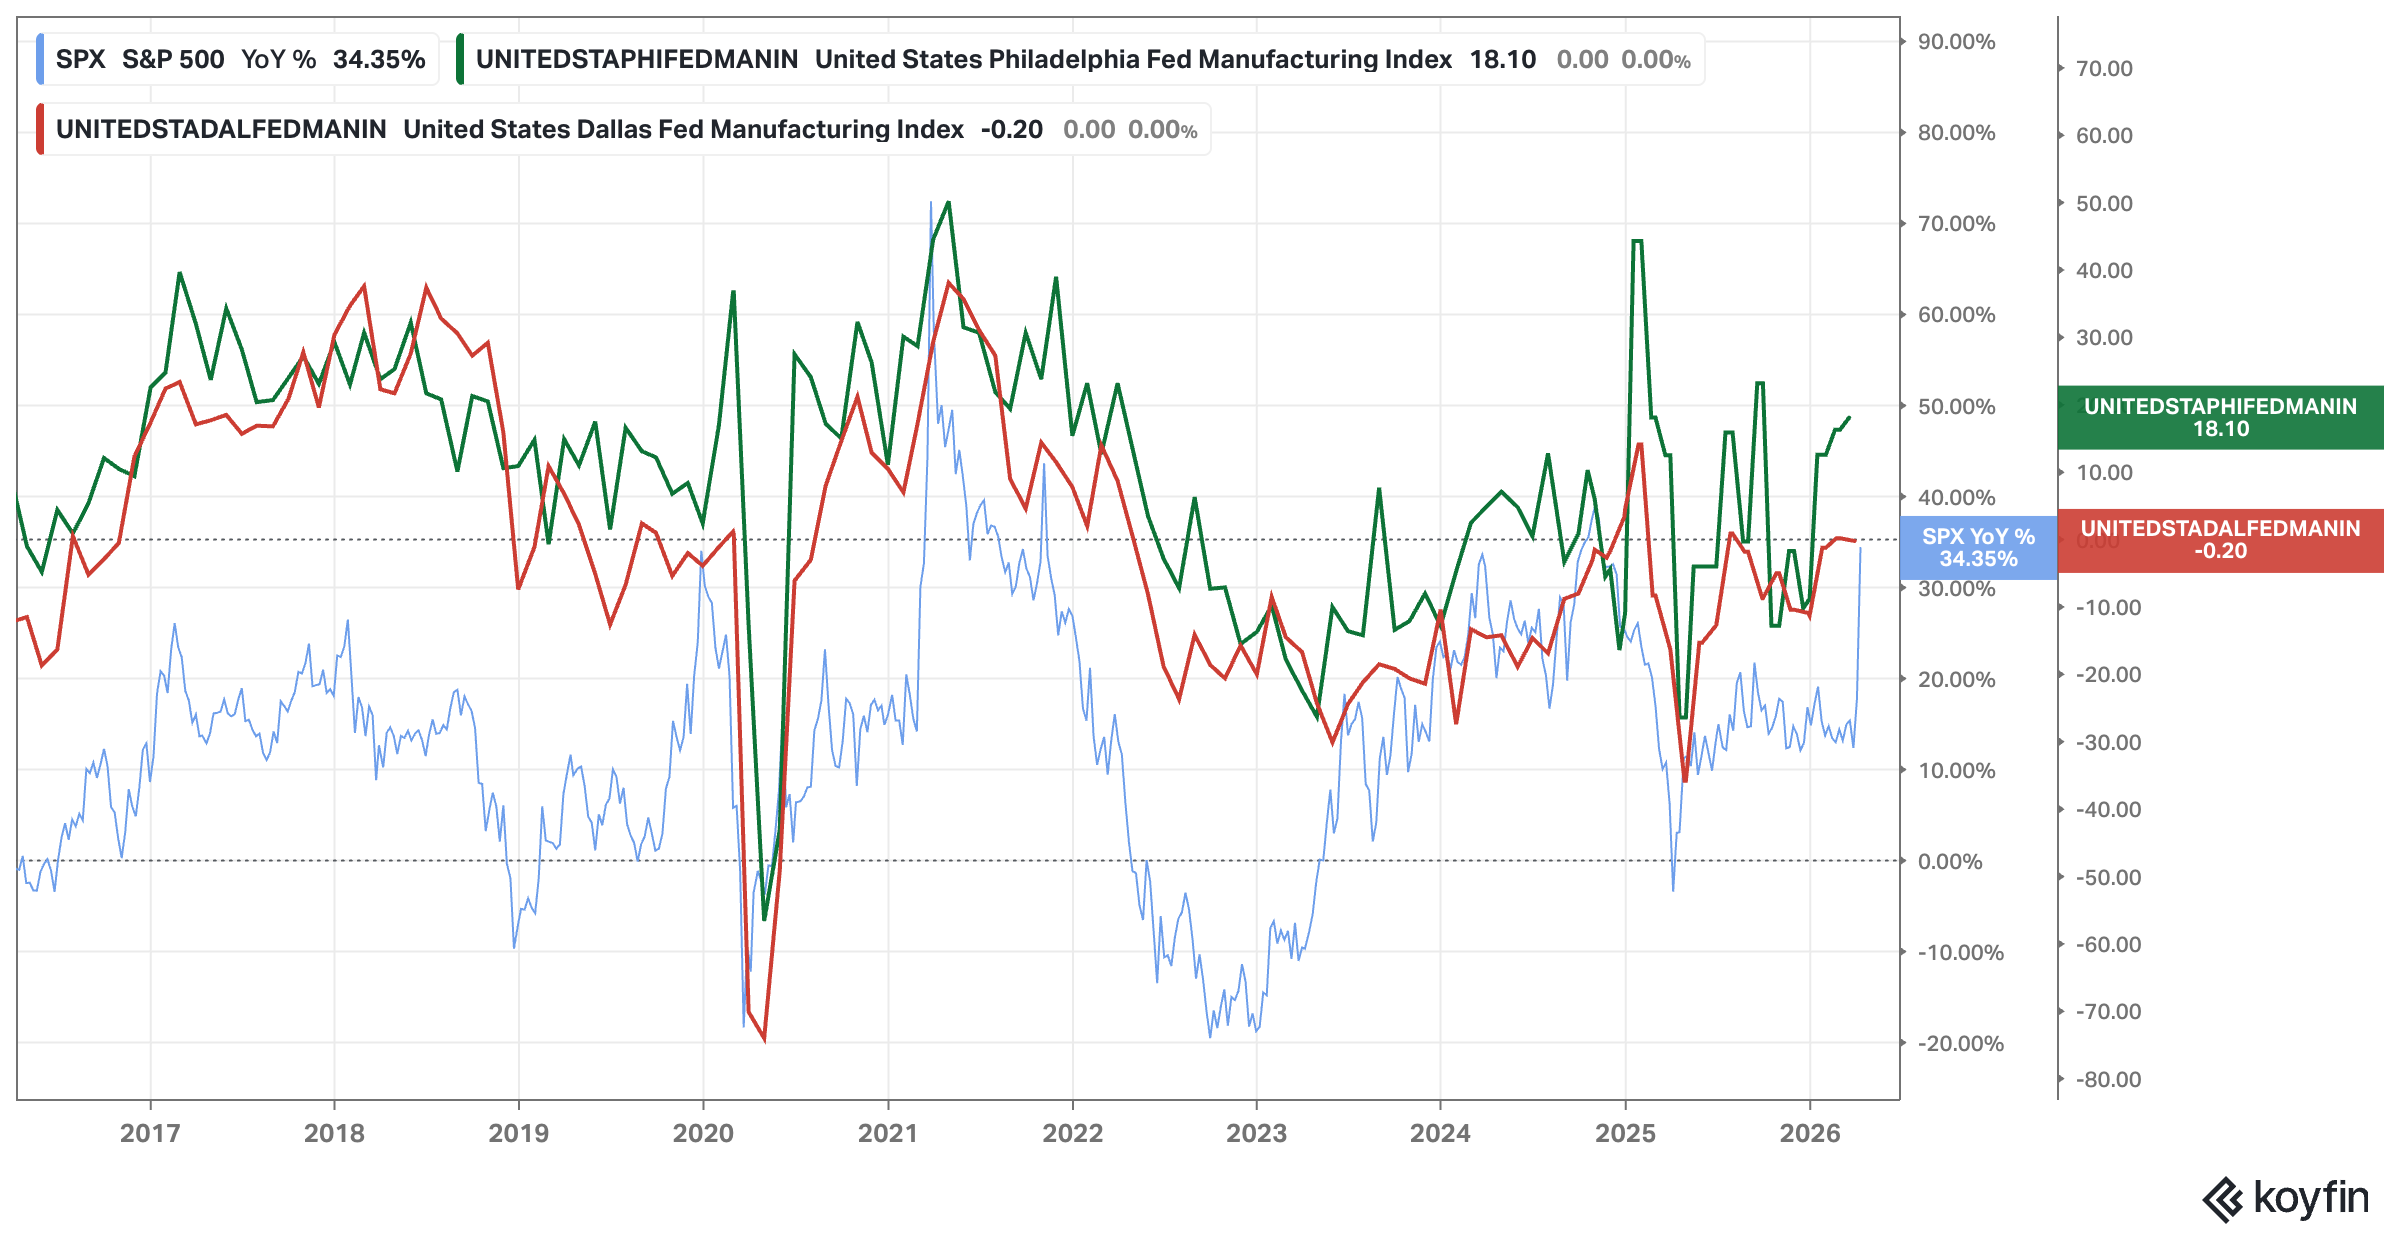
Analysis: No changes since last week.
Outlook: Bullish
Why is it happening? – Level 1
Economic Data: Consumption: Consumer Sentiment
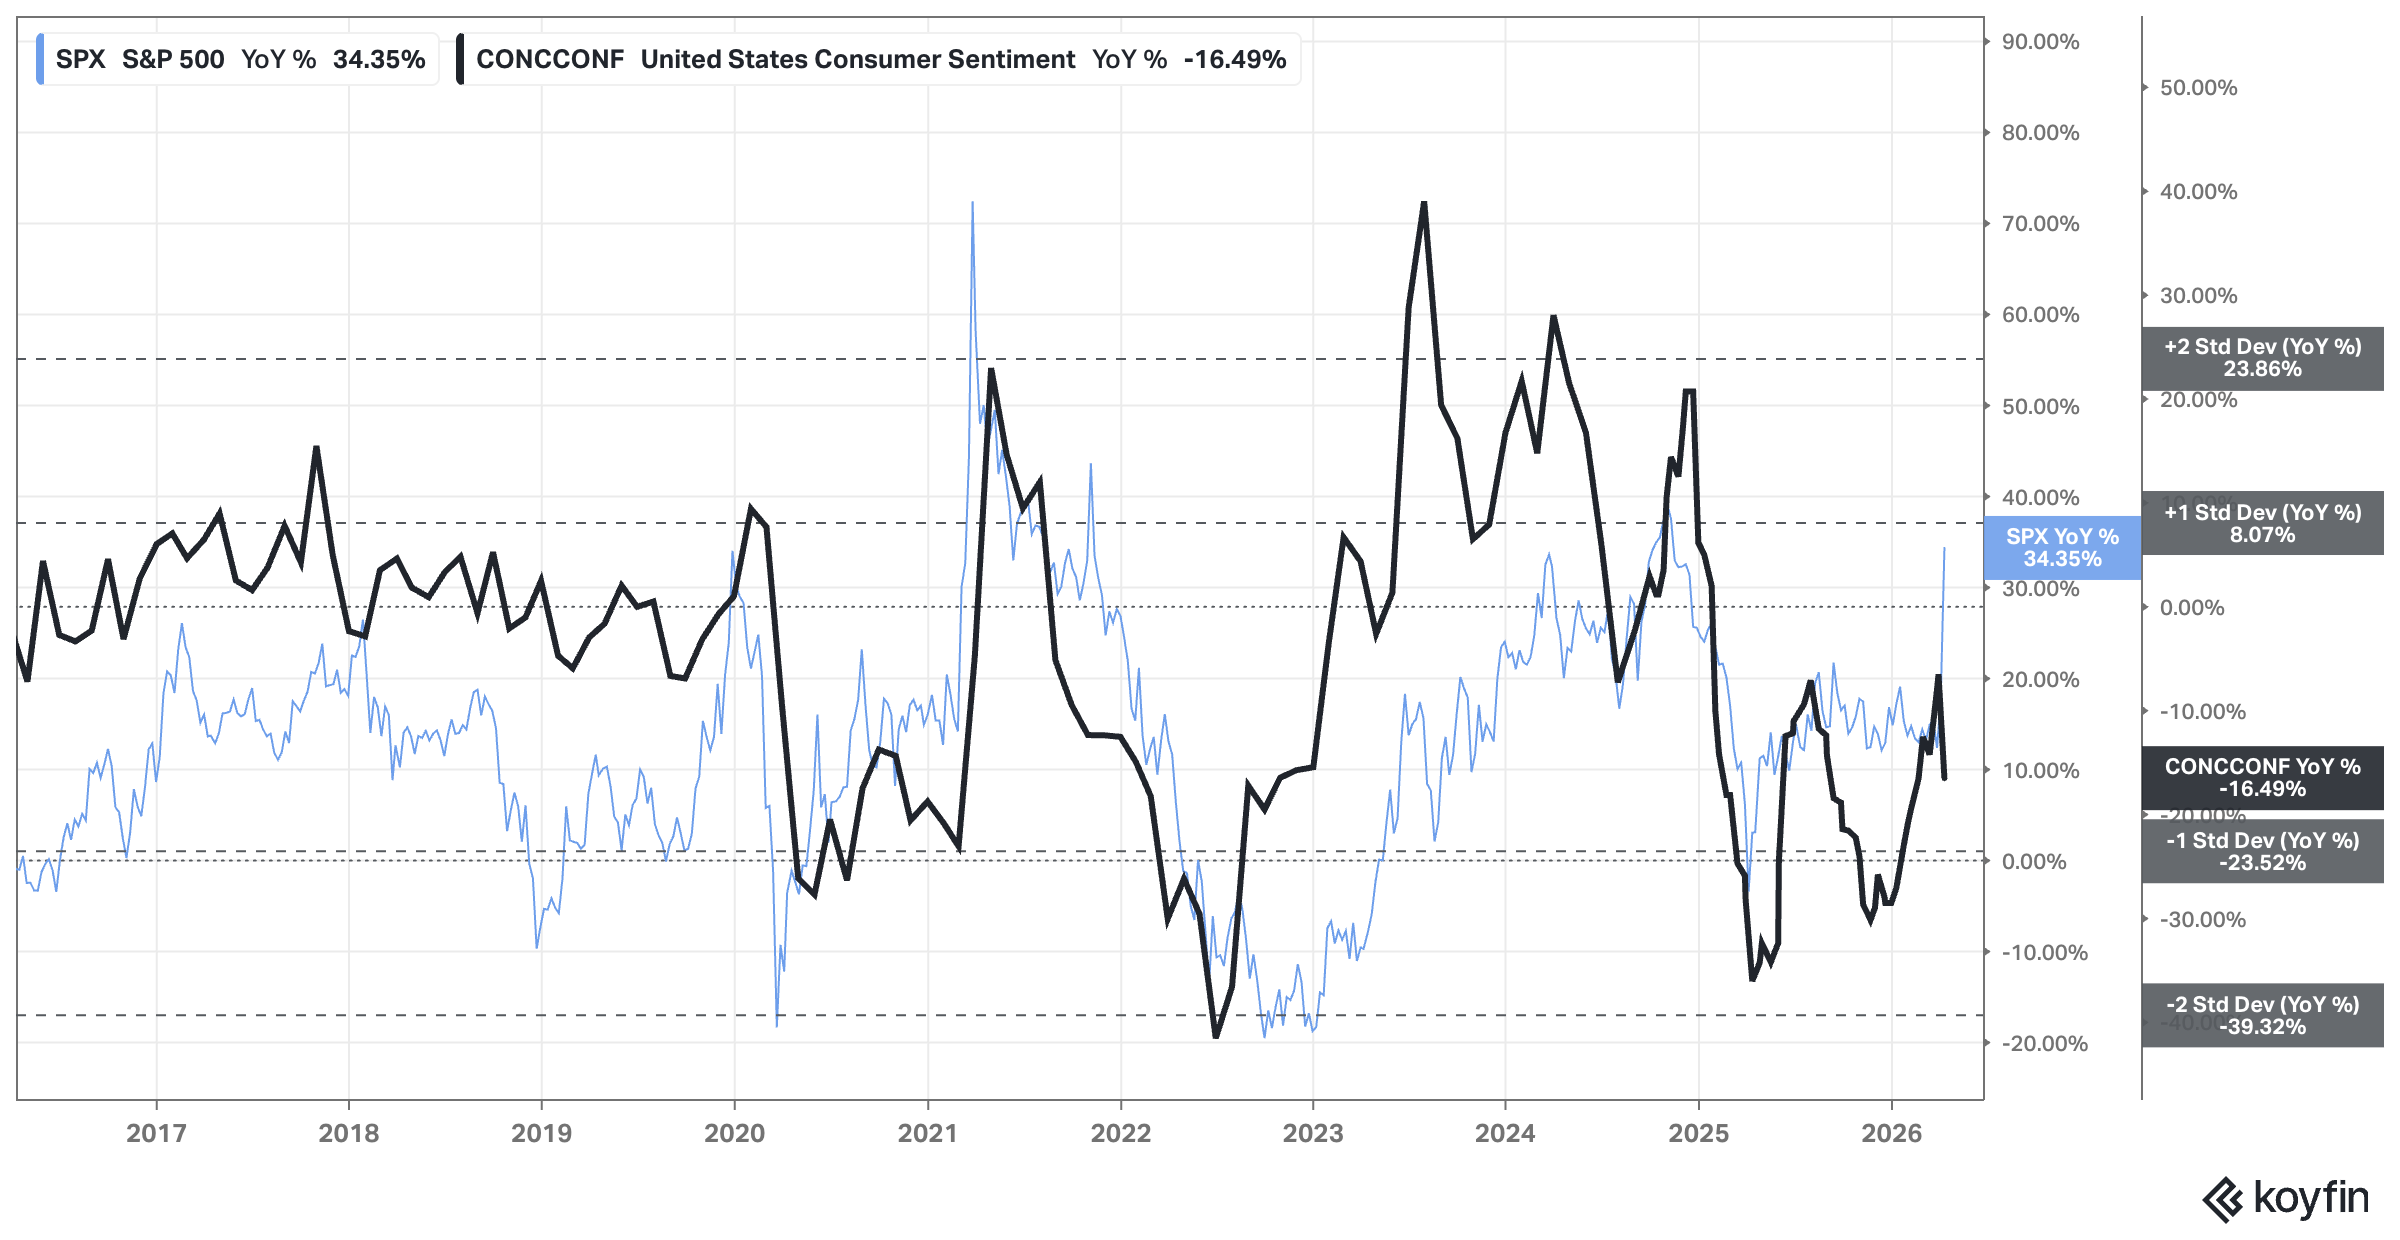
Analysis: The sentiment has deteriorated. Iran-war and the repercussions on gasoline price and overall fear of higher inflation have contributed to lower consumers’ optimism. We remain bullish as the Iran-war impact will be temporary and the sentiment was already quite low compared to previous readings (the consumer shall become more enthusiastic in the near future than the opposite).
Outlook: Bullish
Why is it happening? – Level 1
USD & Interest Rates: FED, 2yr, 10yr, and 30yr Rates
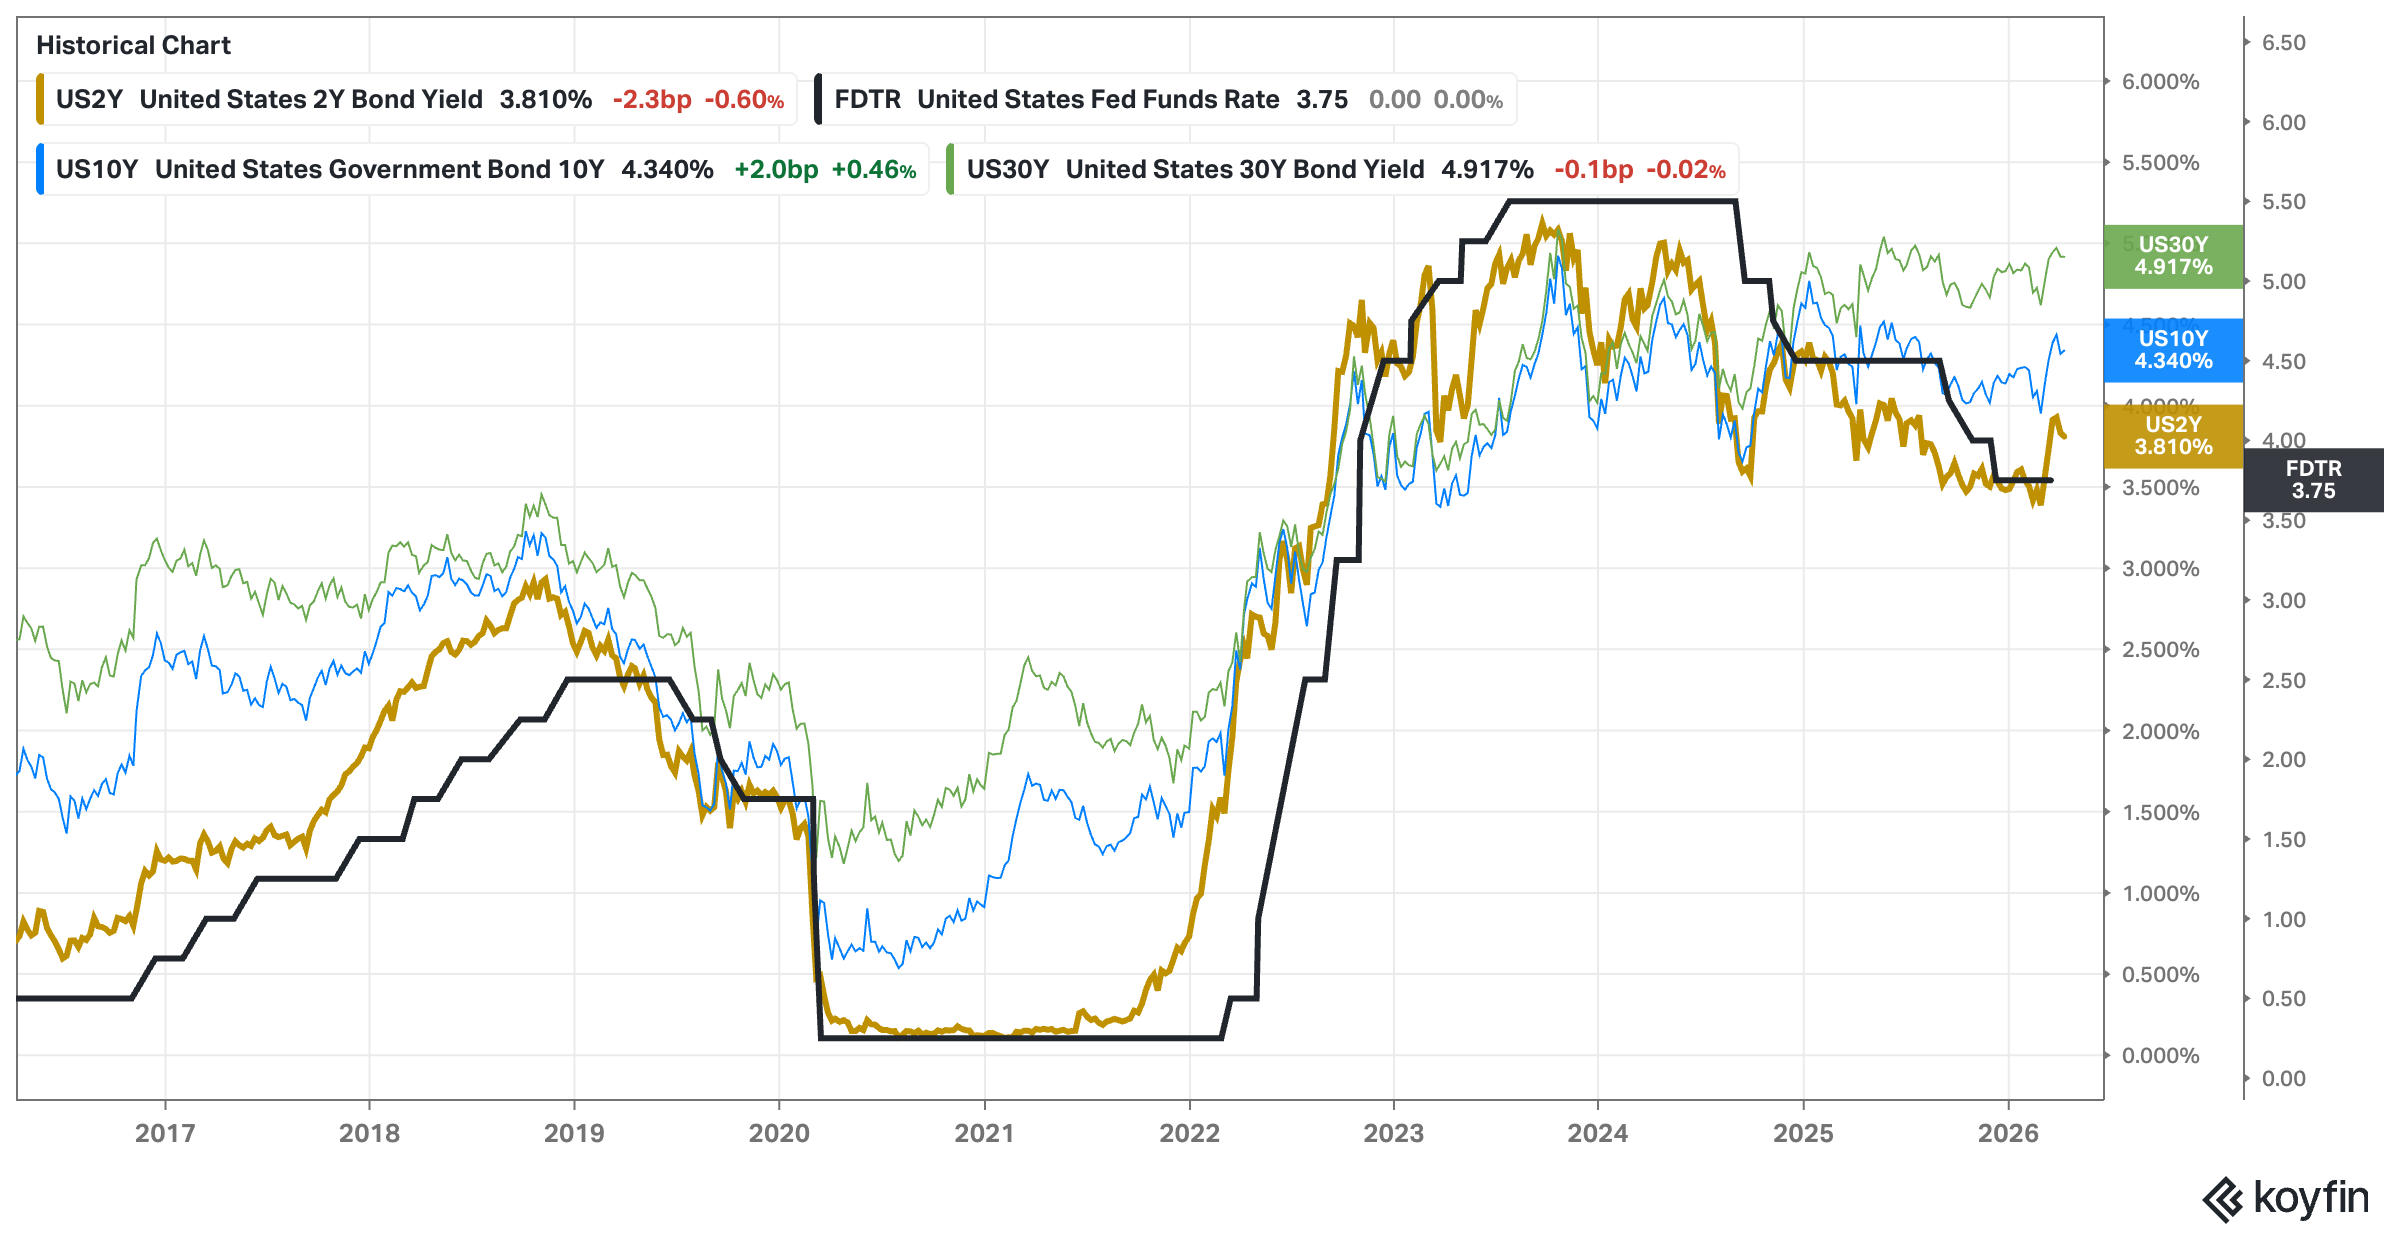
Analysis: Turnaround in rates. We want to see a continuation to lower readings, and quickly, to declare all clear in the bond market.
Outlook: Neutral to Bearish.
Why is it happening? – Level 1
USD & Interest Rates: USD vs EEM and S&P500
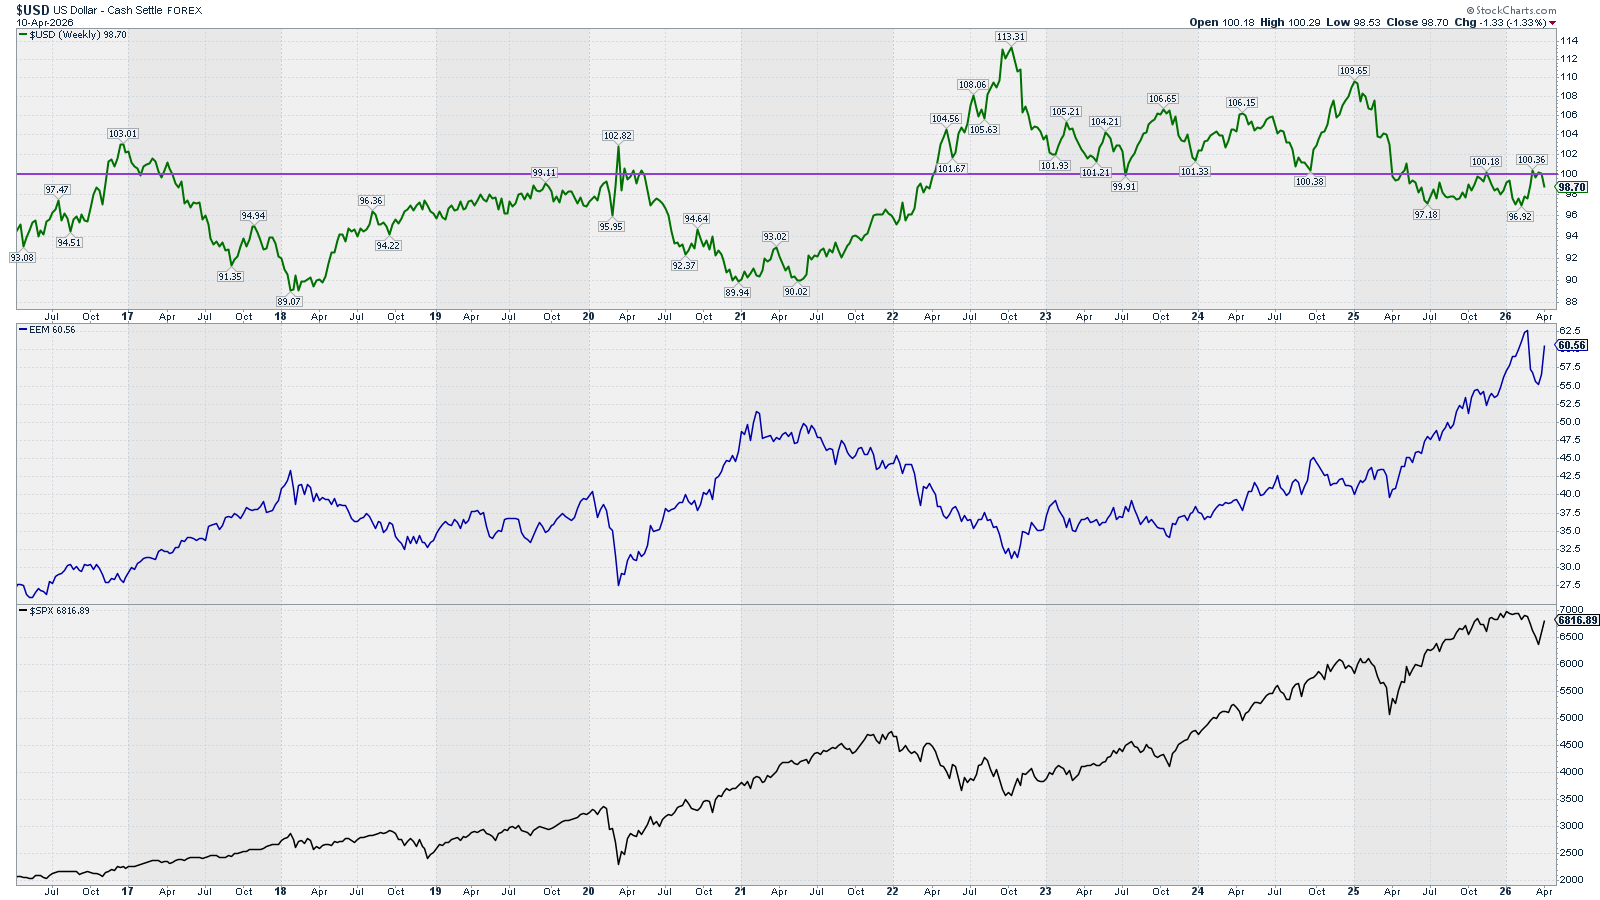
Analysis: USD 100 level resistance is proving to be difficult to break. The Iran-war developments towards peace have ease the pressure on the USD and allowed EEM to rally. I’m improving the outlook from Bearish to Neutral on the hopes of the Iran-war to de-escalate (no neeed to be resolved).
Outlook: Neutral (the longer the war the higher the oil & gas disruption)
Why is it happening? – Level 1
Context Investors Sentiment: Credit Spreads
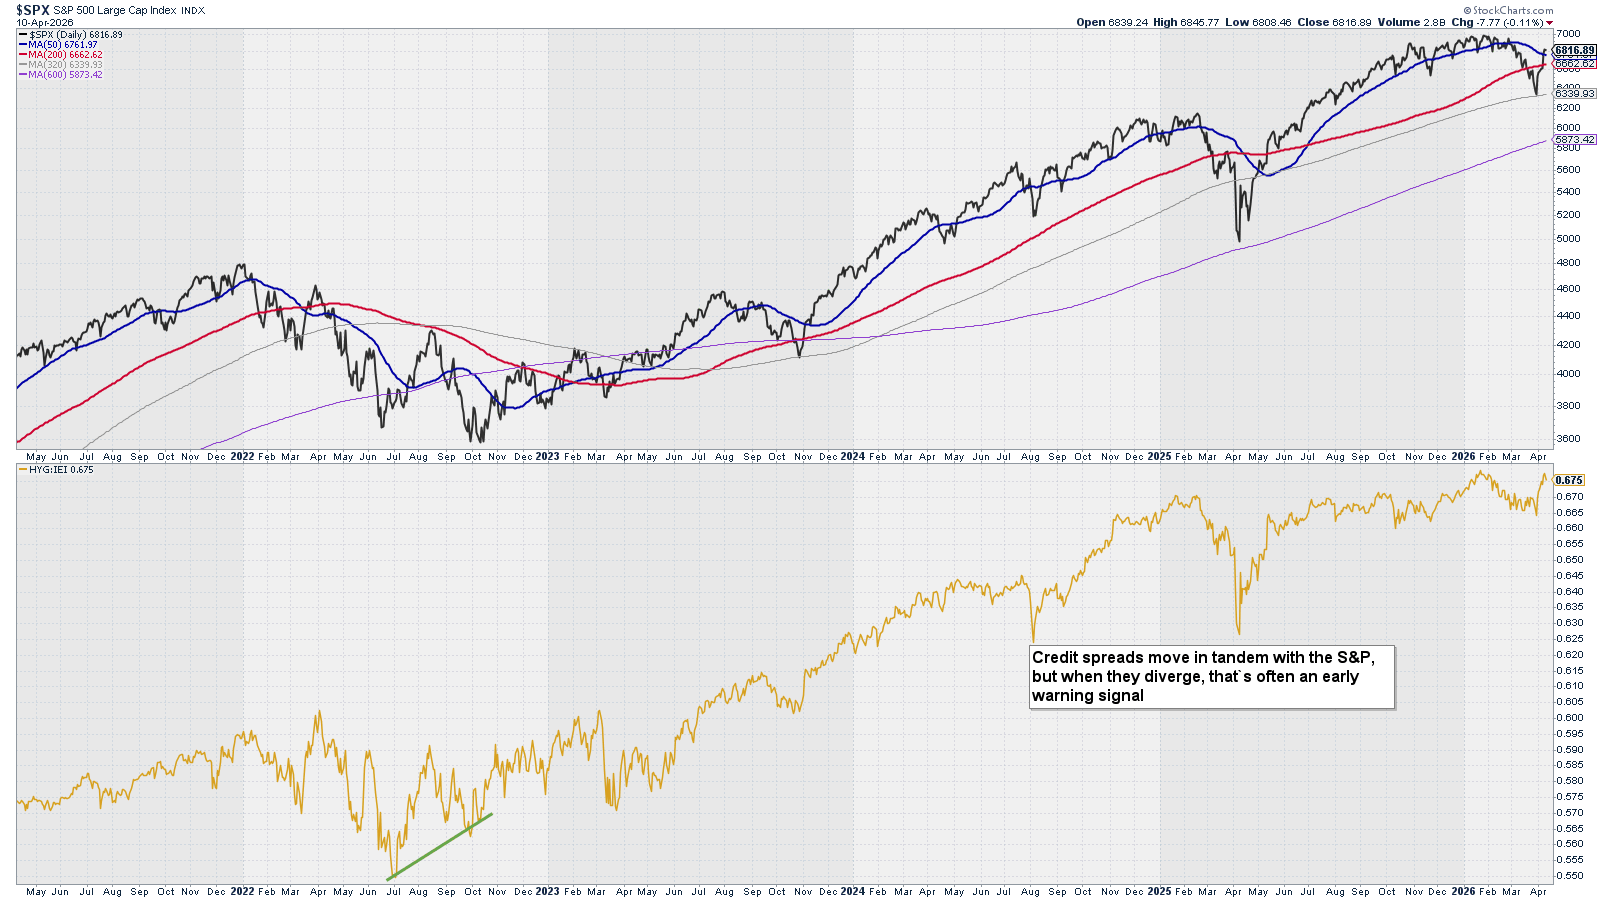
Credit spreads move in tandem with the S&P, but when they diverge, that’s often an early warning signal.
Analysis: Last week we saw the spreads raise. This was a good outlook for the market. This week, the spreads continued to raise, confirming the bullish outlook.
Outlook: Bullish
Level 1 Summary
Economic Data (long-term): Bullish to Neutral
USD & Interest Rates: Neutral
Investors Sentiment: Bullish
What is happening? – Level 2
Price Action: SPX – Trend – 20 years
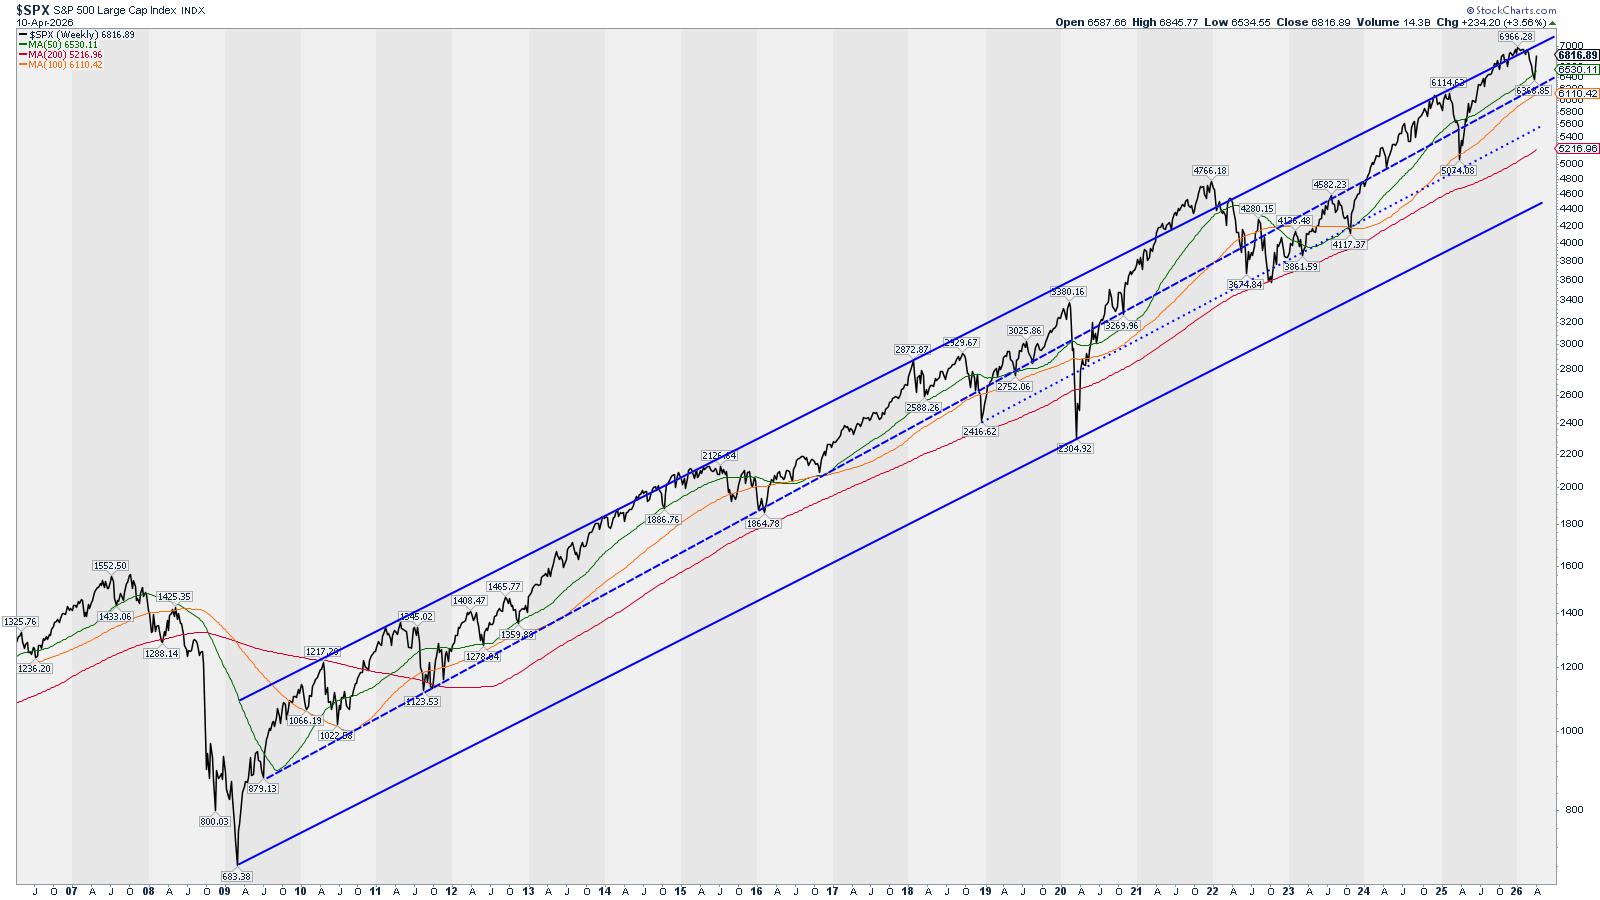
Analysis: Price found support at the Weekly SMA 50 (green). Support at this level occurred multiple times in the past, and could well be a significant bottom. Yet, stronger areas of support are below these levels, for example the middle of the channel (blue) and the Weekly SMA 100 (orange). These two levels are no much further below and could be reached on a “flush” bearish move that could mark “the bottom”.
Outlook: Bearish to Neutral
What is happening? – Level 2
Price Action: RSP – Trend – Weekly
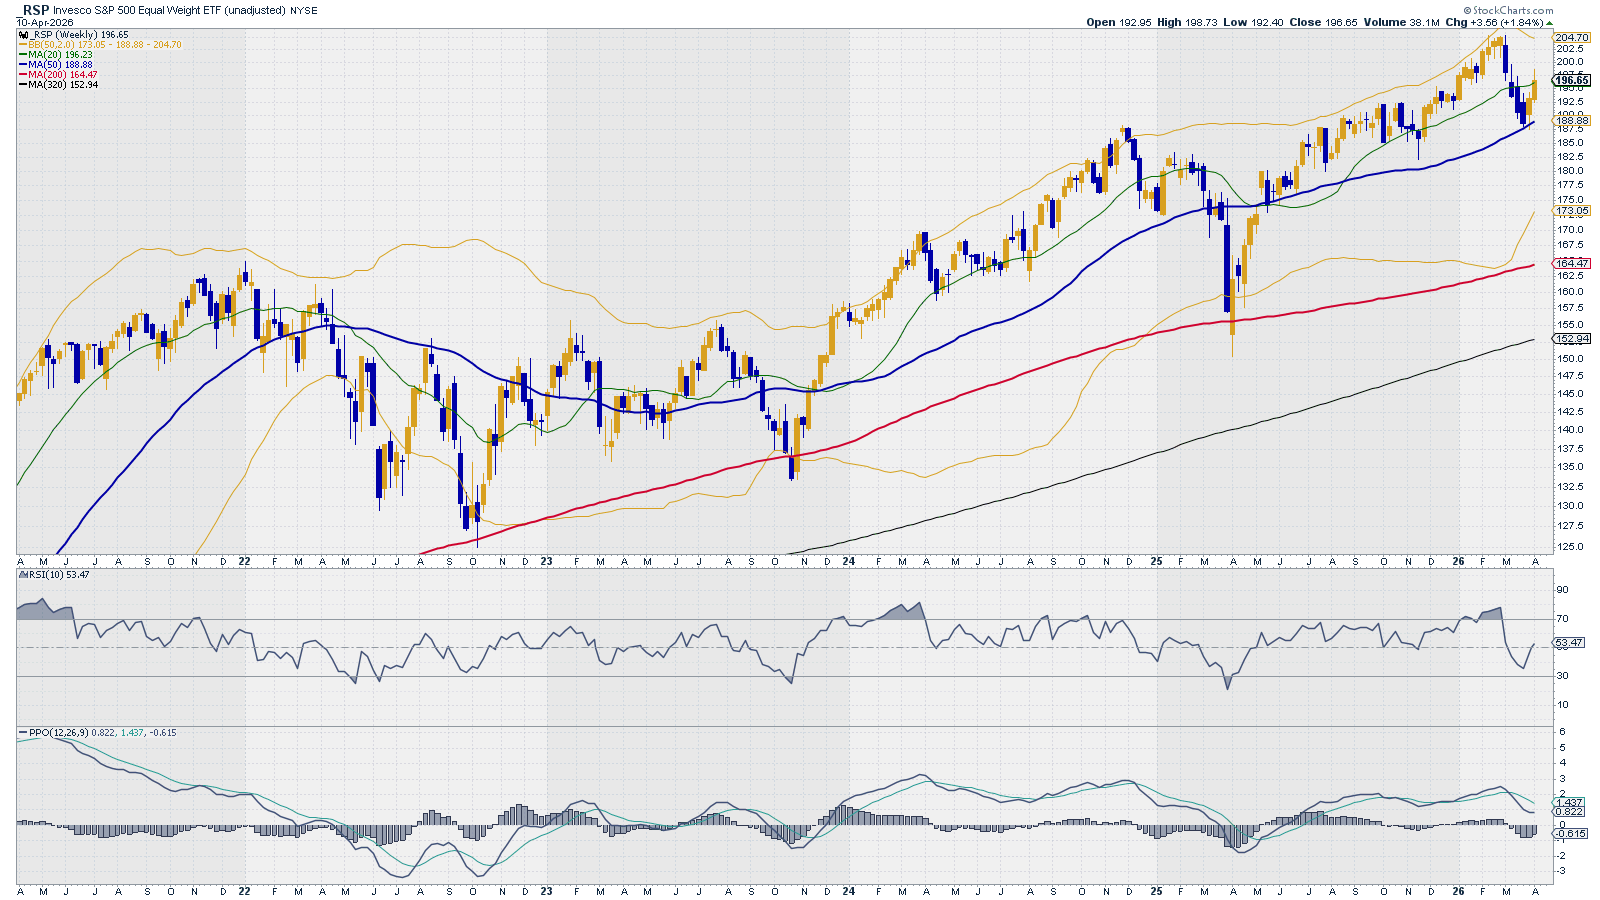
Analysis: After last week’s bounce, price closed just below the weekly SMA 20. RSI is in bullish territory but PPO is not. These indicators plus the resistance found, keep our outlook bearish but slightly improved to neutral.
Outlook: Bearish to Neutral
What is happening? – Level 2
Price Action: RSP – Trend – Daily
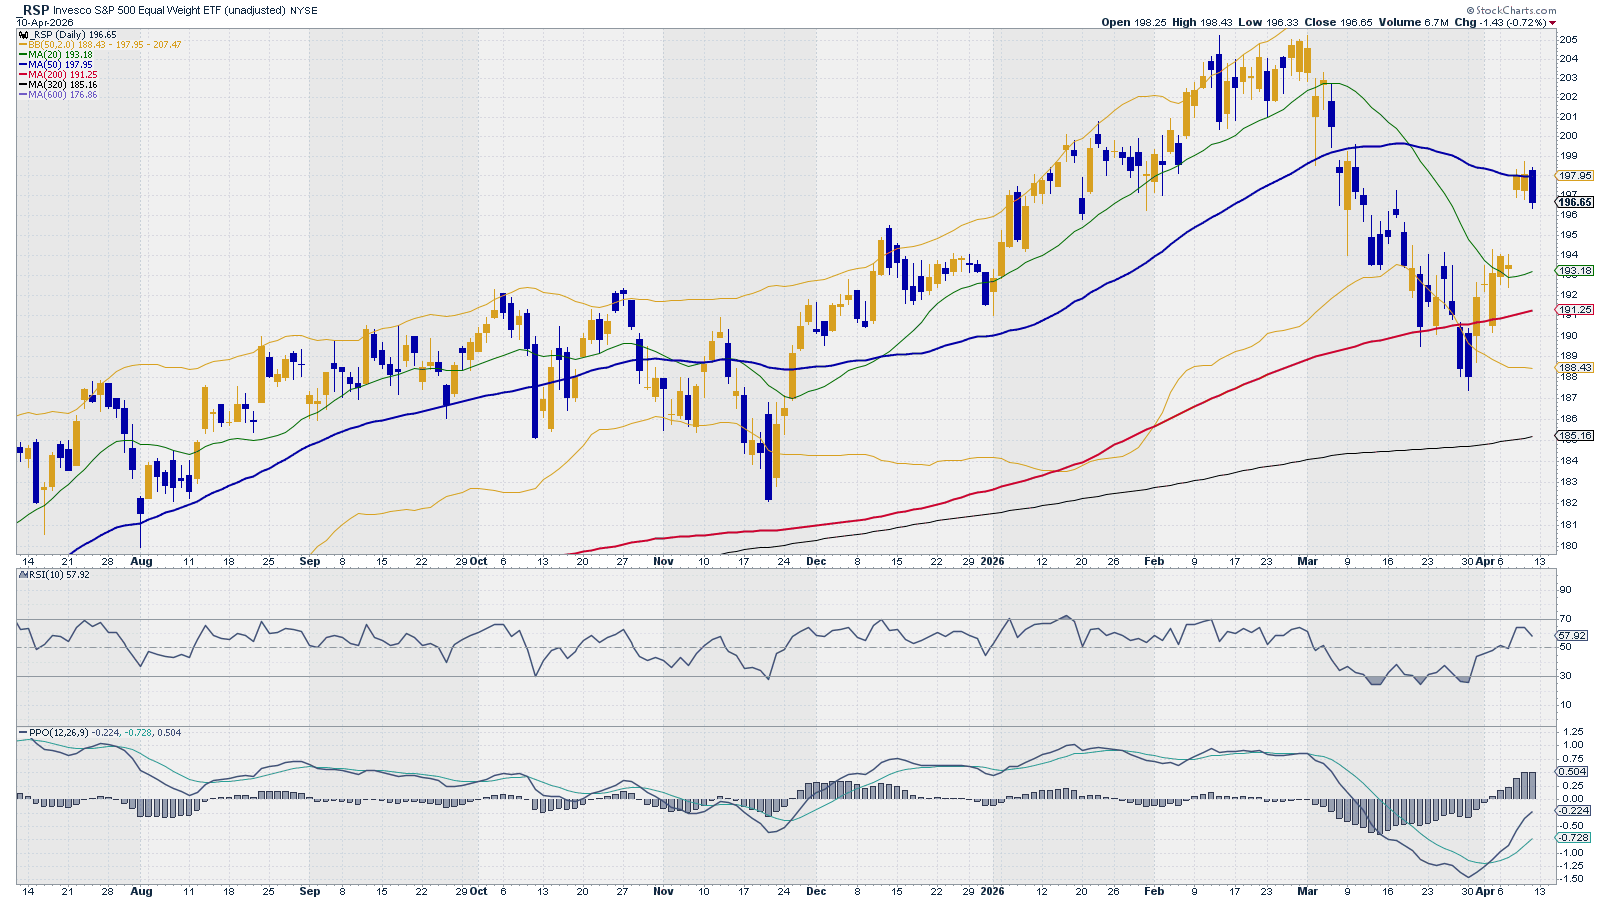
Analysis: Last week, we identified a bottom formation in the daily chart. Market indeed rallied, but RSP closed below the daily SMA 50. There is a famous market theory that says that gaps tend to be closed. So, it is possible that we could see an attempt to close the gap until daily SMA 20. RSI is in bullish territory and PPO as well. So we are keeping our Neutral to Bullish outlook as last week.
Outlook: Neutral to Bullish
What is happening? – Level 2
Breadth & Volatility: % Stocks above 200 SMA vs. RSP
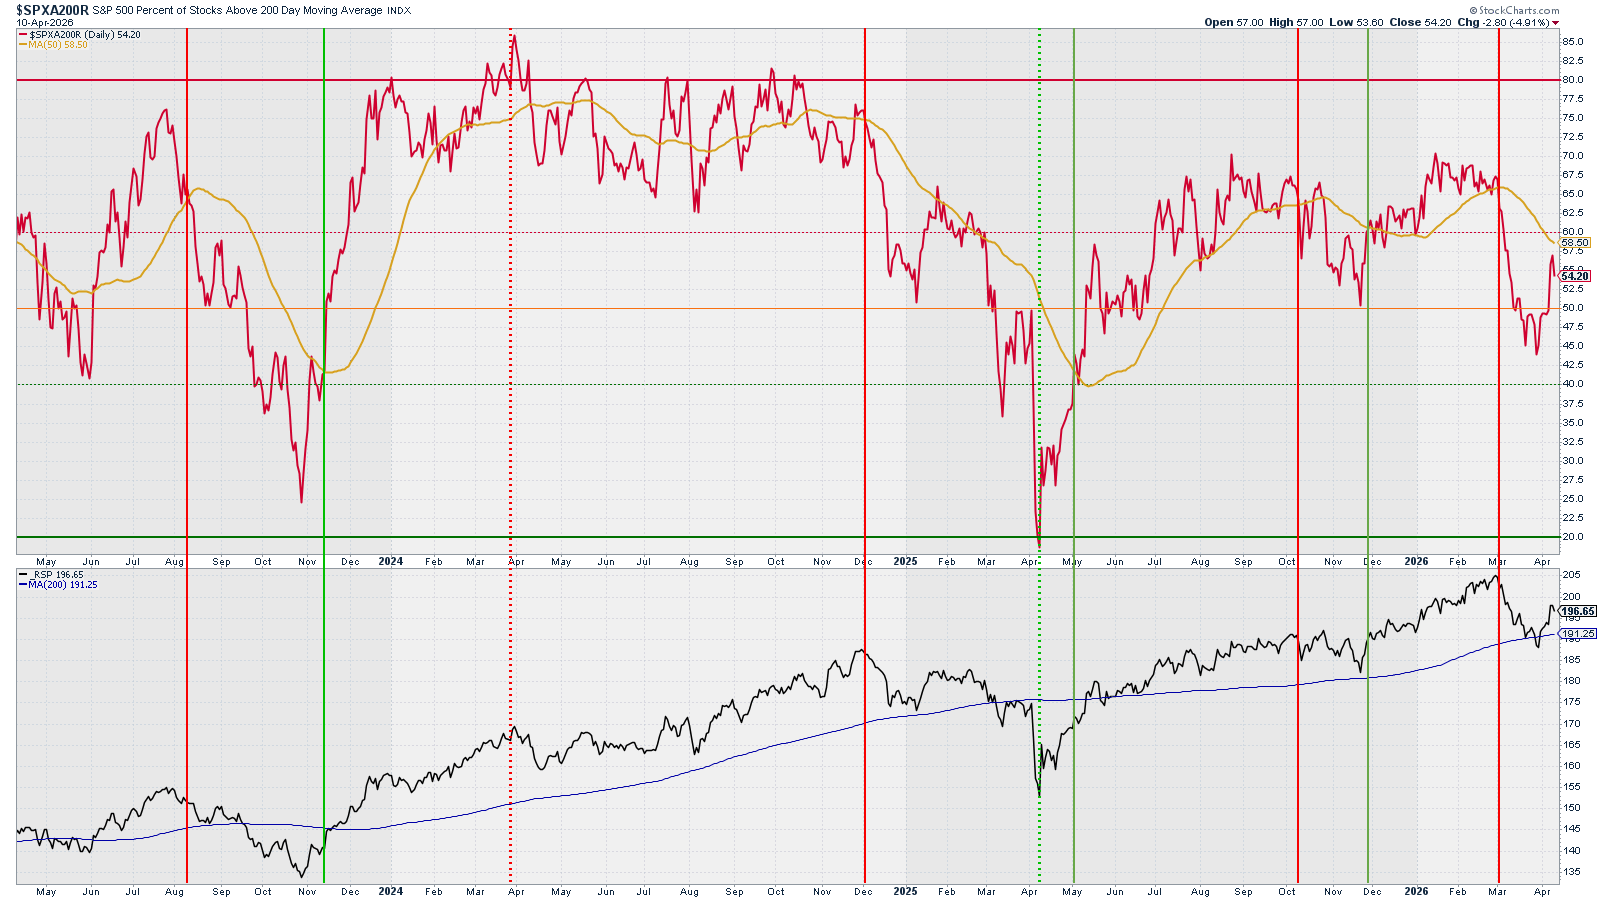
Analysis: We have jumped from last week’s 49% to last Friday’s close at 54%. Yet the bullish signal is not given as we are still below the daily SMA 50. I’m improving the outlook from bearish to neutral as the bullish signal is getting closer.
Outlook: Neutral
What is happening? – Level 2
Breadth & Volatility: RSP and % Stocks above 200, 50, and 20 SMA
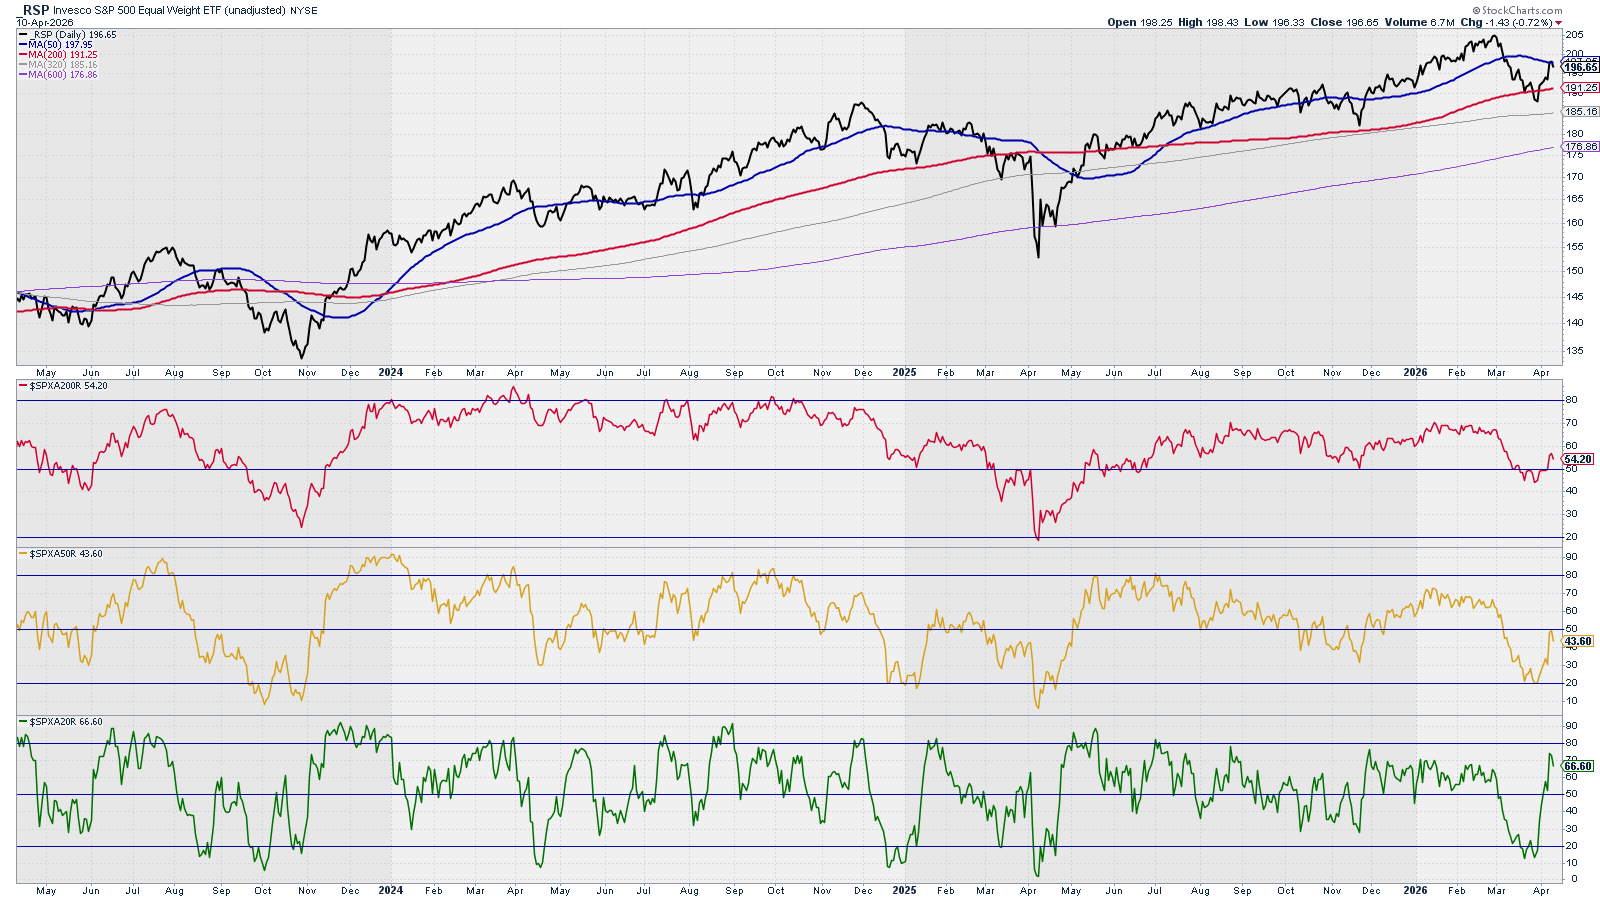
Analysis: Last week, this breadth view really showed us that when there is nobody selling the market can really spring up quickly. The %A20R (green) reflects this week’s action with a 66% of the market above their SMA 20. This could act as a catalyst for further bullish price action. %A50R (yellow) and %A200R (red) have room to allow for bullish advancements.
Outlook: Bullish
What is happening? – Level 2
Breadth & Volatility: Bullish Pct. Index & McClellan Summation Index
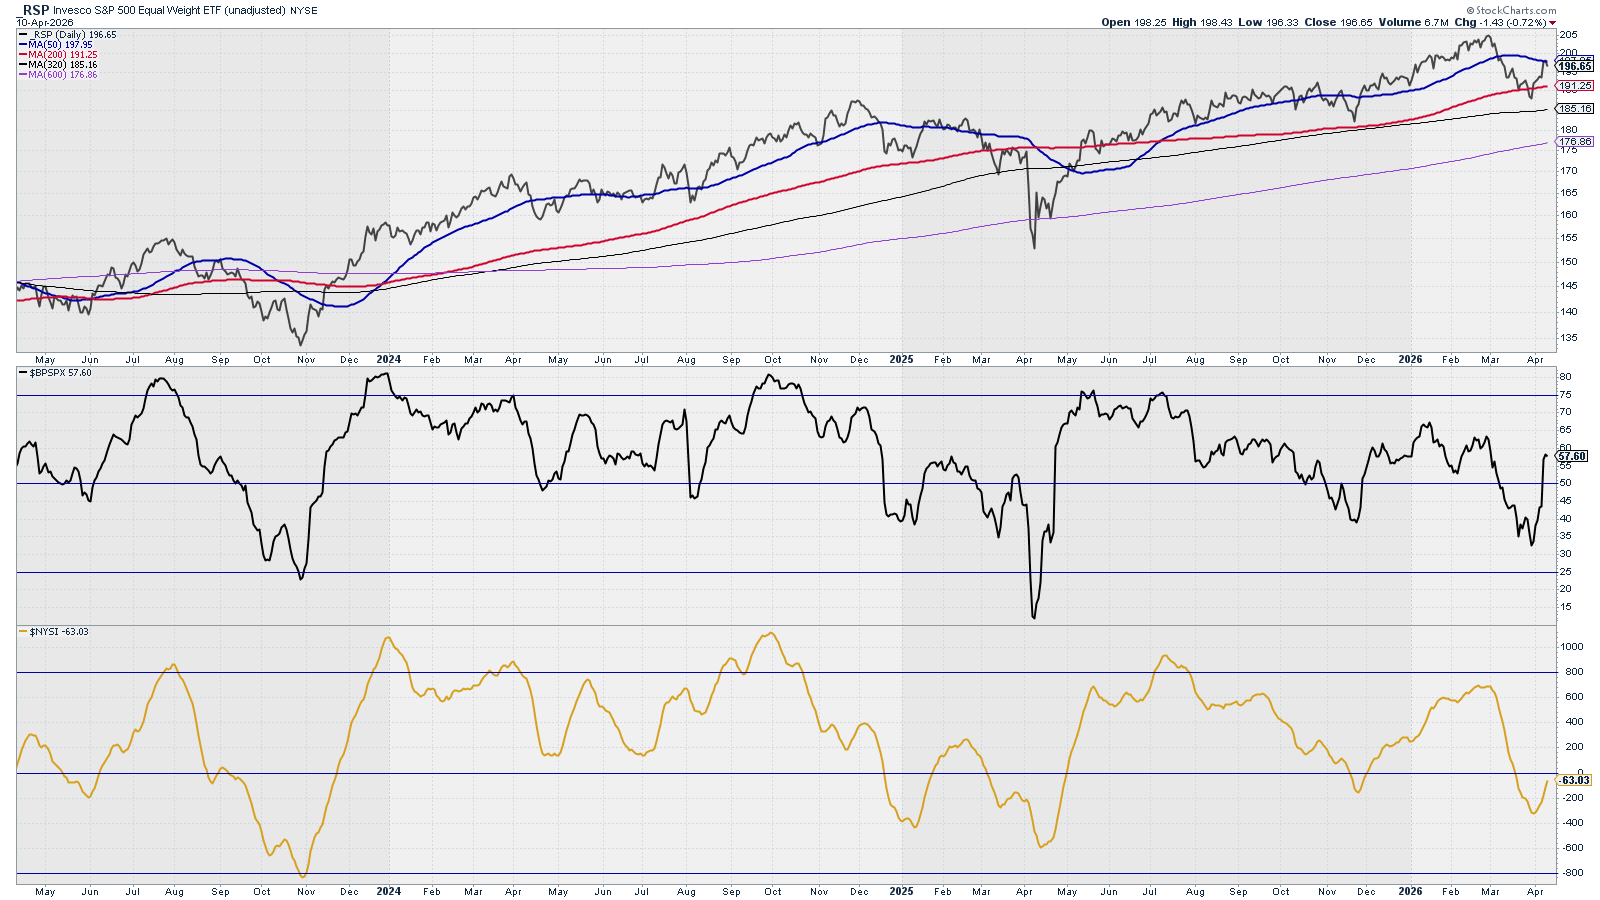
Analysis: Both signals in synch with market action and far away from any overbought or oversold area. Changing the outlook from bearish to bullish.
Outlook: Bullish
What is happening? – Level 2
Breadth & Volatility: Ratio Low Volatility Stocks / SPY vs. SPY & RSP
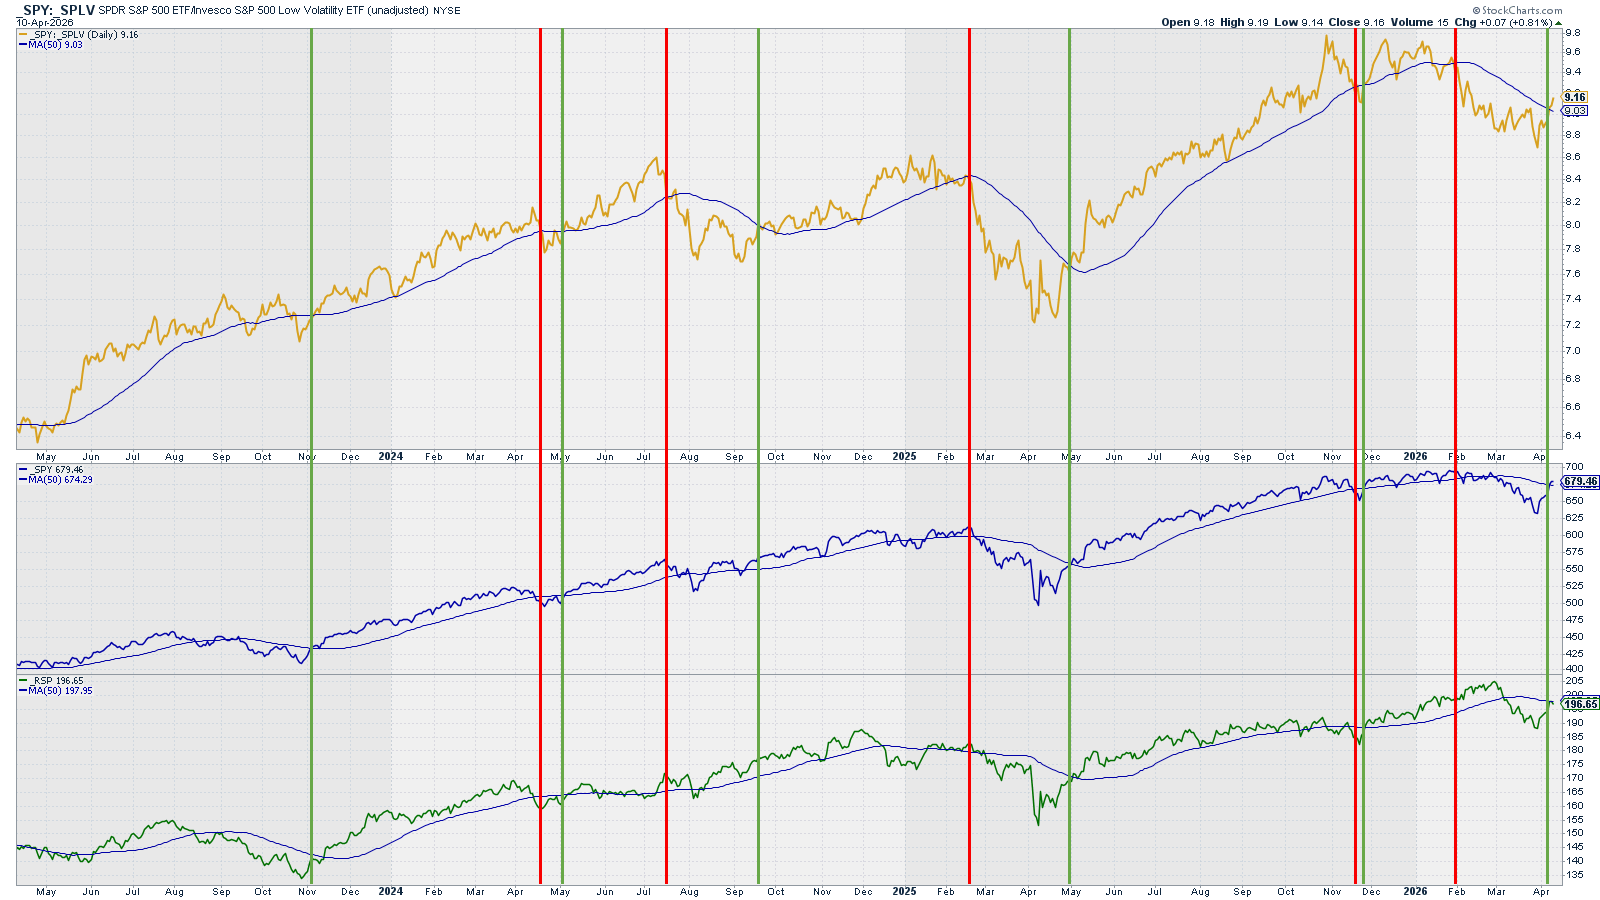
Analysis: Bullish signal triggered! This is a great signal for the market. We will monitor for the signal to hold, yet historical it had. (signal above its Daily SMA 50).
Outlook: Bullish
What is happening? – Level 2
Breadth & Volatility: New Highs vs. SPY & RSP
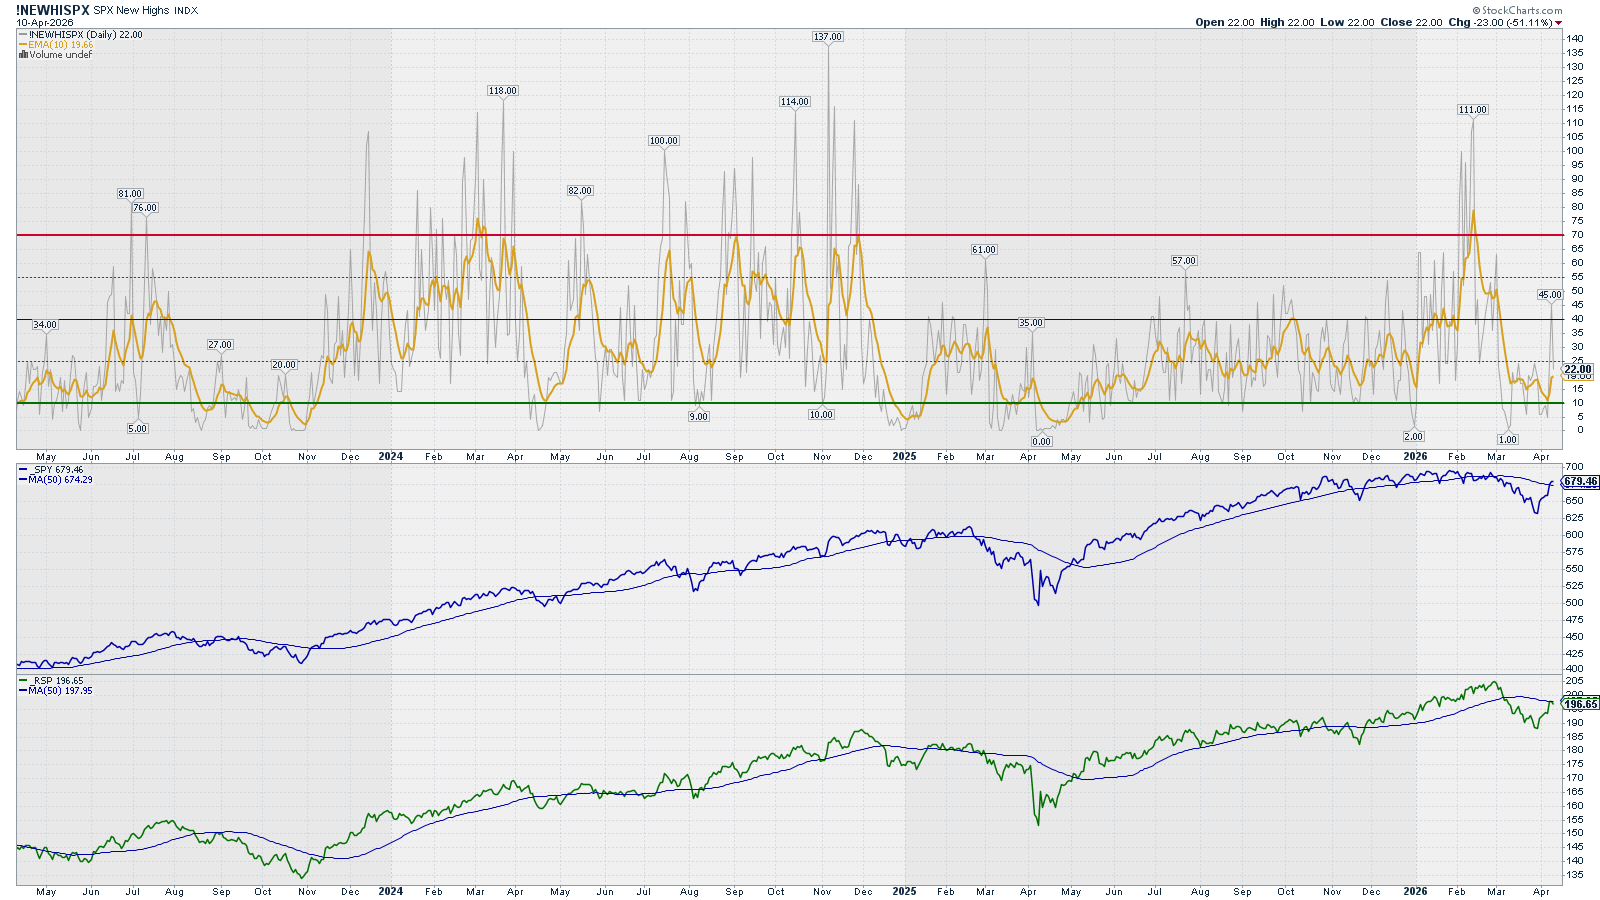
Analysis: New Highs (gray) have spiked - due to this week’s bullish market - while the daily EMA 10 is improving from oversold levels. This setup allows for more bullish market action. I’m upgrading the outlook from bearish to bullish.
Outlook: Bullish
What is happening? – Level 2
Breadth & Volatility: VIX vs. SPY & RSP
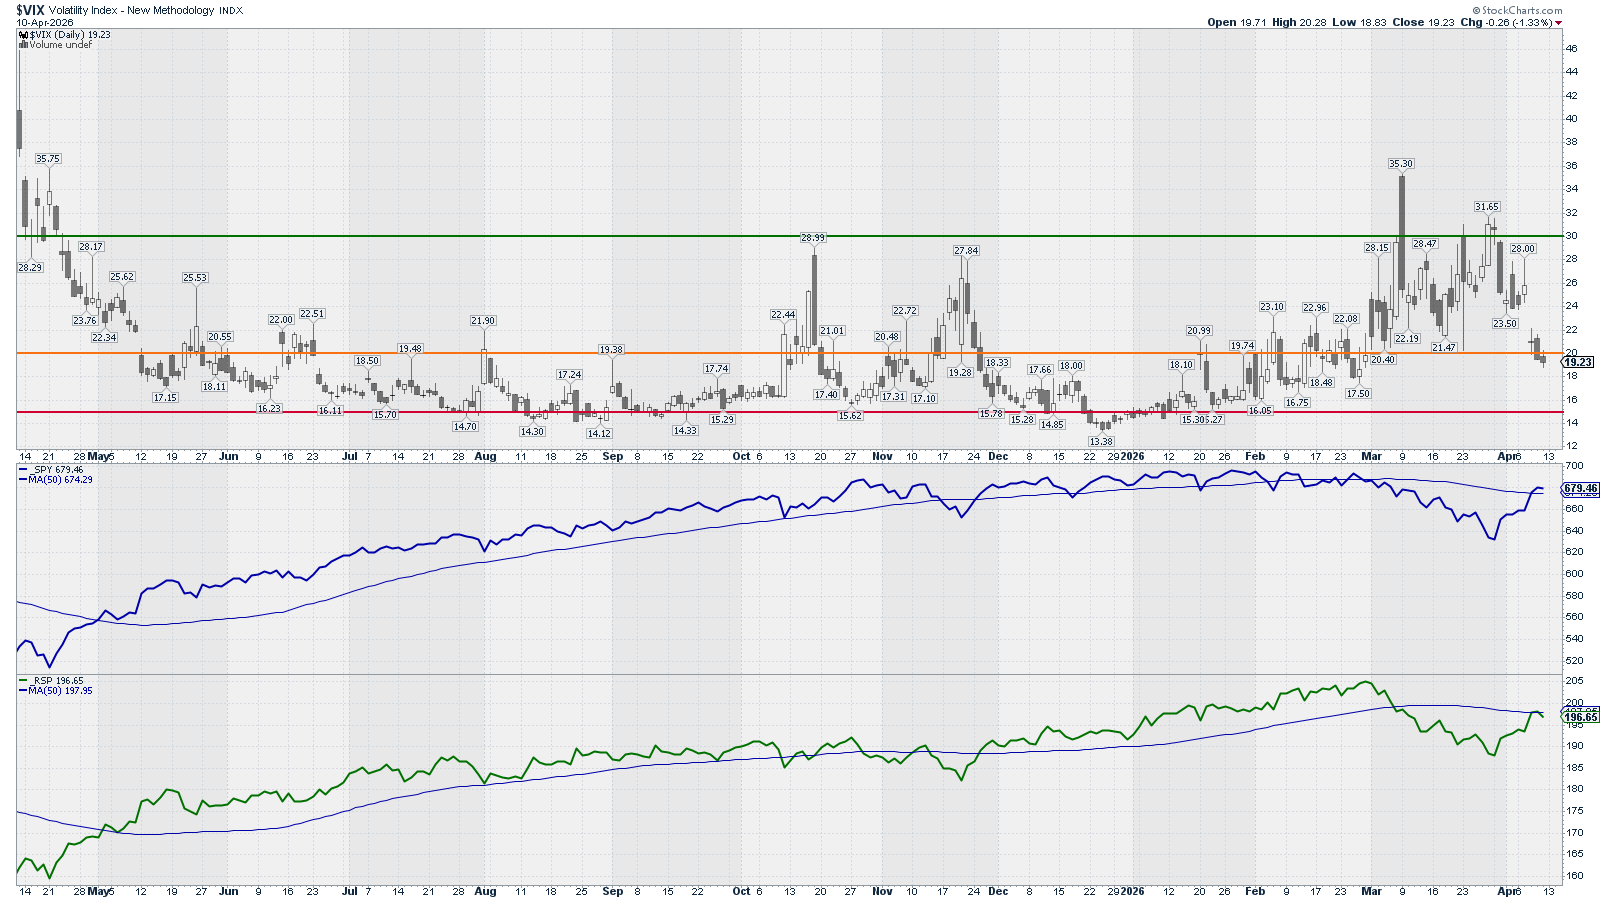
This chart is mainly to detect market bottoms.
Analysis: The trend has changed. The volatility has dropped below 20. This normally is good for the market.
Outlook: Expect normal volatility
What is happening? – Level 2
Options: (Inverted) Put/Call Ratio vs. SPY
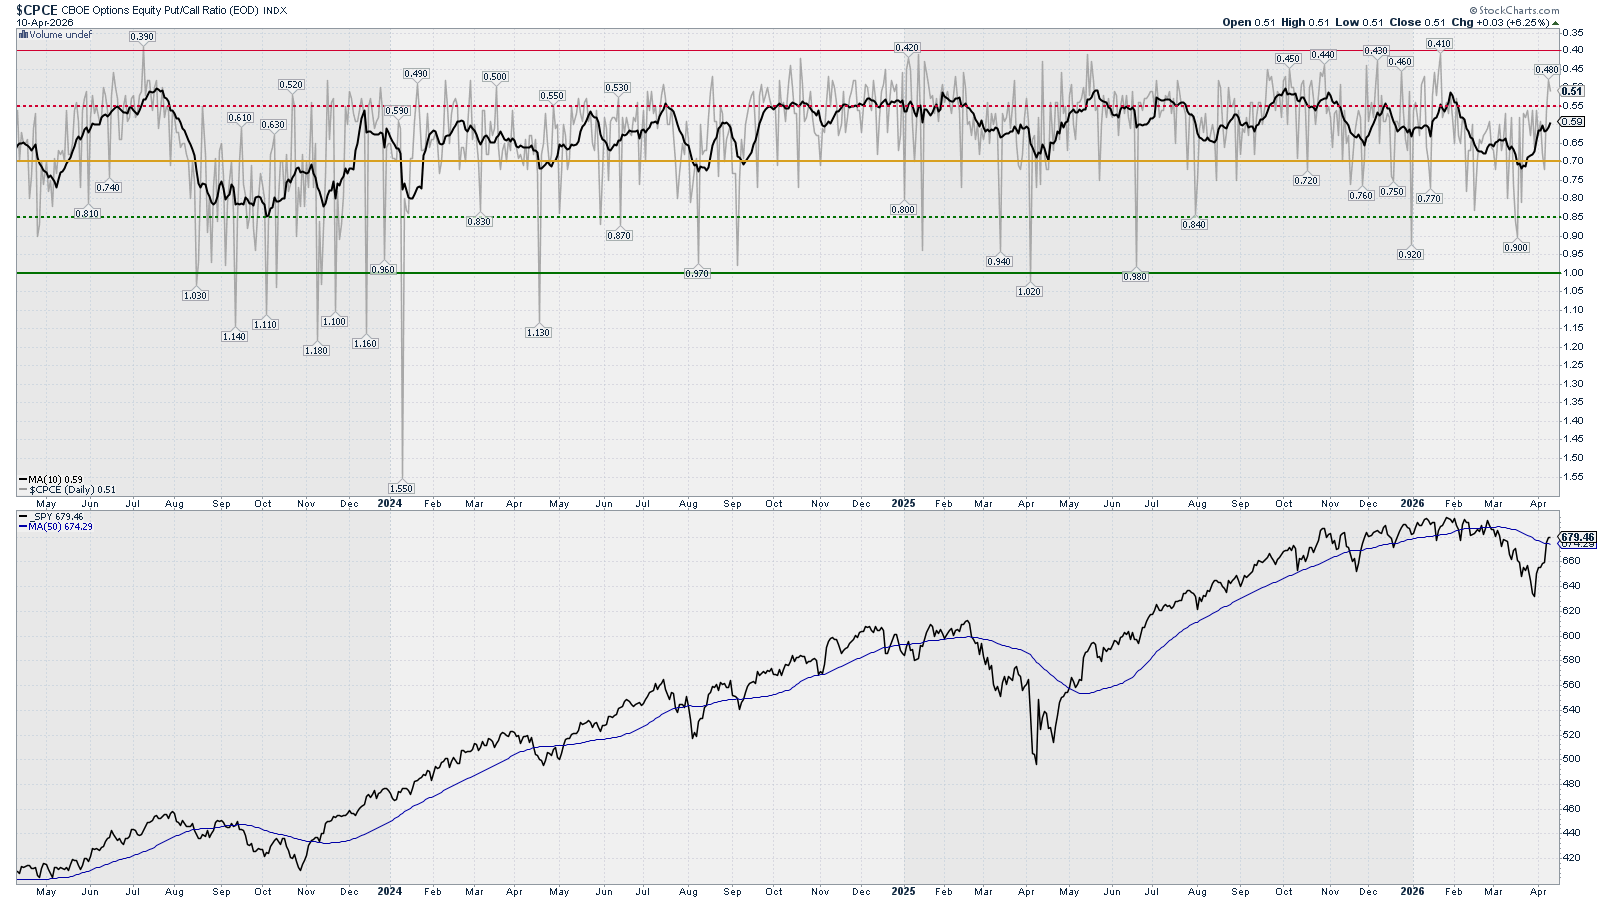
Analysis: The options market is telling us that we shall see high markets in the near future. There is no sign of neither panic bulls nor bears.
Outlook: Bullish
What is happening? – Level 2
Options: Gamma Exposure – SPX
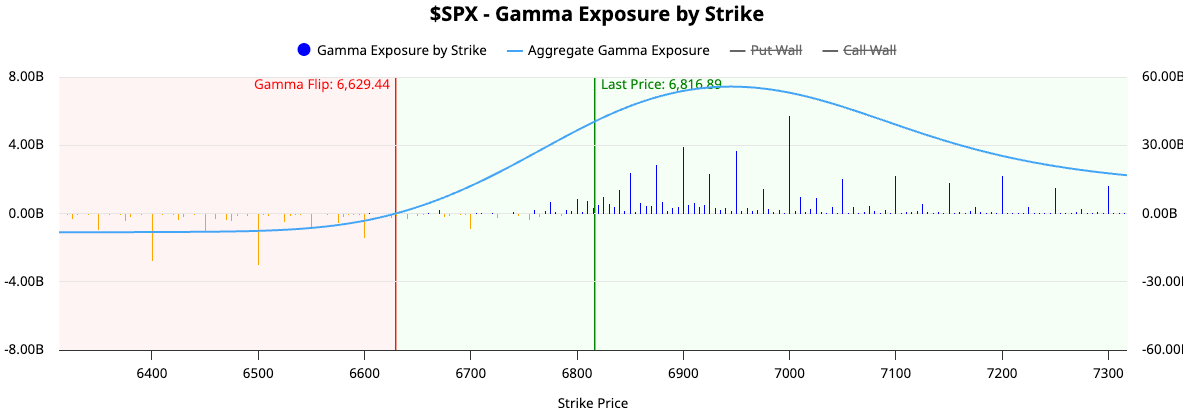
Analysis: We are in positive gamma territory with a clear objective at 7000.
Outlook:Bullish
Level 2 Summary
Price Action: Neutral
Breadth & Volatility: Bullish
Options: Bullish
What is happening? – Level 3
Bulls vs. Bears: RSP vs. RSPD (Cons. Disc. – Bulls) and RSPS (Cons. Sta. – Bears)
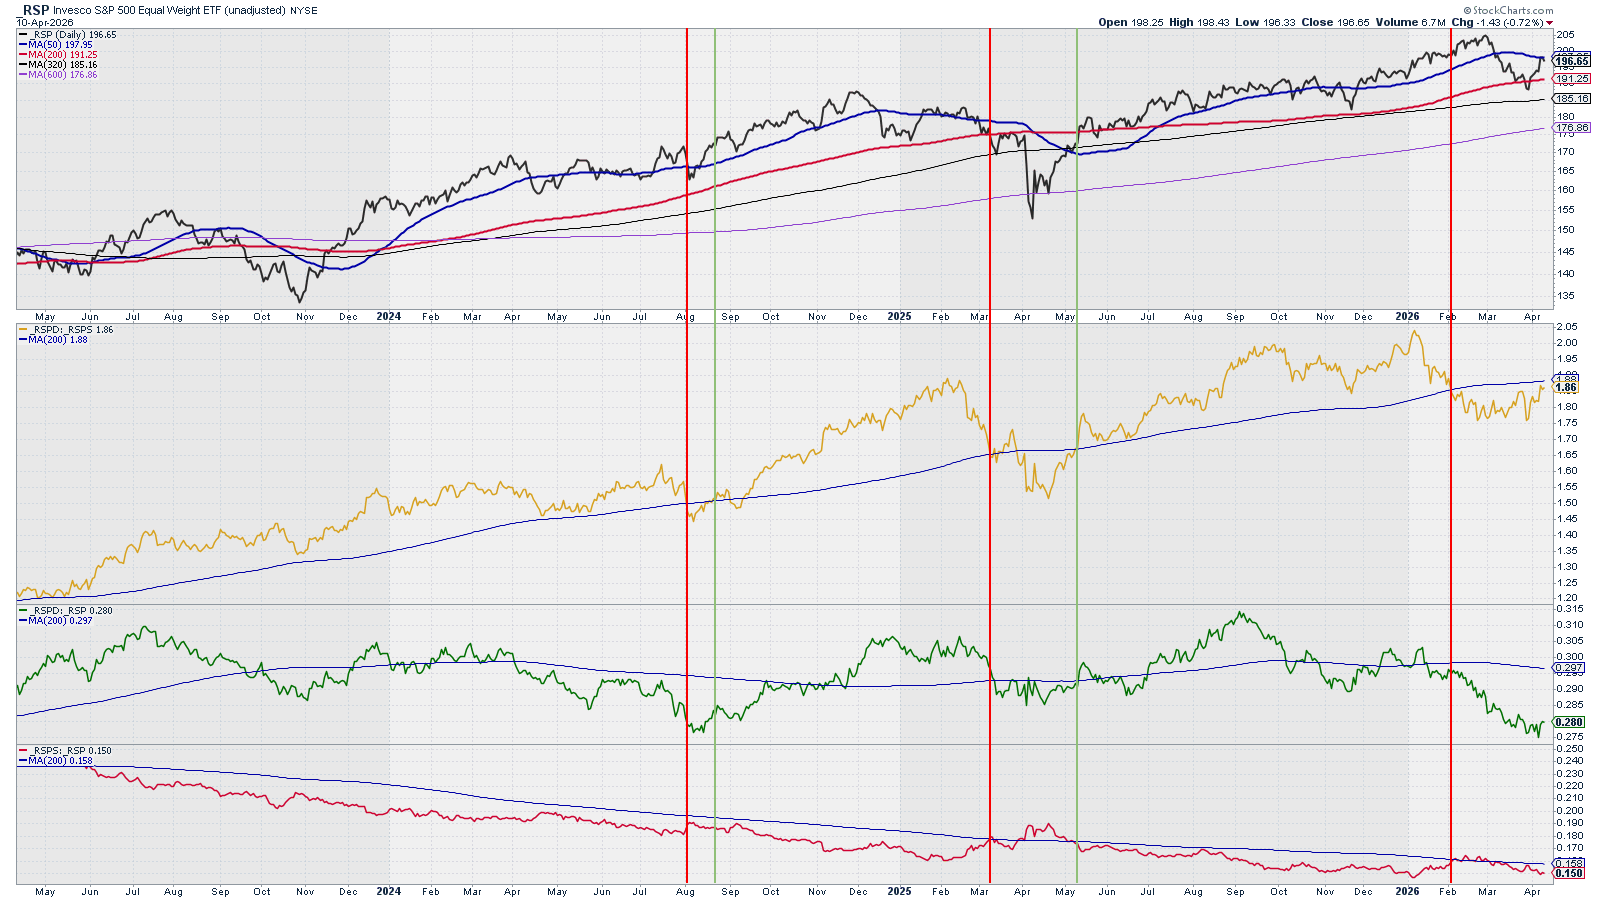
Analysis: The ratio, after moving sideways for few days, is finally moving higher and is about to cross its daily SMA 200 making a bullish signal. Bulls (green) are still weak but Bears (red) are not getting stronger. I’m improving the outlook from neutral to neutral to bullish.
Outlook: Neutral to Bullish
What is happening? – Level 3
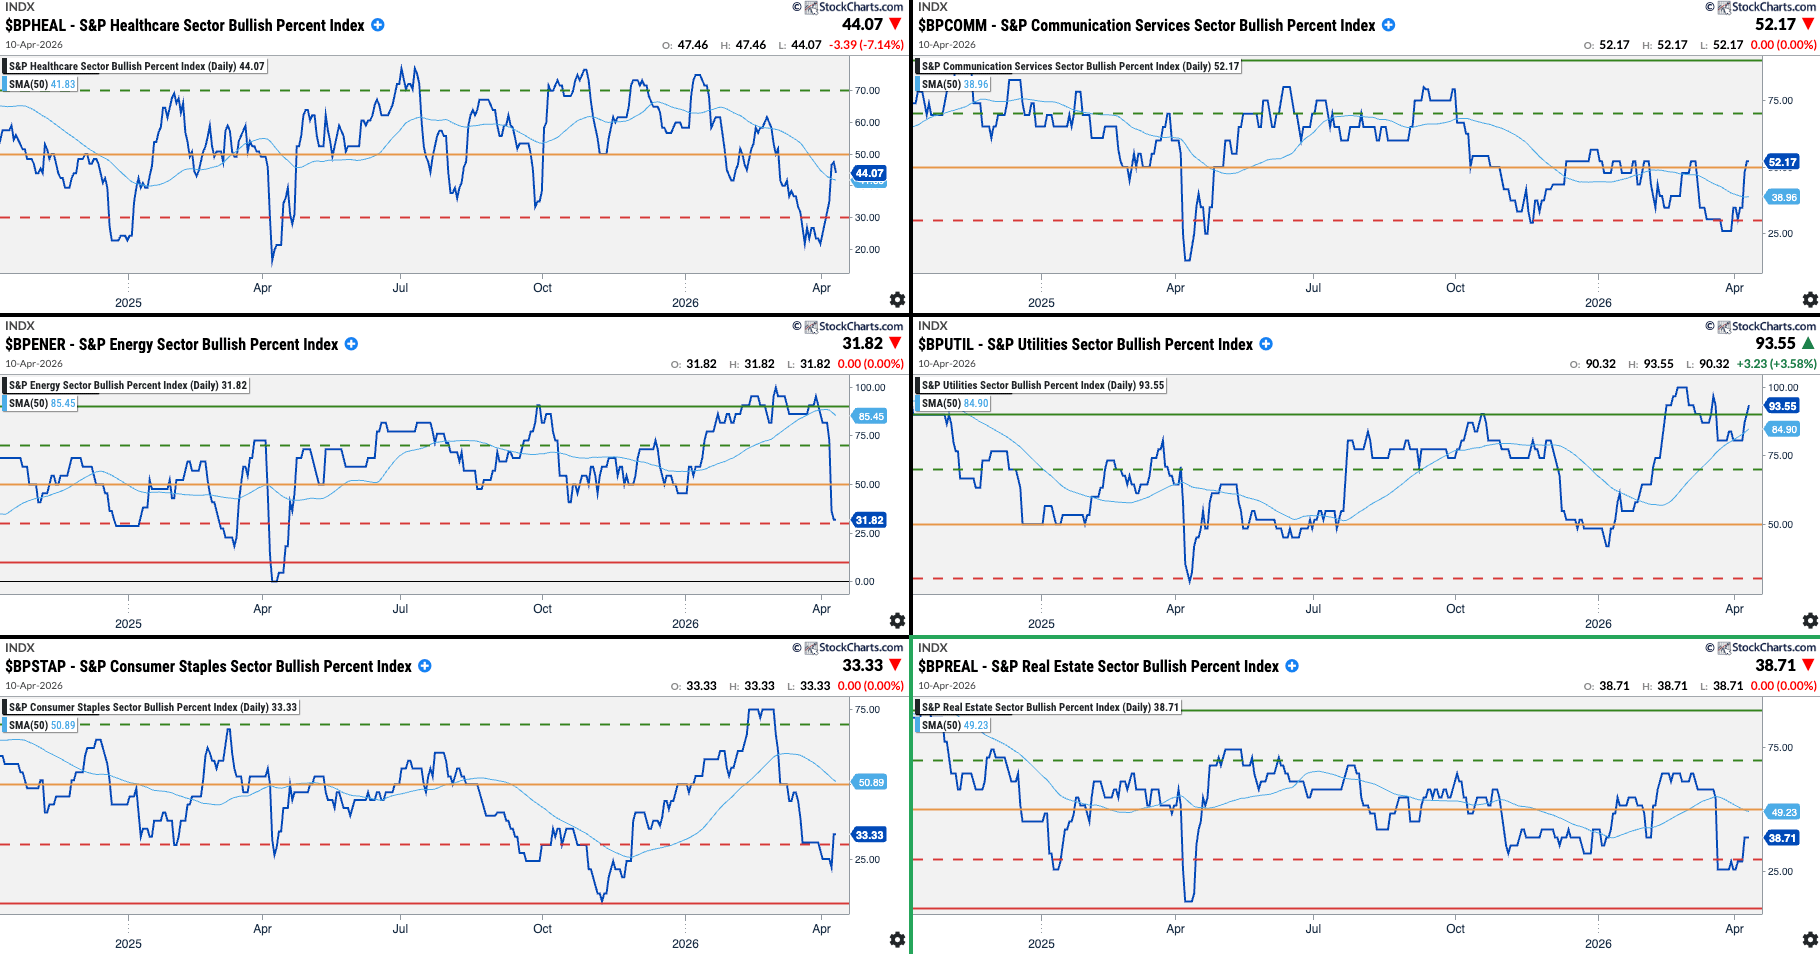
Sectors Rotation: Sectors Bullish Percent Index
Growth Sectors:
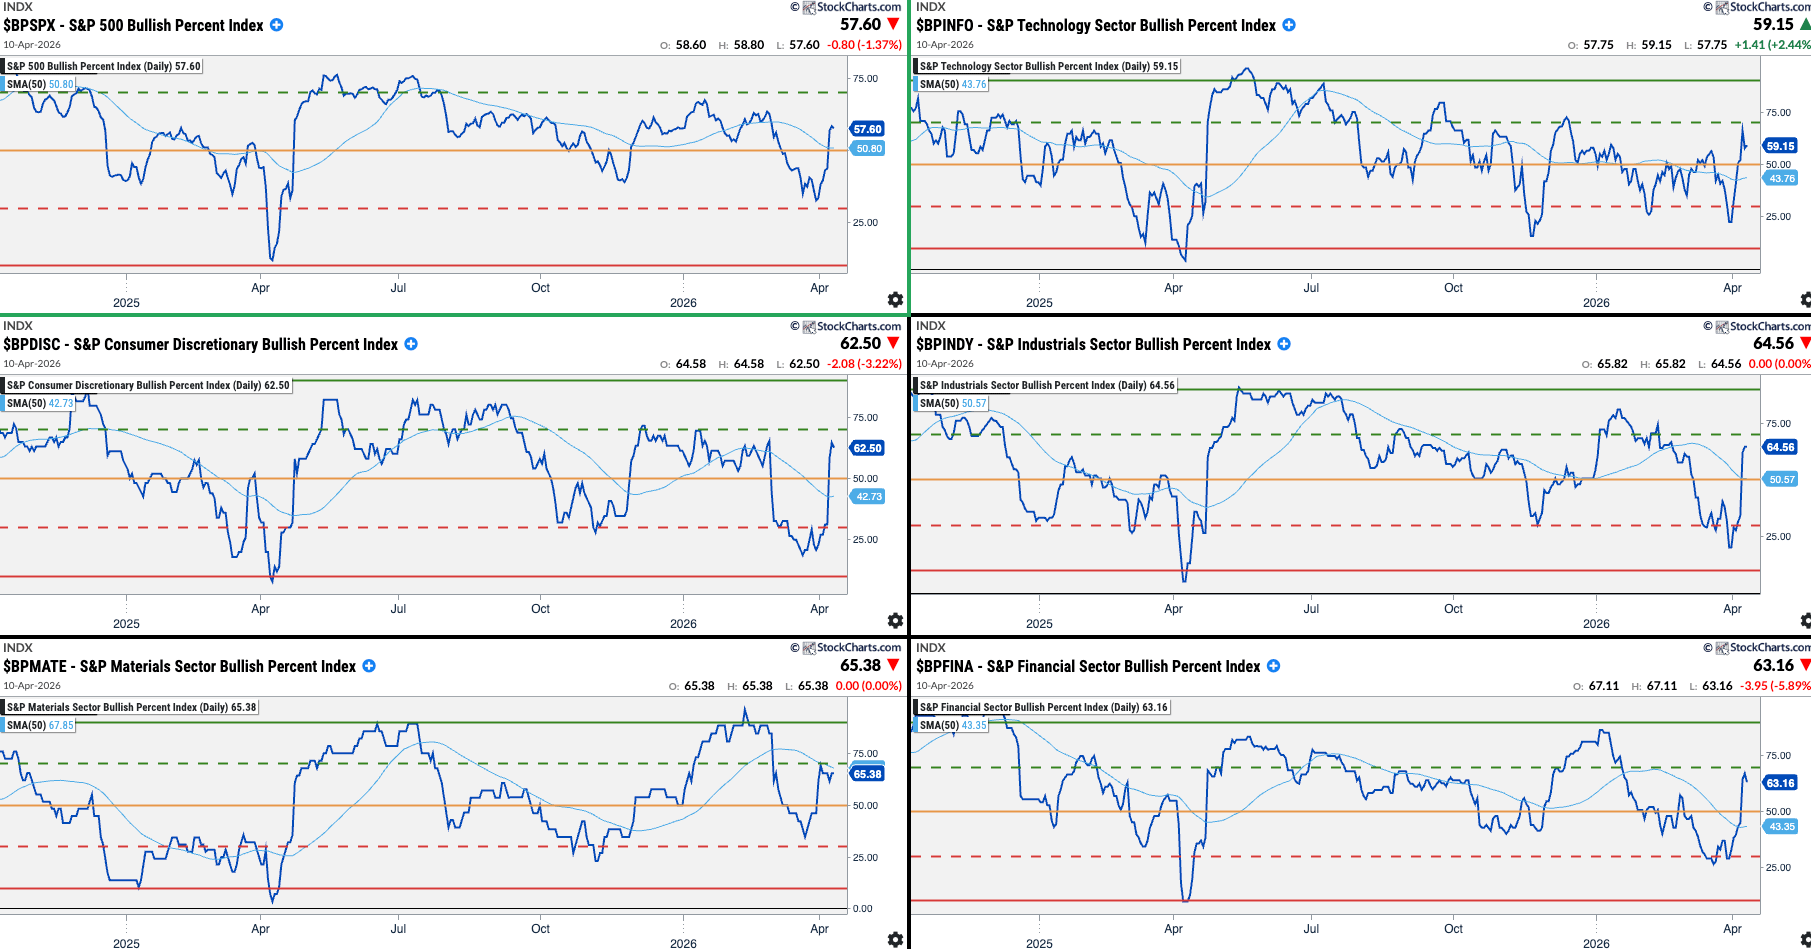
Value Sectors:
US Sectors order by ISM PMI Correlation (between parenthesis)
Growth Sectors - shall outperform when the market is bullish:
XLK: Technology (71%)
XLY: Cons. Discretionary (67%)
XLI: Industrials (66%)
XLB: Basic Materials (66%)
XLF: Financials (59%)
Value Sectors - shall outperform when the market is bearish:
XLV: Healthcare (55%)
XLC: Communications (49%)
XLE: Energy (44%)
XLU: Utilities (35%)
XLP: Cons. Staples (30%)
XLRE: Real Estate (16%)
Analysis:
Any sectors below their red levels are good opportunities to find great companies at good valuations or buy sector ETFs (buy cheap). Those sectors above their Green levels are candidates to be sold (sell expensive).
Buy Opportunities: Everything except Energy. Focus on industrials and finance.
Sell Opportunities:
Market & Economy Rotation
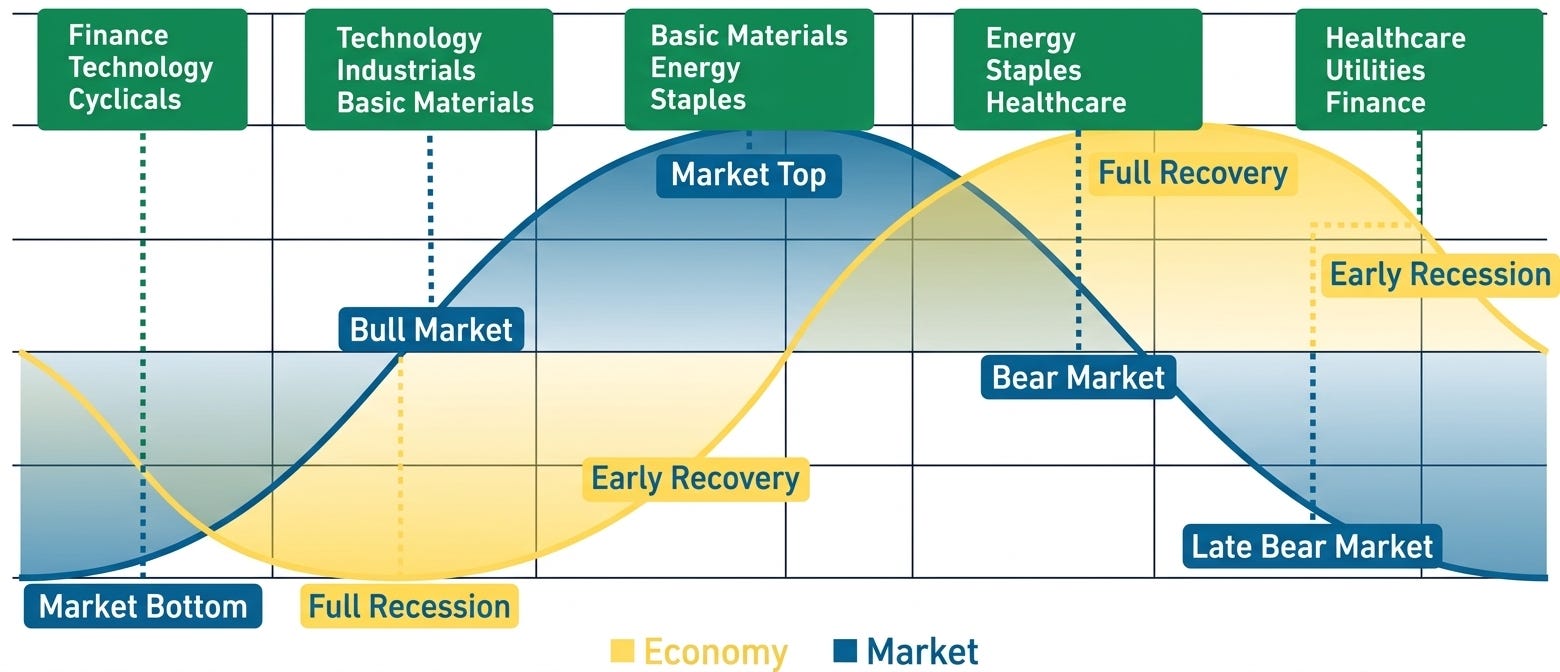
Analysis:
If we consider that Energy has peaked and that the next wave higher comes from Healthcare, Tech, and Industrials, then we are entering the “Late Bear Market” and moving fast towards a “Market Bottom” situation.
Level 3 Summary
Bulls vs. Bears: Neutral to Bullish
Market & Economy Rotation: Seems that we are in a Market Bottom and moving towards a Bull Market
All Levels Summary and Final Thoughts
Level 1 Summary
Economic Data (long-term): Bullish to Neutral
USD & Interest Rates: Neutral
Investors Sentiment: Bullish
Level 2 Summary
Price Action: Neutral
Breadth & Volatility: Bullish
Options: Bullish
Level 3 Summary
Bulls vs. Bears: Neutral to Bullish
Market & Economy Rotation: Seems that we are in a Market Bottom and moving towards a Bull Market
Final Thoughts
Dominant Narrative: Iran’s war peace negotiations
Thanks to Iran-war peace talks, the market has significantly advanced this week. The options market is signalling a continuation of the bullish action towards the S&P 7,000 goal.
If news follow markets, then we shall see Iran-war de-escalation talks to succeed and let the market focus on earnings and that AI disruption that kept us so busy before the war. Happier times.

Disclaimer: The content on AMAT Investing is strictly for educational and learning purposes. The author is not a licensed financial advisor and holds no formal financial education. This post does not constitute professional financial advice. All investing involves risk of loss. Always conduct your own research and consult a licensed professional before making any investment decisions.