

Weekly Review - 2026-Apr-02
Have we seen "the bottom" or "a bottom"?

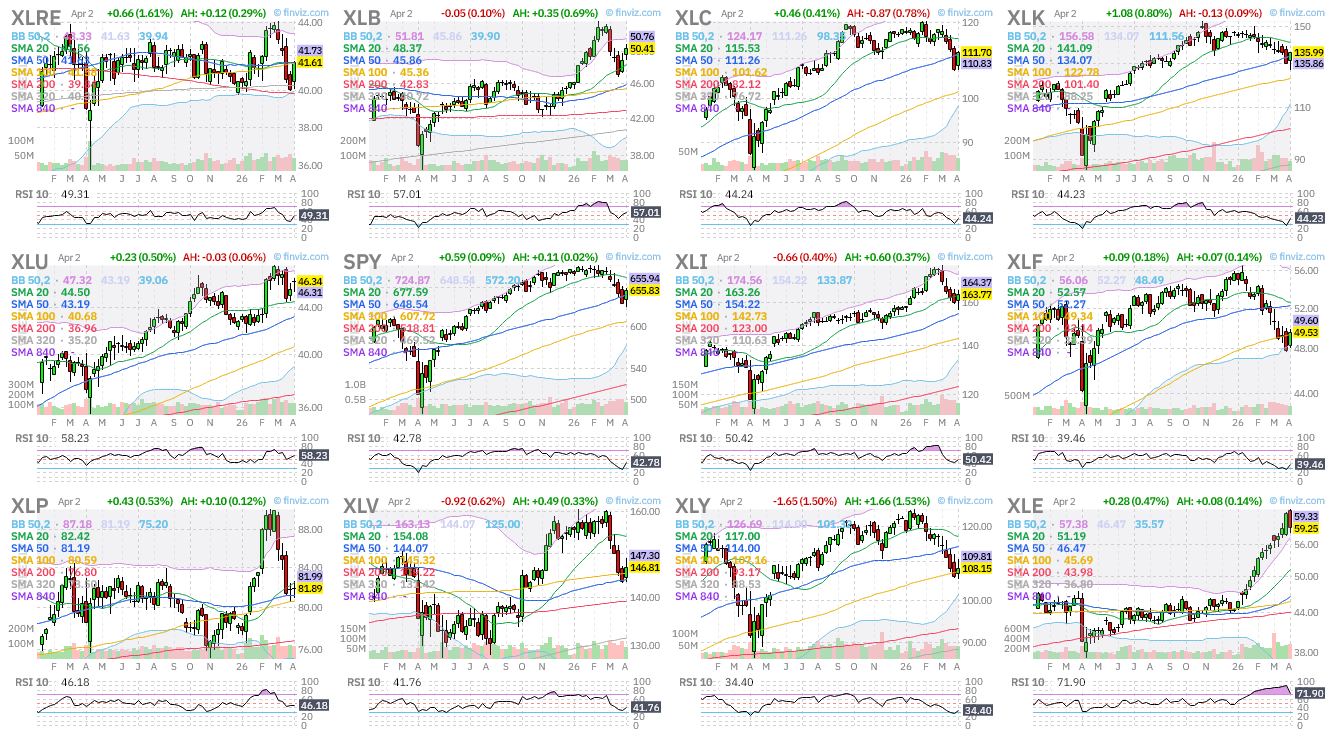
US Cap. Weighted Sectors ordered by weekly performance (desc):
Weekly:
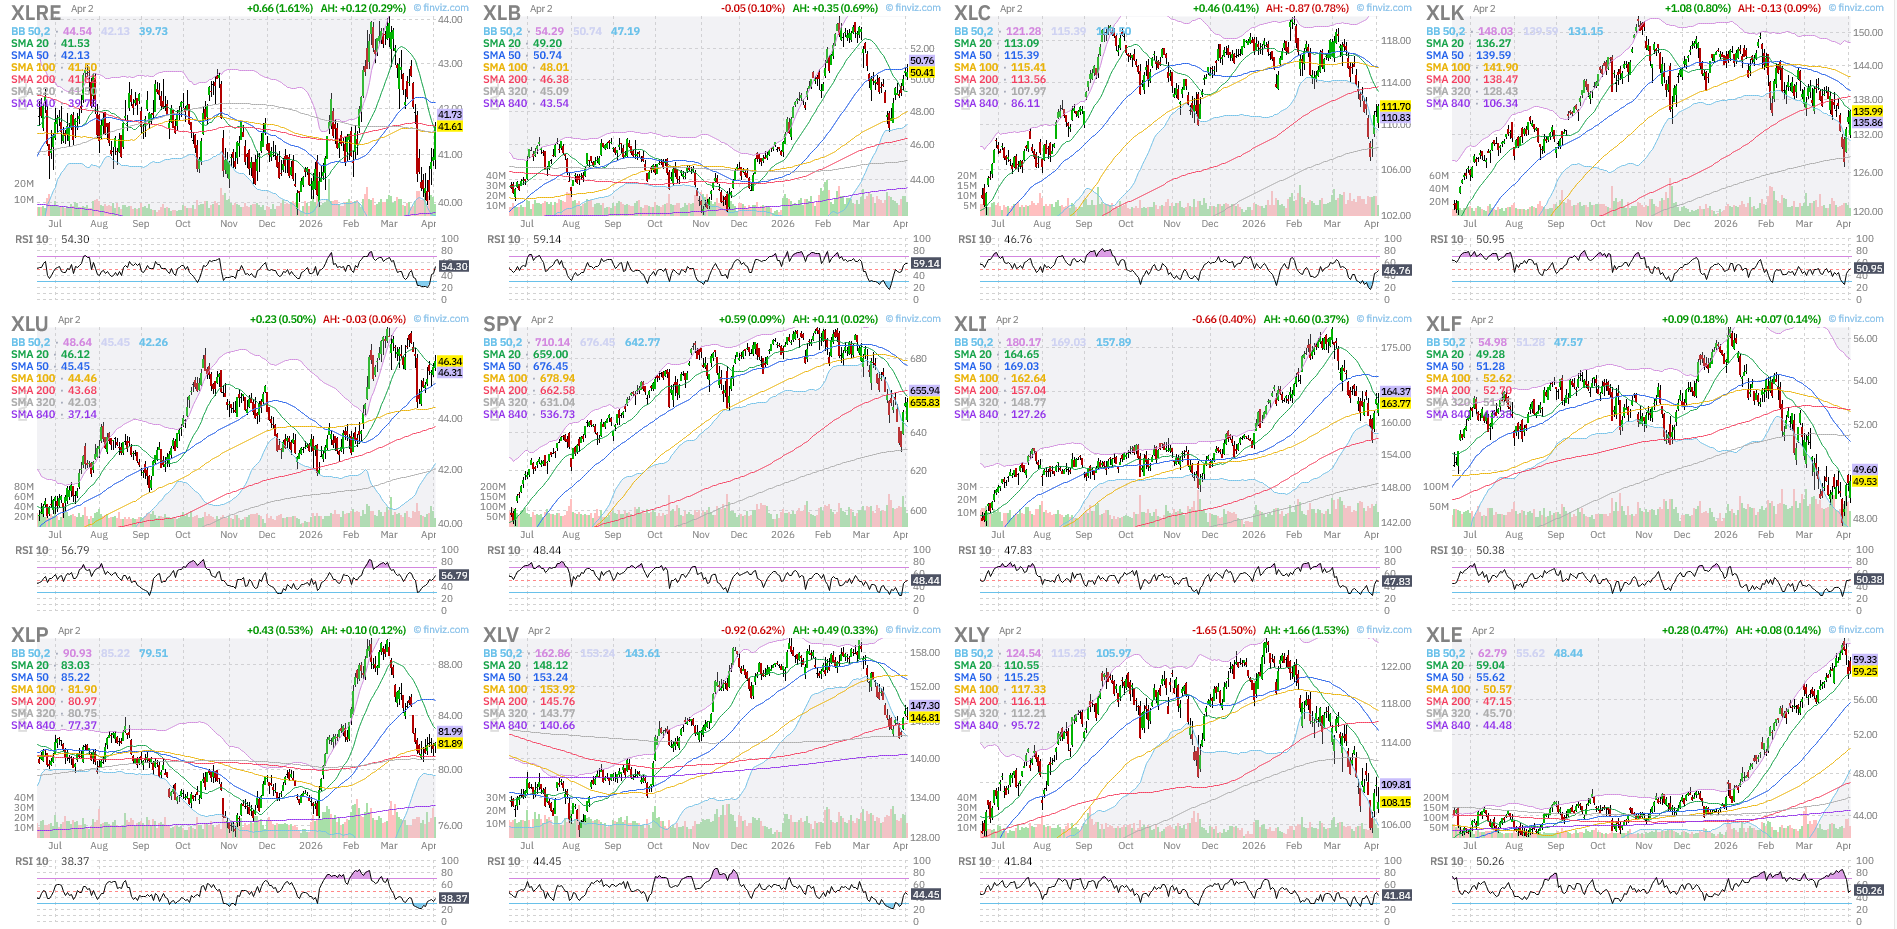
Daily:
Comment: Seems that the S&P has found support at a key, yet quite unknown, SMA, the 320, “coincidently” with the Communications and Technology sectors, the two biggest market sectors:
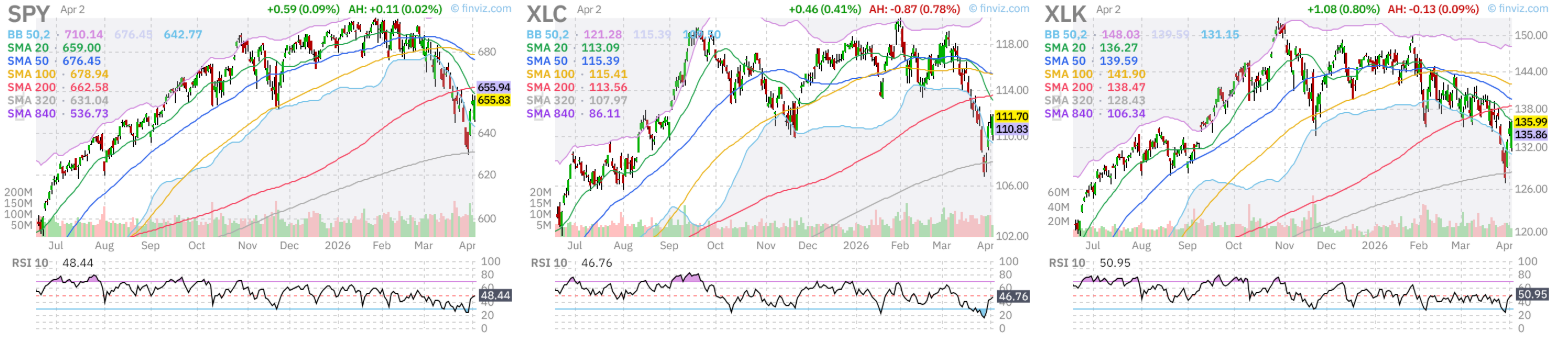
Bouncing off the SMA 320 is quite a rare event, as normally the market does not retrace that back down. I took this opportunity to add some capital to the “Hold Forever Portfolio” positions. At this moment in time nobody knows if we have seen “the bottom” but we know that we have seen “a bottom” thanks to that SMA 320 line.
Why is it happening? – Level 1
Economic Data: Production: ISM PMI vs. SPX
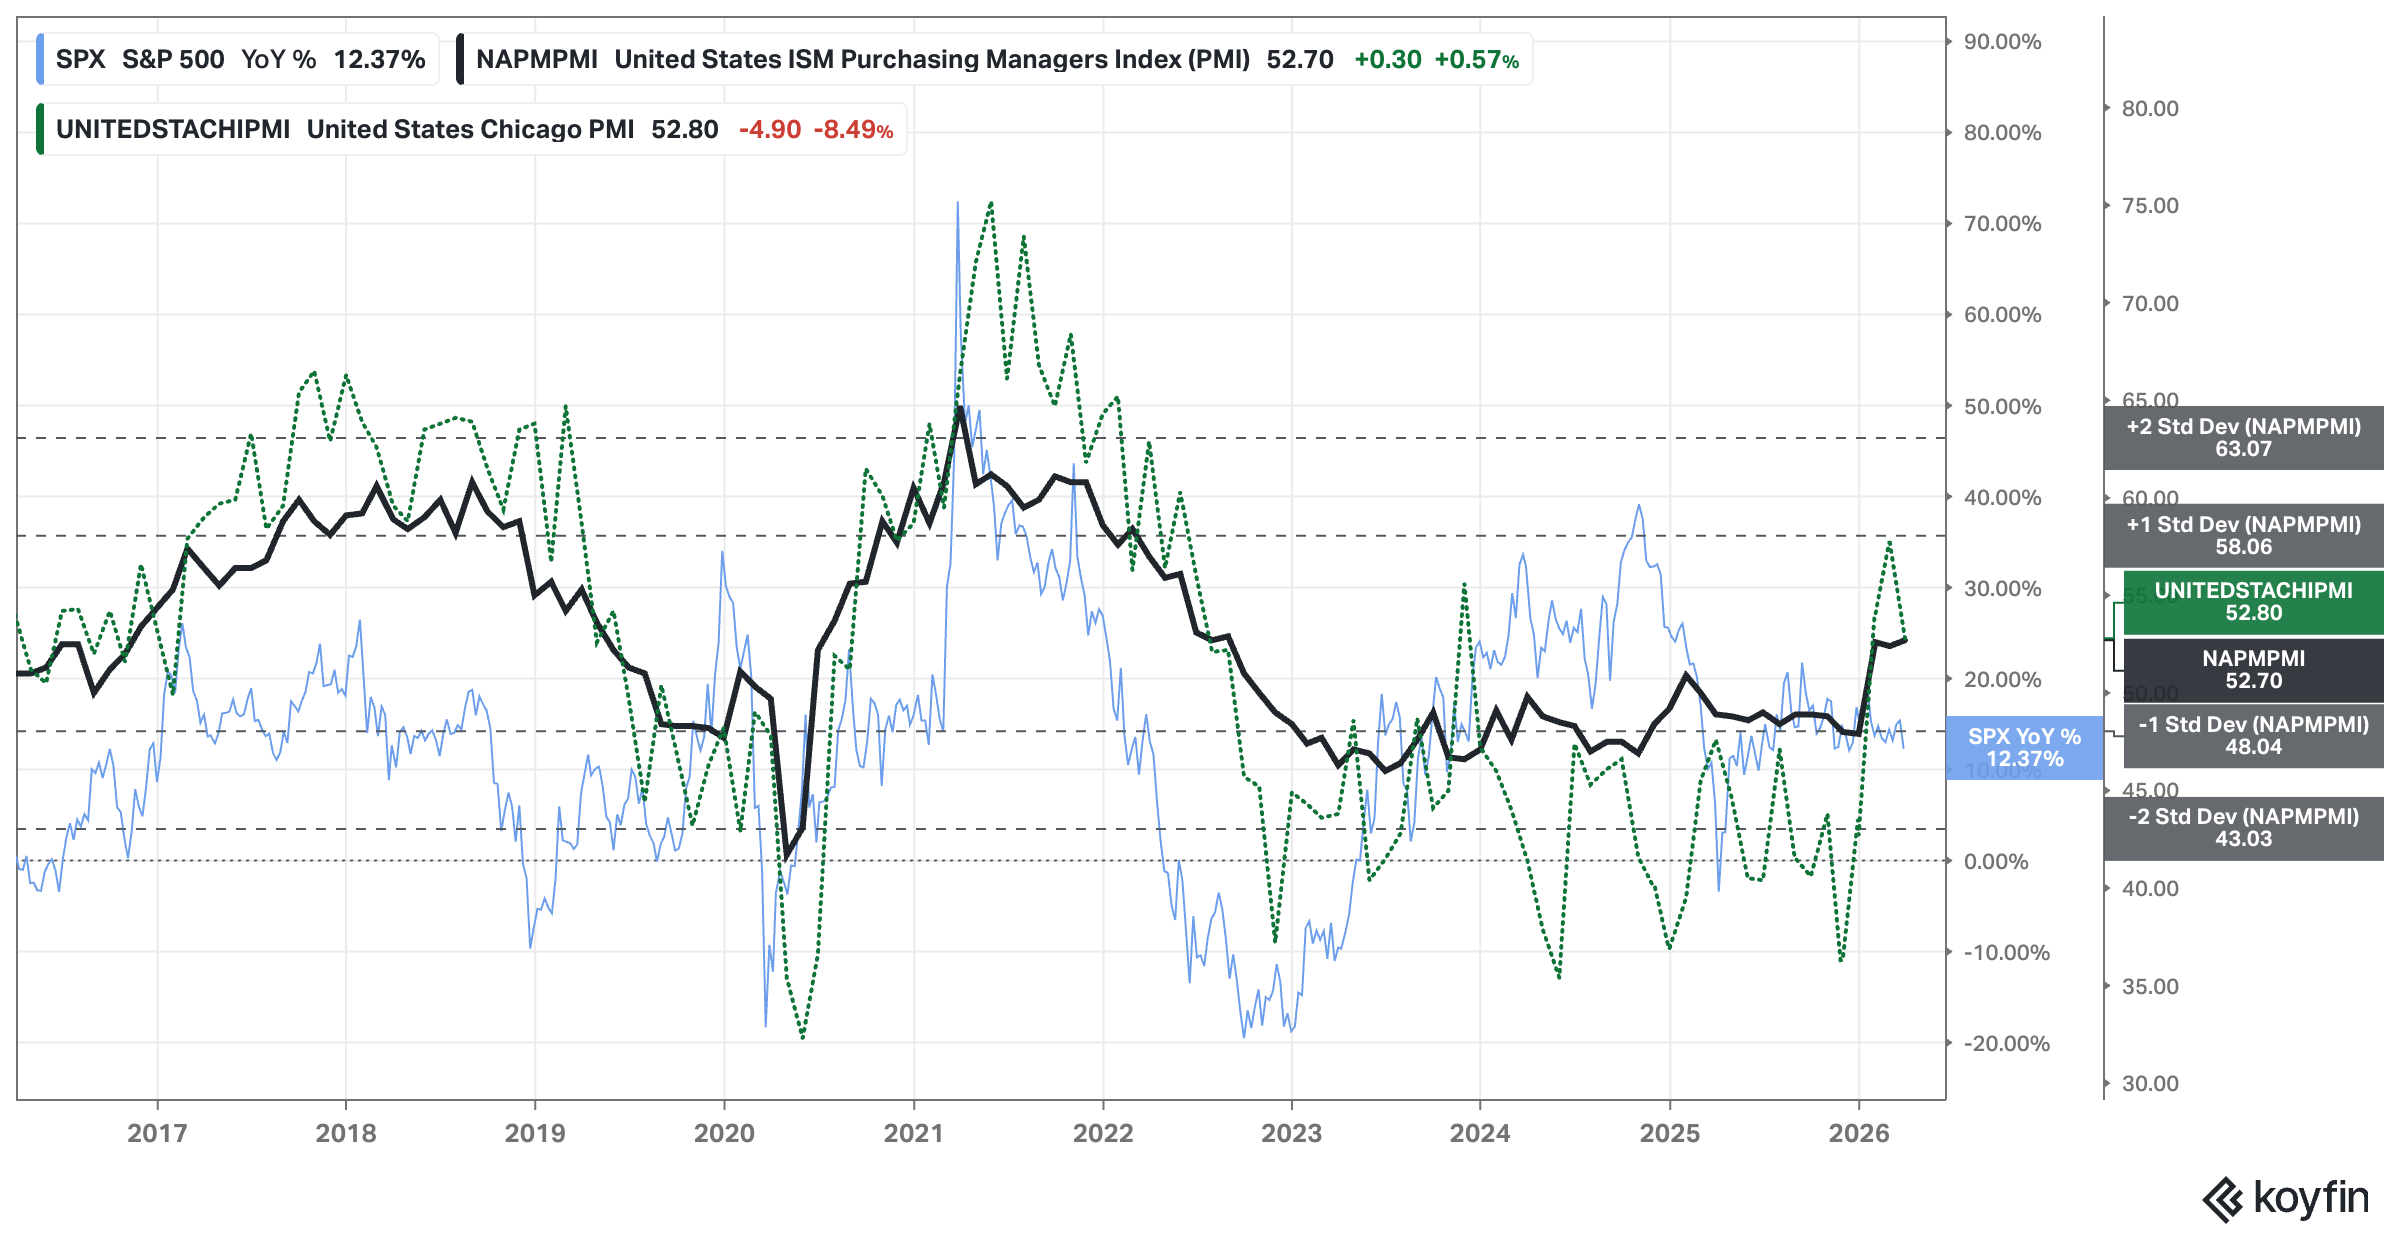
Analysis: Chicago PMI new number lower than previous. ISM slightly higher but not by much. I keep the bullish outlook as the values are still above 50 and we come from lower reads in previous readings.
Outlook: Bullish
Why is it happening? – Level 1
Economic Data: Production: Dallas & Philadelphia Manufacturing vs. SPX
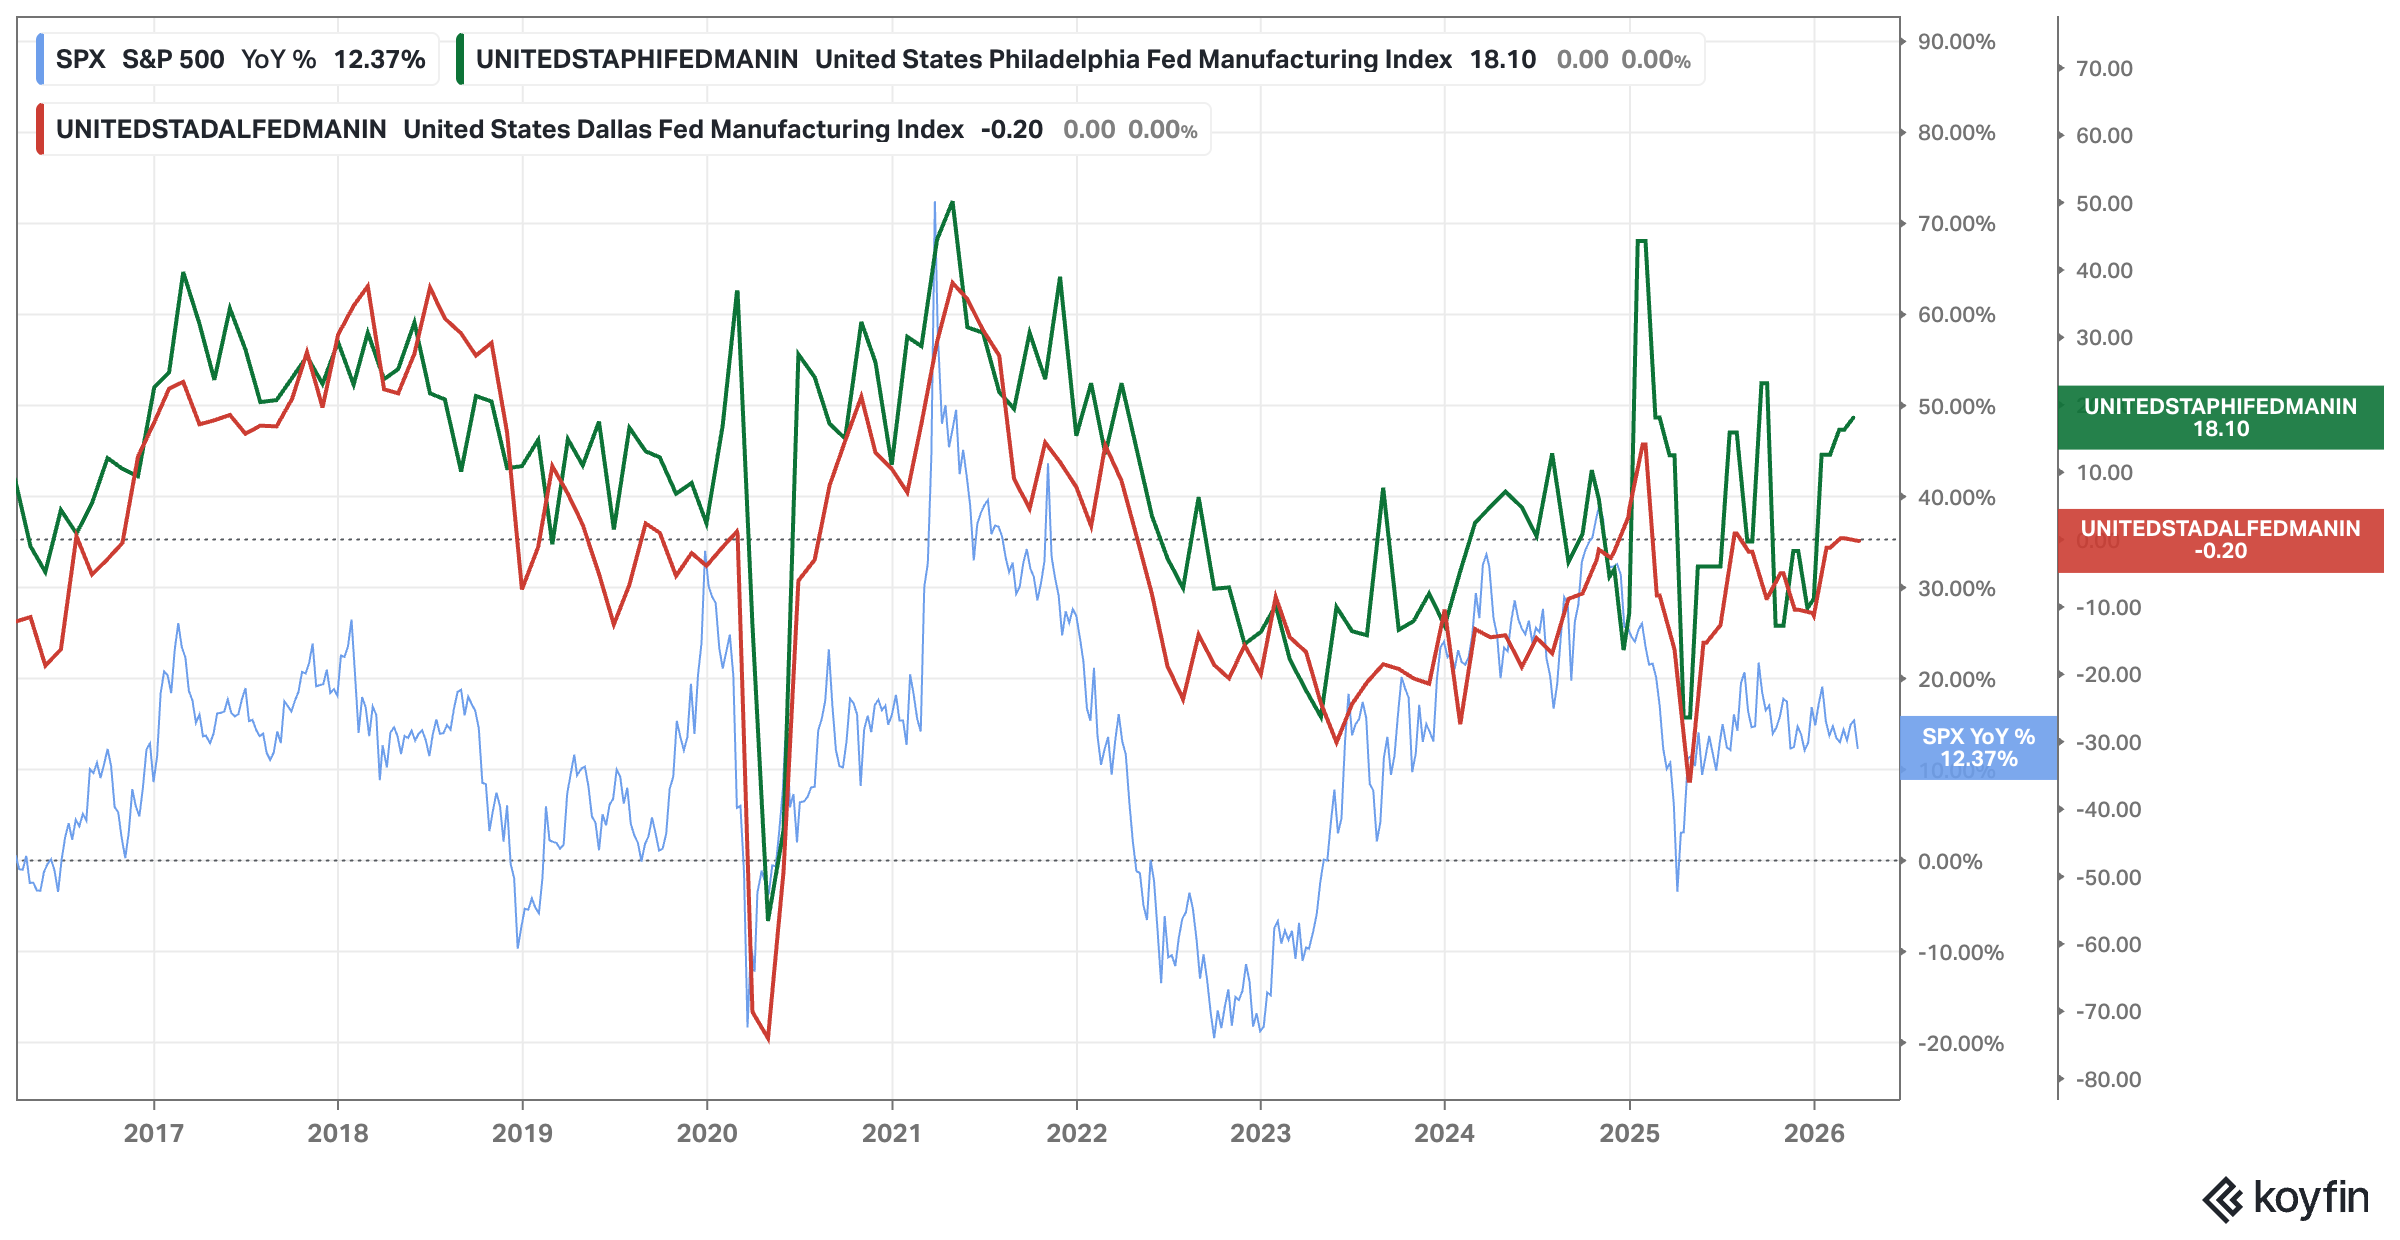
Analysis: Dallas (red) new reading is slightly worse than the previous one but not by much. I leave the outlook unchanged to bullish.
Outlook: Bullish
Why is it happening? – Level 1
Economic Data: Consumption: Consumer Sentiment
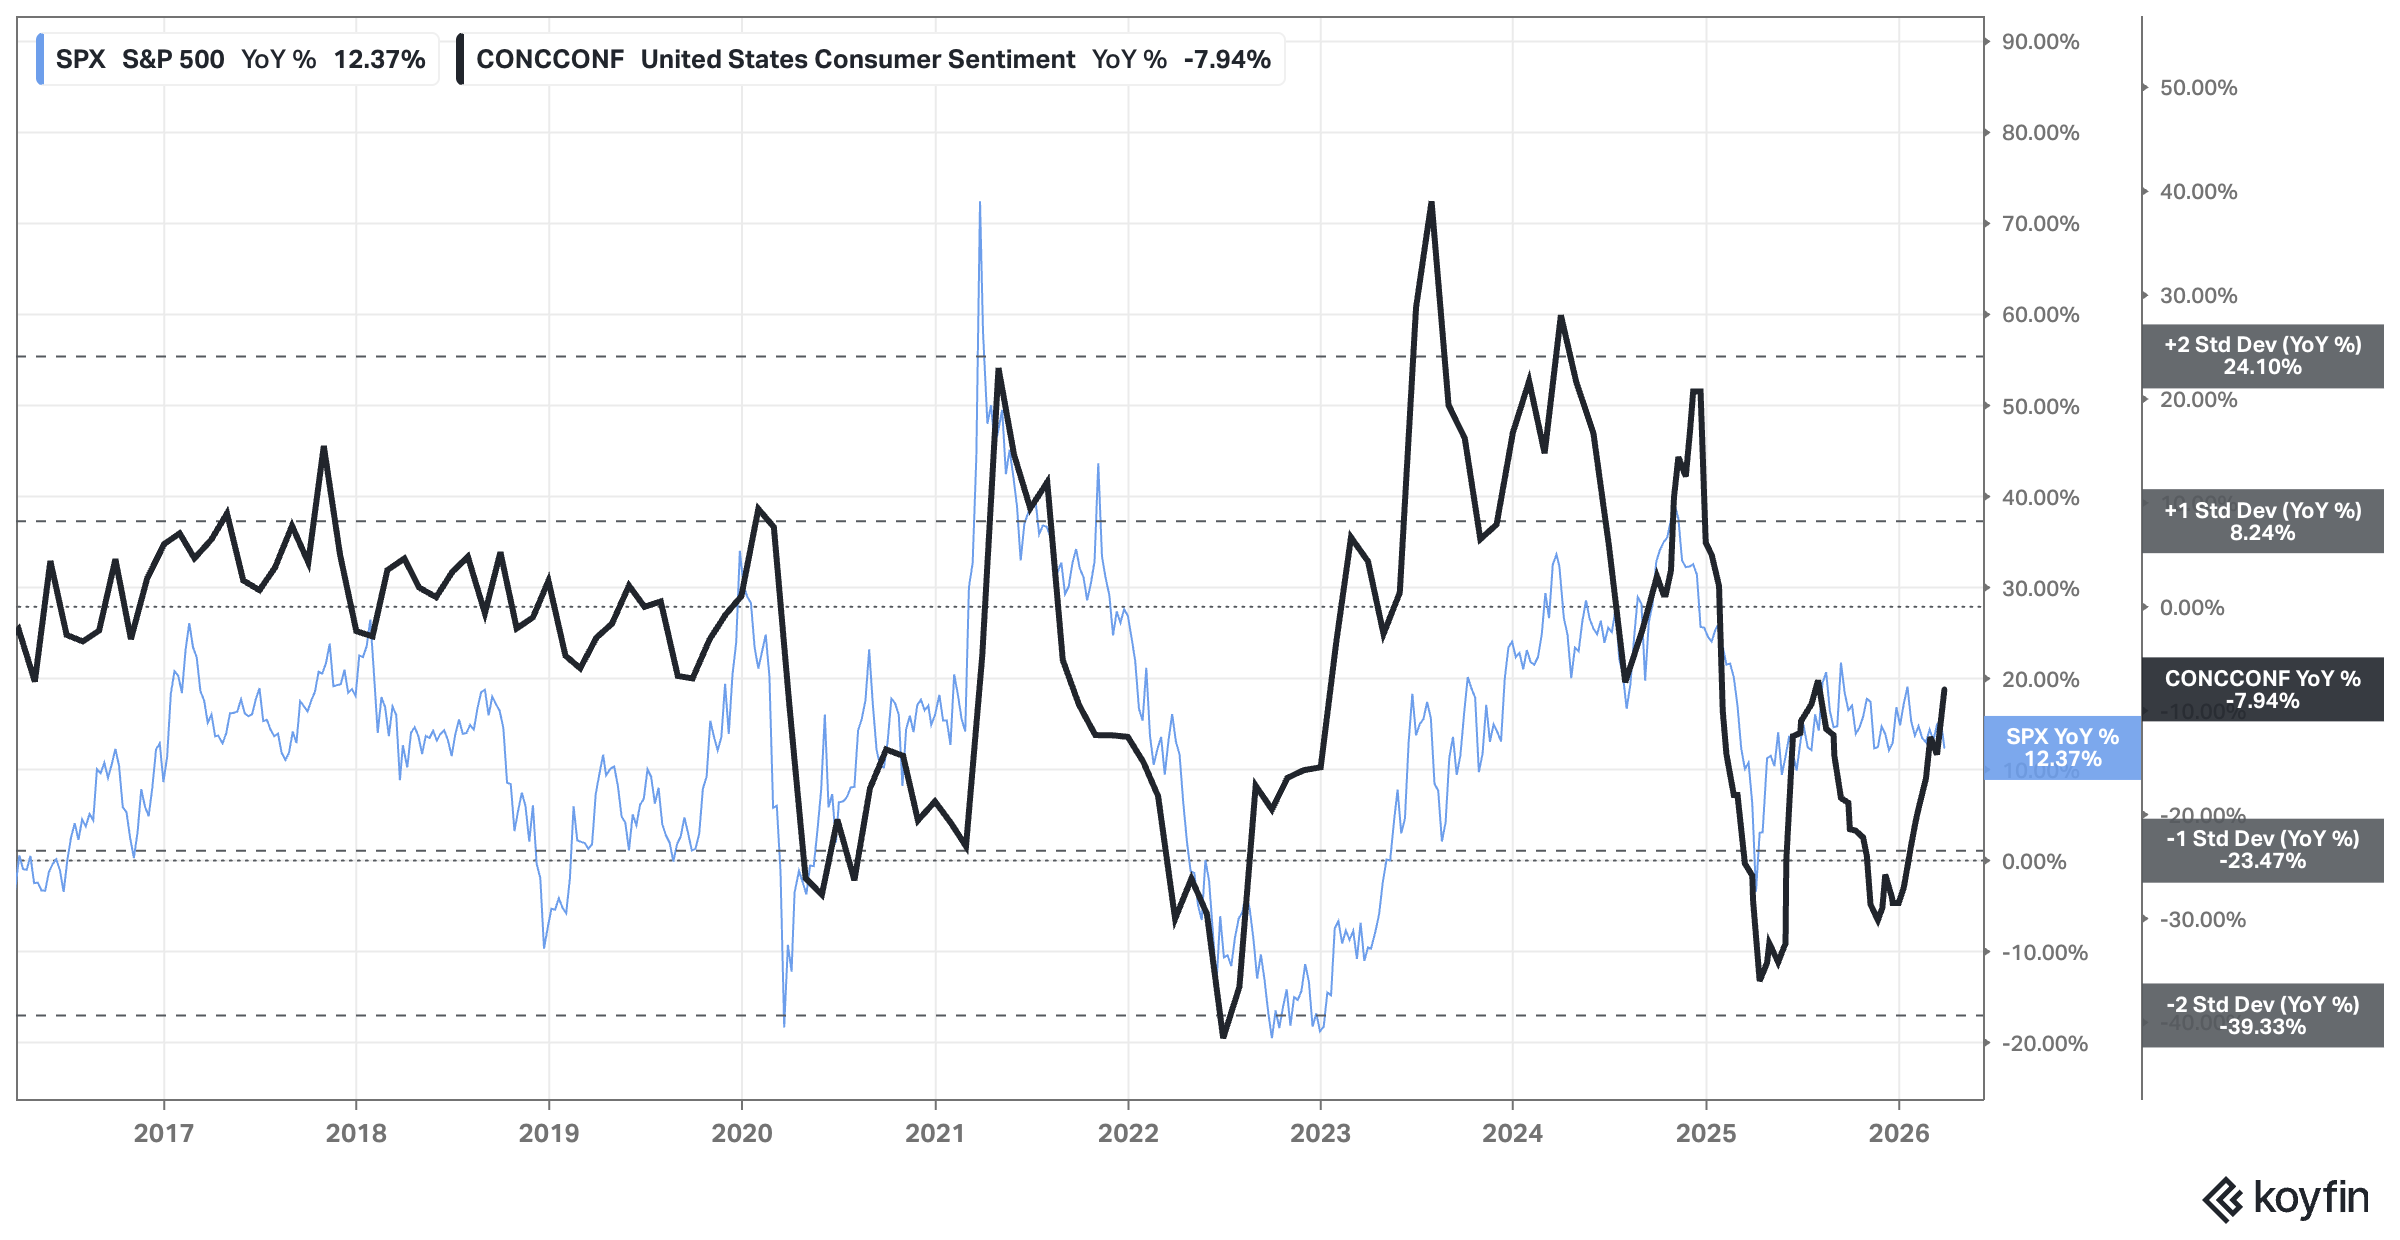
Analysis: No changes since last week.
Outlook: Bullish
Why is it happening? – Level 1
USD & Interest Rates: FED, 2yr, 10yr, and 30yr Rates
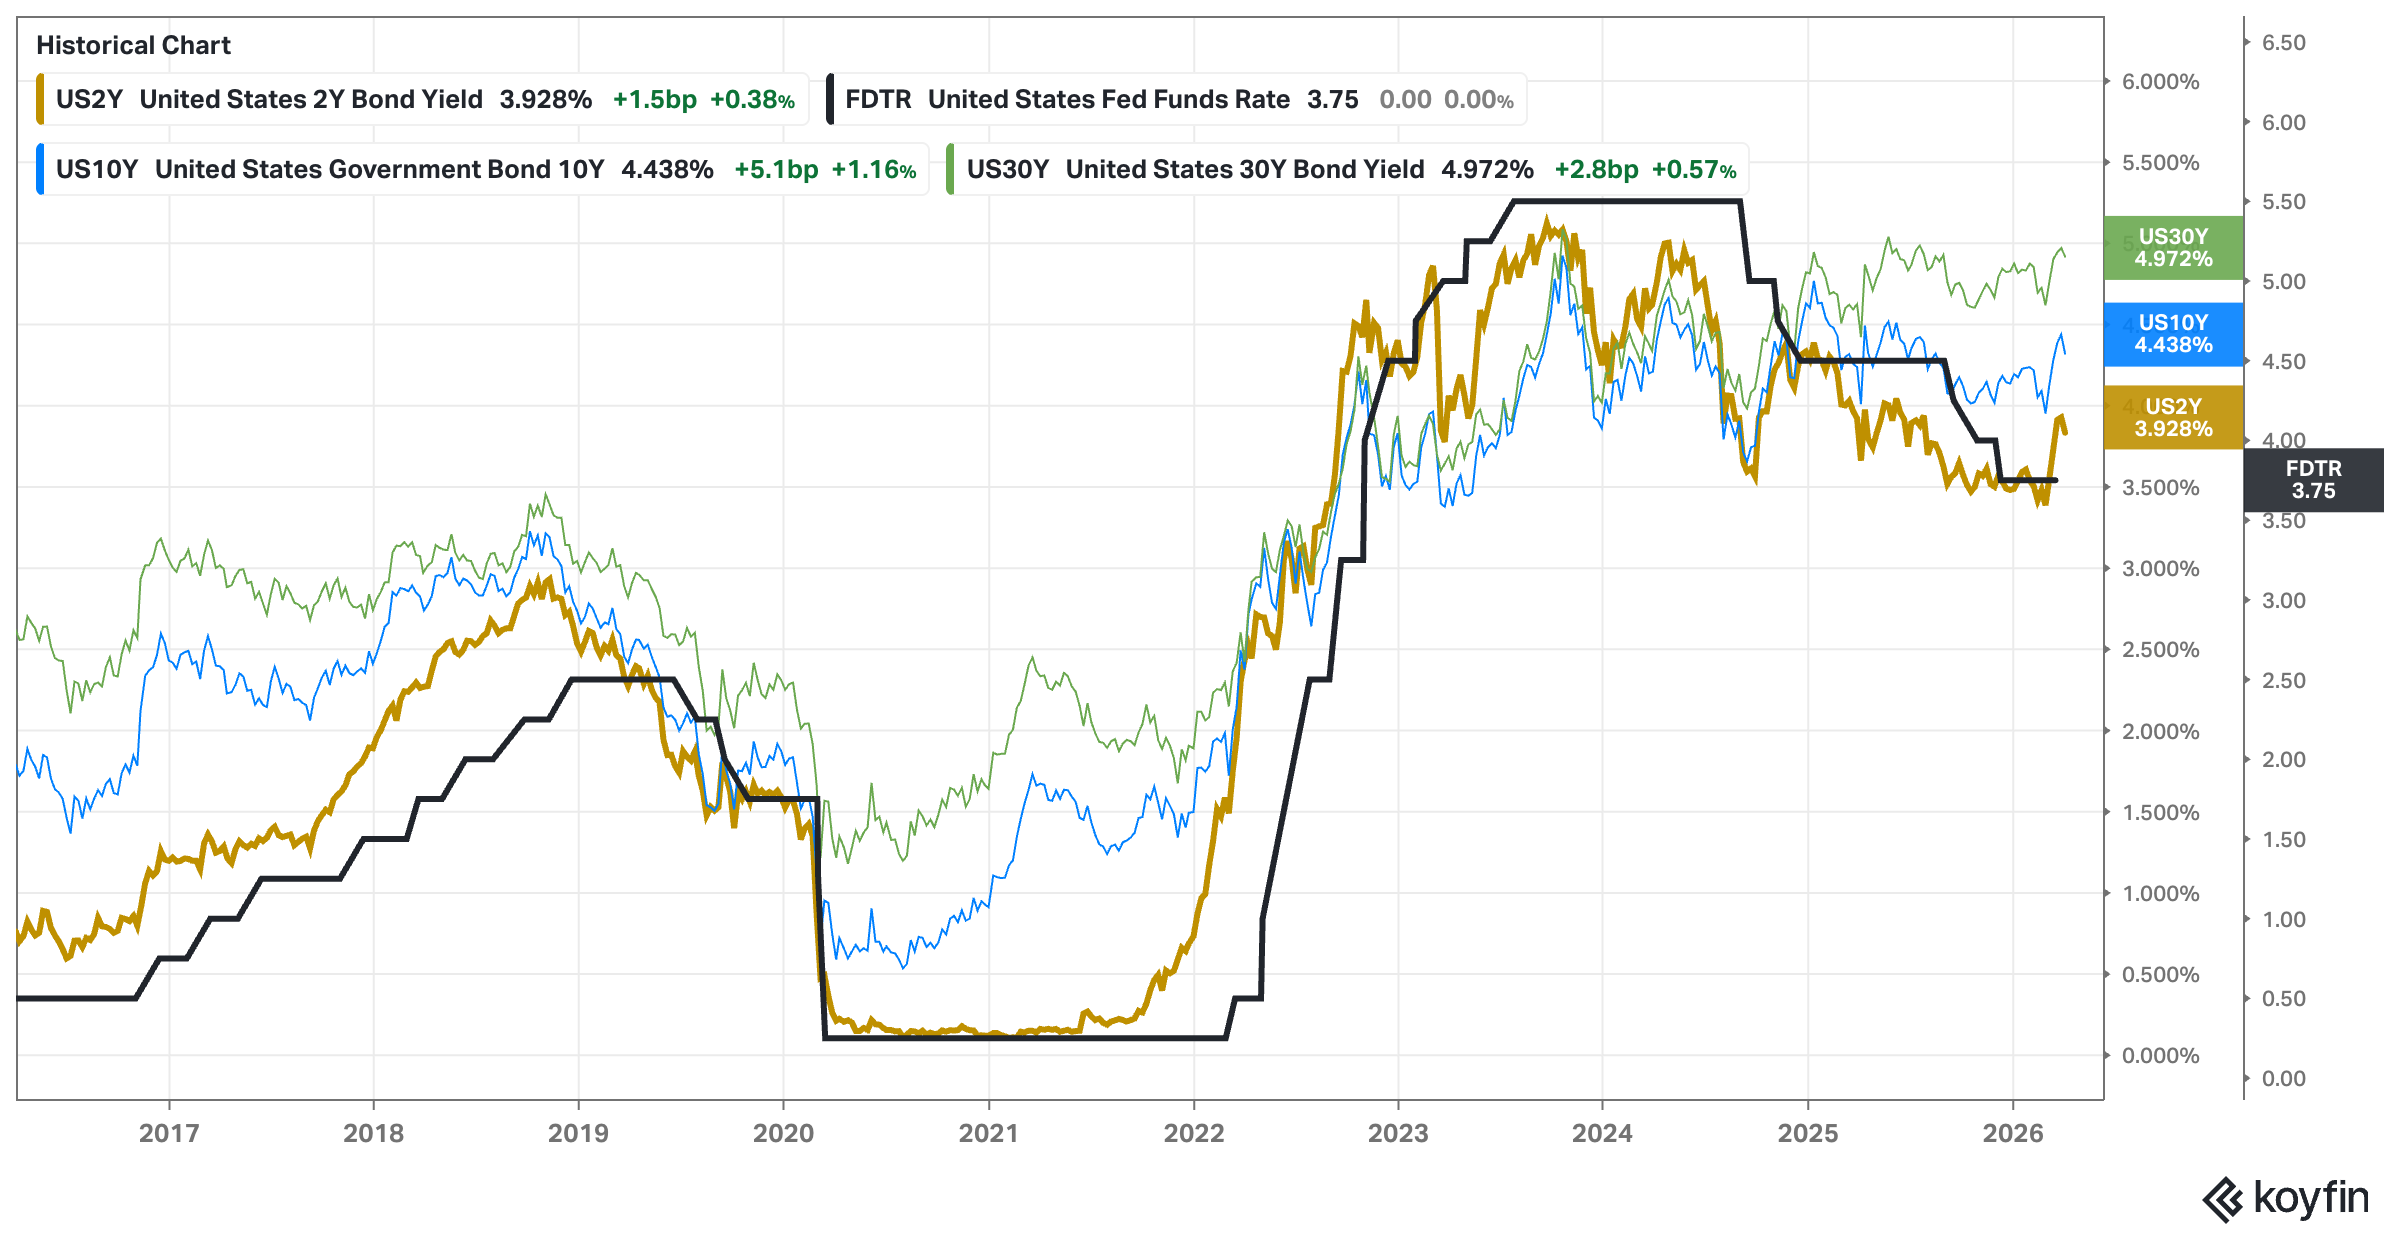
Analysis: Turnaround in rates. We want to see a continuation to lower readings, and quickly, to declare all clear in the bond market.
Outlook: Neutral to Bearish.
Why is it happening? – Level 1
USD & Interest Rates: USD vs EEM and S&P500
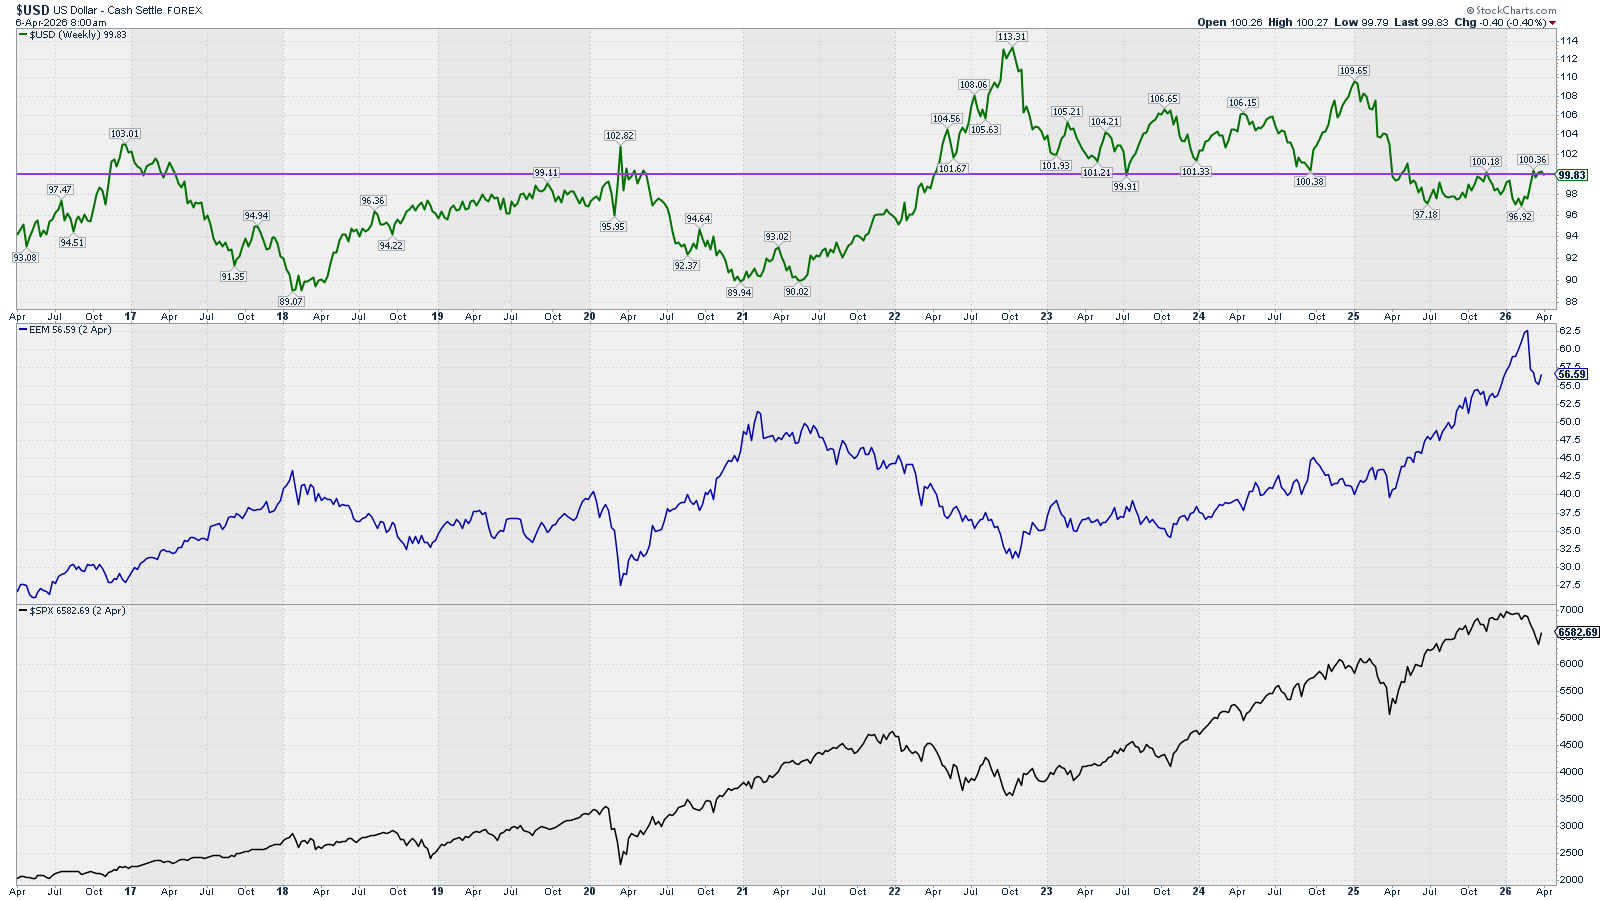
Analysis: USD 100 level resistance is proving to be difficult to break. If the Iran war has a quick resolution we will see a sharp decline in USD and an increase in the EEM index. Until then, we will continue with the Bearish outlook for the EEM index as demand destruction is already taking place amid supply disruption and destruction due to Iran’s war.
Outlook: Bearish (the longer the war the higher the oil & gas disruption)
Why is it happening? – Level 1
Context Investors Sentiment: Credit Spreads
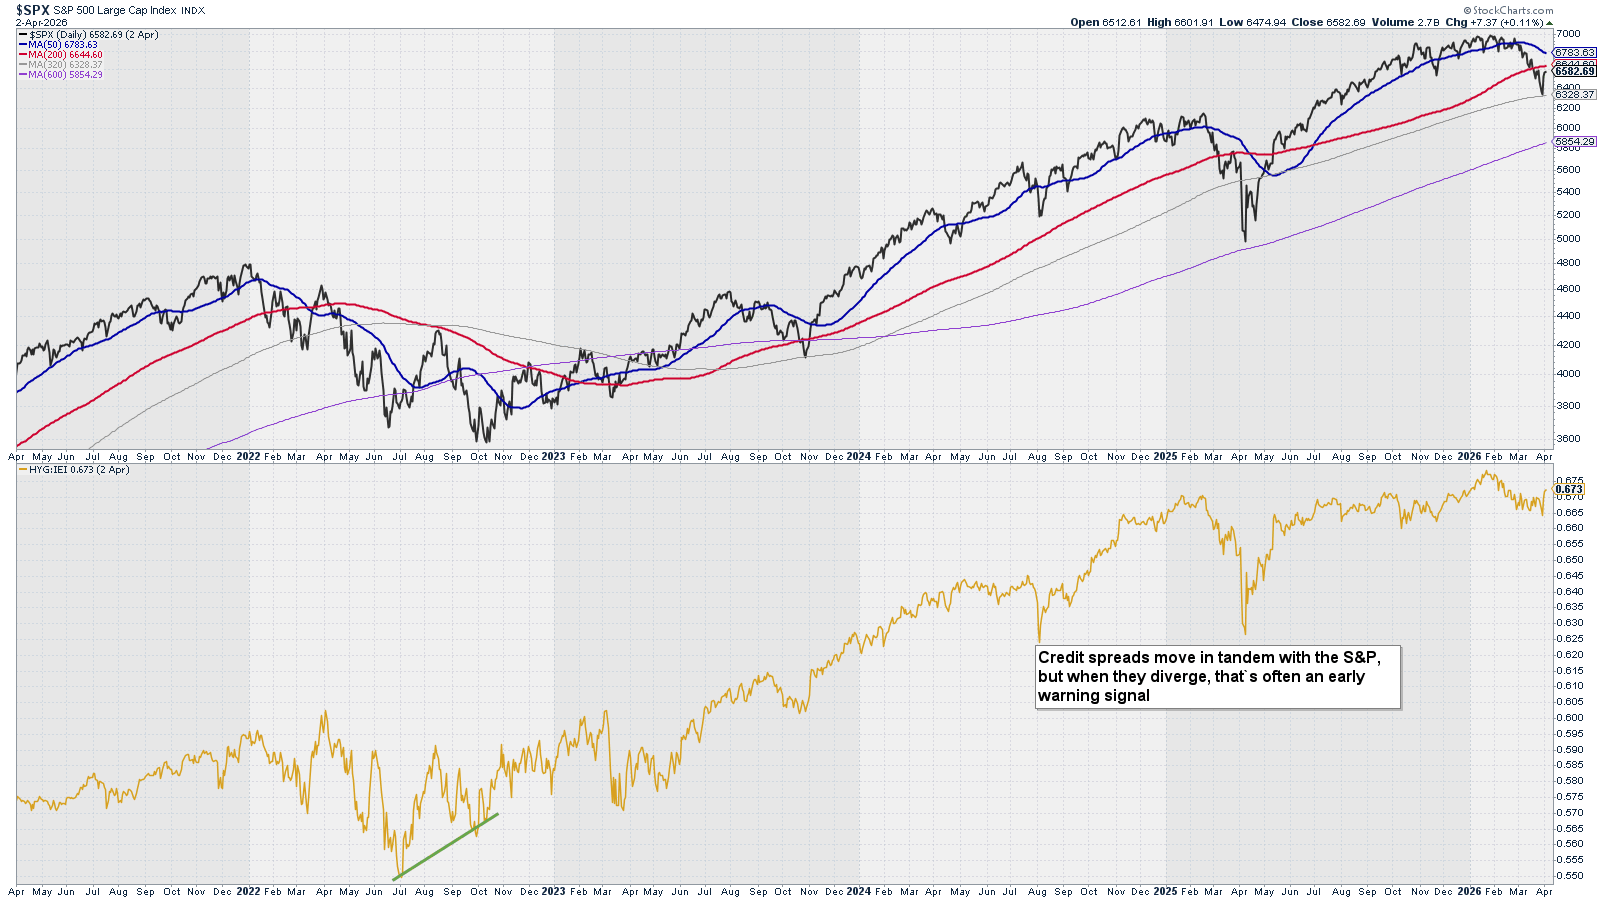
Credit spreads move in tandem with the S&P, but when they diverge, that’s often an early warning signal.
Analysis: Spreads raised, this time together with the market. Seeing this correlation is good for future market movements.
Outlook: Neutral
Level 1 Summary
Economic Data (long-term): Bullish to Neutral
USD & Interest Rates: Bearish
Investors Sentiment: Neutral
What is happening? – Level 2
Price Action: SPX – Trend – 20 years
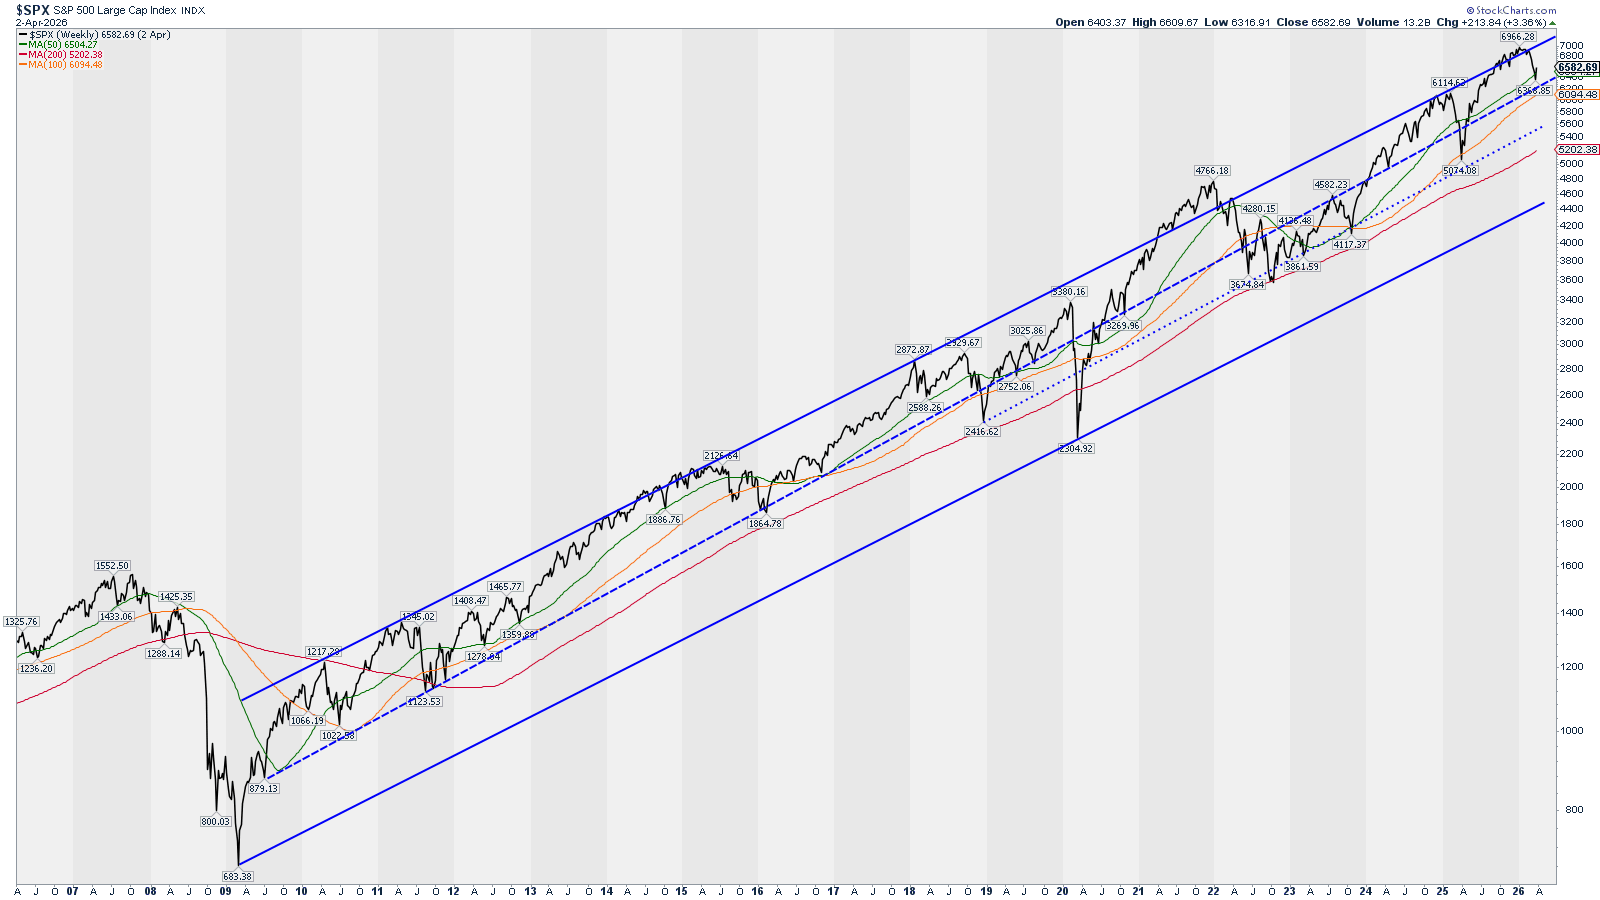
Analysis: Price found support at the Weekly SMA 50 (green). Support at this level occurred multiple times in the past, and could well be a significant bottom. Yet, stronger areas of support are below these levels, for example the middle of the channel (blue) and the Weekly SMA 100 (orange). These two levels are no much further below and could be reached on a “flush” bearish move that could mark “the bottom”.
Outlook: Bearish to Neutral
What is happening? – Level 2
Price Action: RSP – Trend – Weekly
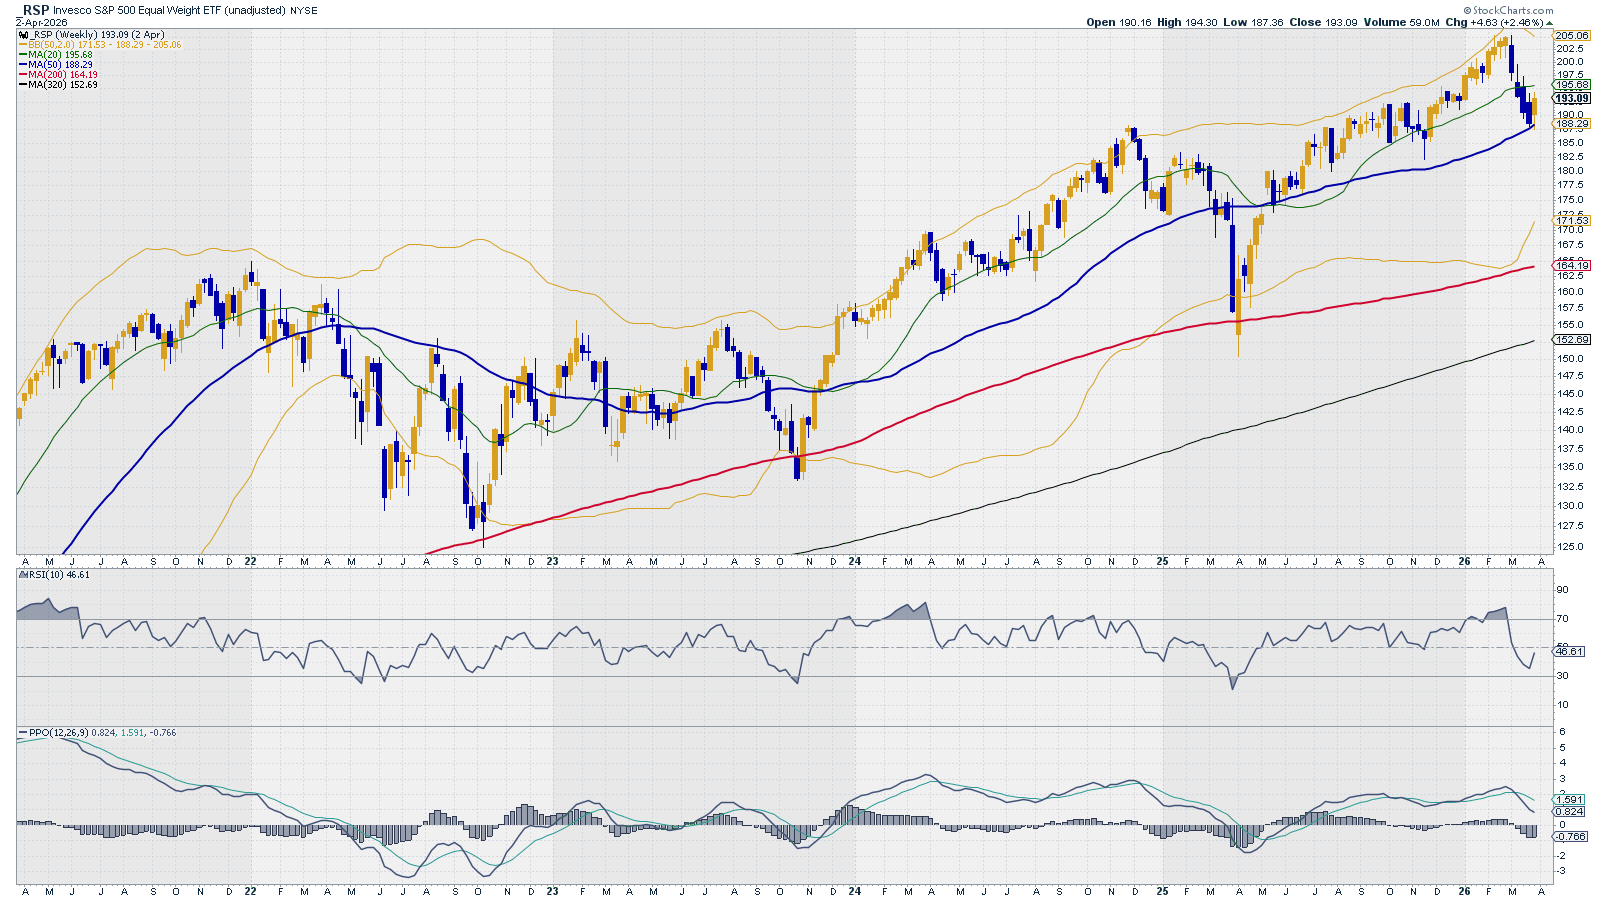
Analysis: Price bounced off Weekly SMA 50 (blue), yet RSI and PPO are not supporting that this is “the bottom”. We would prefer seeing PPO in negative territory to know that we have already inflicted enough damage to the market to call it the bottom.
Outlook: Bearish
What is happening? – Level 2
Price Action: RSP – Trend – Daily
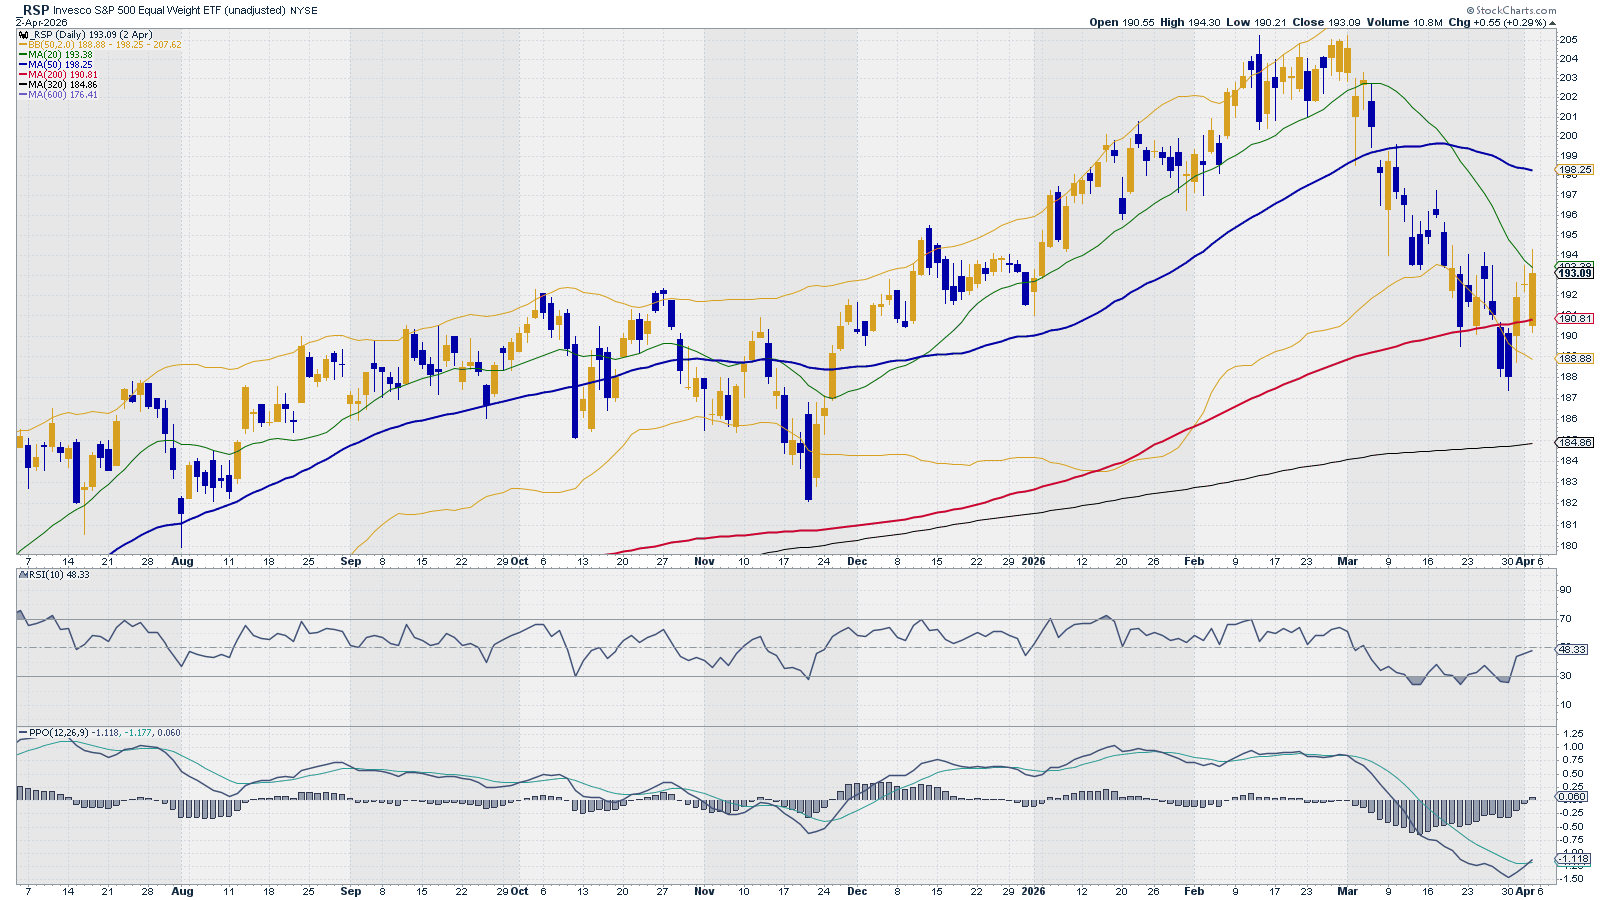
Analysis: Contrary to the weekly chart, the daily chart shows a great bottom setup, with multiple oversold RSI reads and a bullish cross in negative territory in PPO. Price broke below SMA 200 (red) to recover above it and even attempting to break above SMA 20 (green). I’m changing the outlook from Bearish to Neutral to Bullish.
Outlook: Neutral to Bullish
What is happening? – Level 2
Breadth & Volatility: % Stocks above 200 SMA vs. RSP
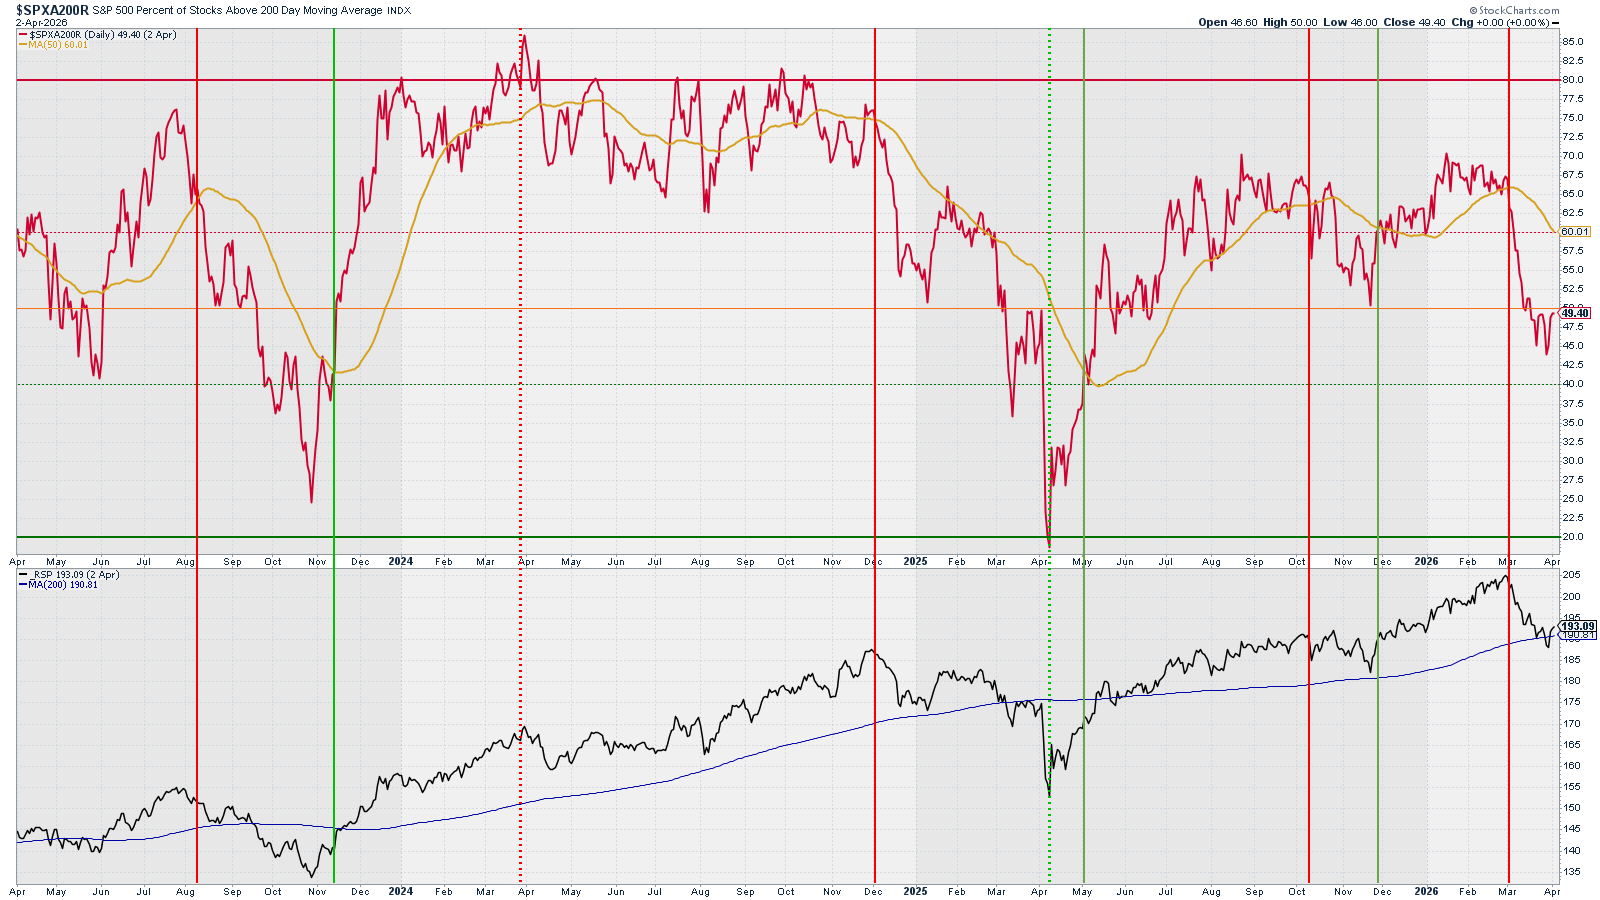
Analysis: Recovery from last week’s 44% value to this week’s 49%.
Outlook: Bearish
What is happening? – Level 2
Breadth & Volatility: RSP and % Stocks above 200, 50, and 20 SMA
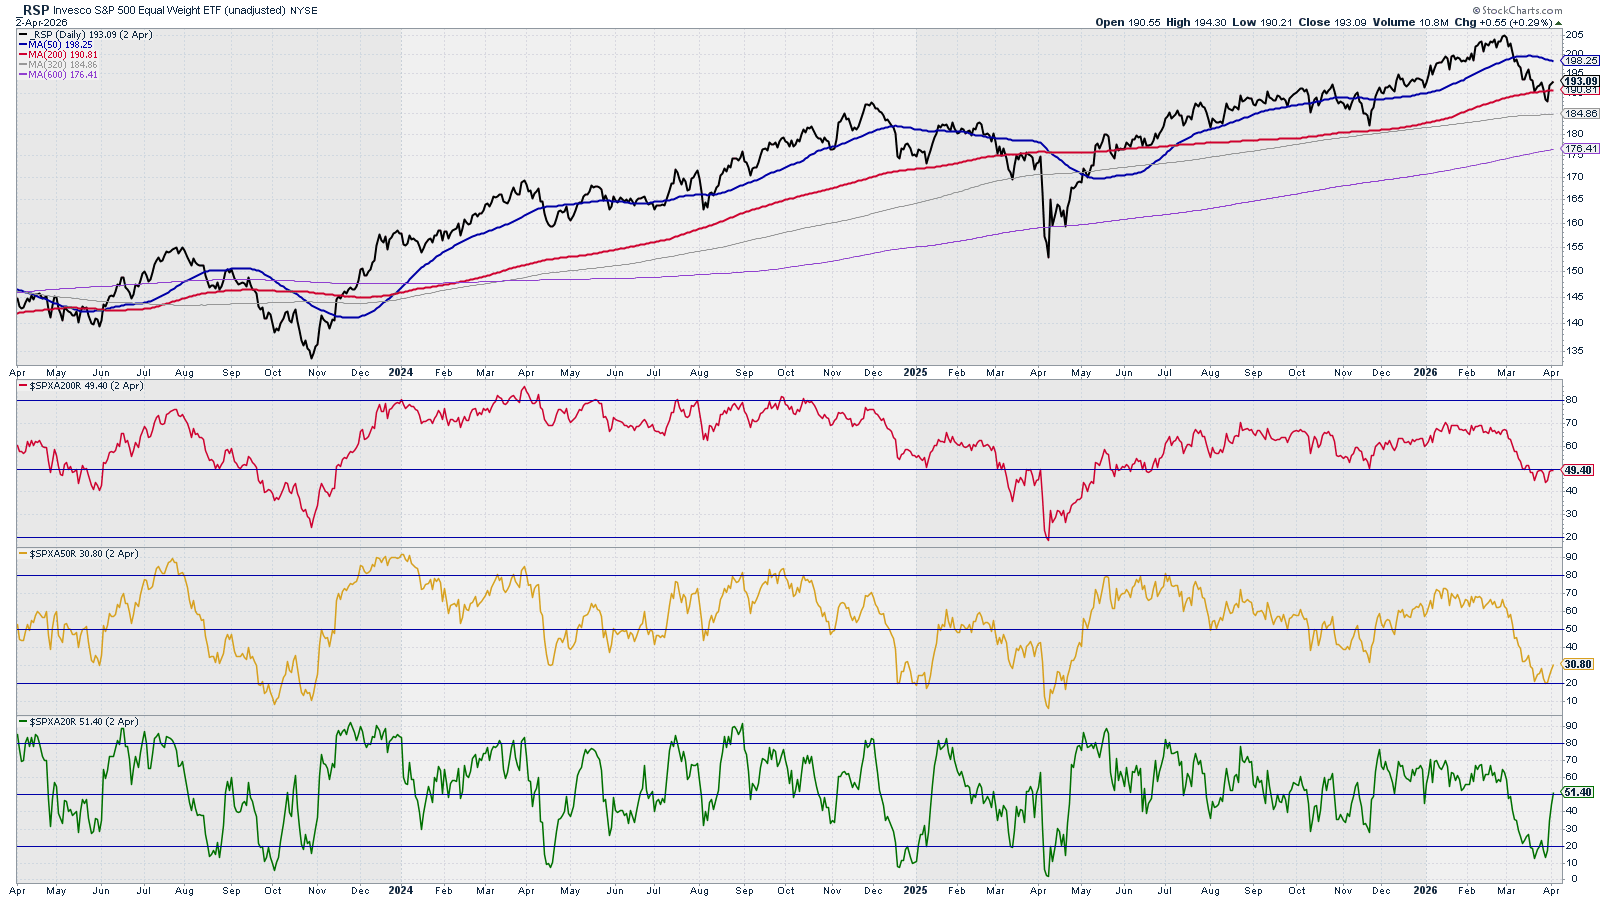
Analysis: Last week, we saw how % SMA 20 (green) went to oversold territory. This could explain this week’s rally. We know that this indicator can change quickly and it could be used as a frequent signal to enter/exit index positions (SPY and RSP). The % SMA 50 is signalling a rare buy opportunity. It may not be “the bottom” (that could never happen) but definitely is a great place to enter the market. % SMA 200 broke below 50% level, a level that is significant and offered support before to the overall market. % SMA 200 could break above the 50% level as the market is aligning few bullish signals:
a) Price support at daily SMA 320
b) Daily RSI and PPO bullish signals
c) % SMA 20 and 50 in oversold territories
Outlook: Neutral to Bullish.
What is happening? – Level 2
Breadth & Volatility: Bullish Pct. Index & McClellan Summation Index
Analysis: Both signals in clear bear territory. Both signals saw the bearish action stopping this week. Will this be enough to turn them around?
Outlook: Bearish
What is happening? – Level 2
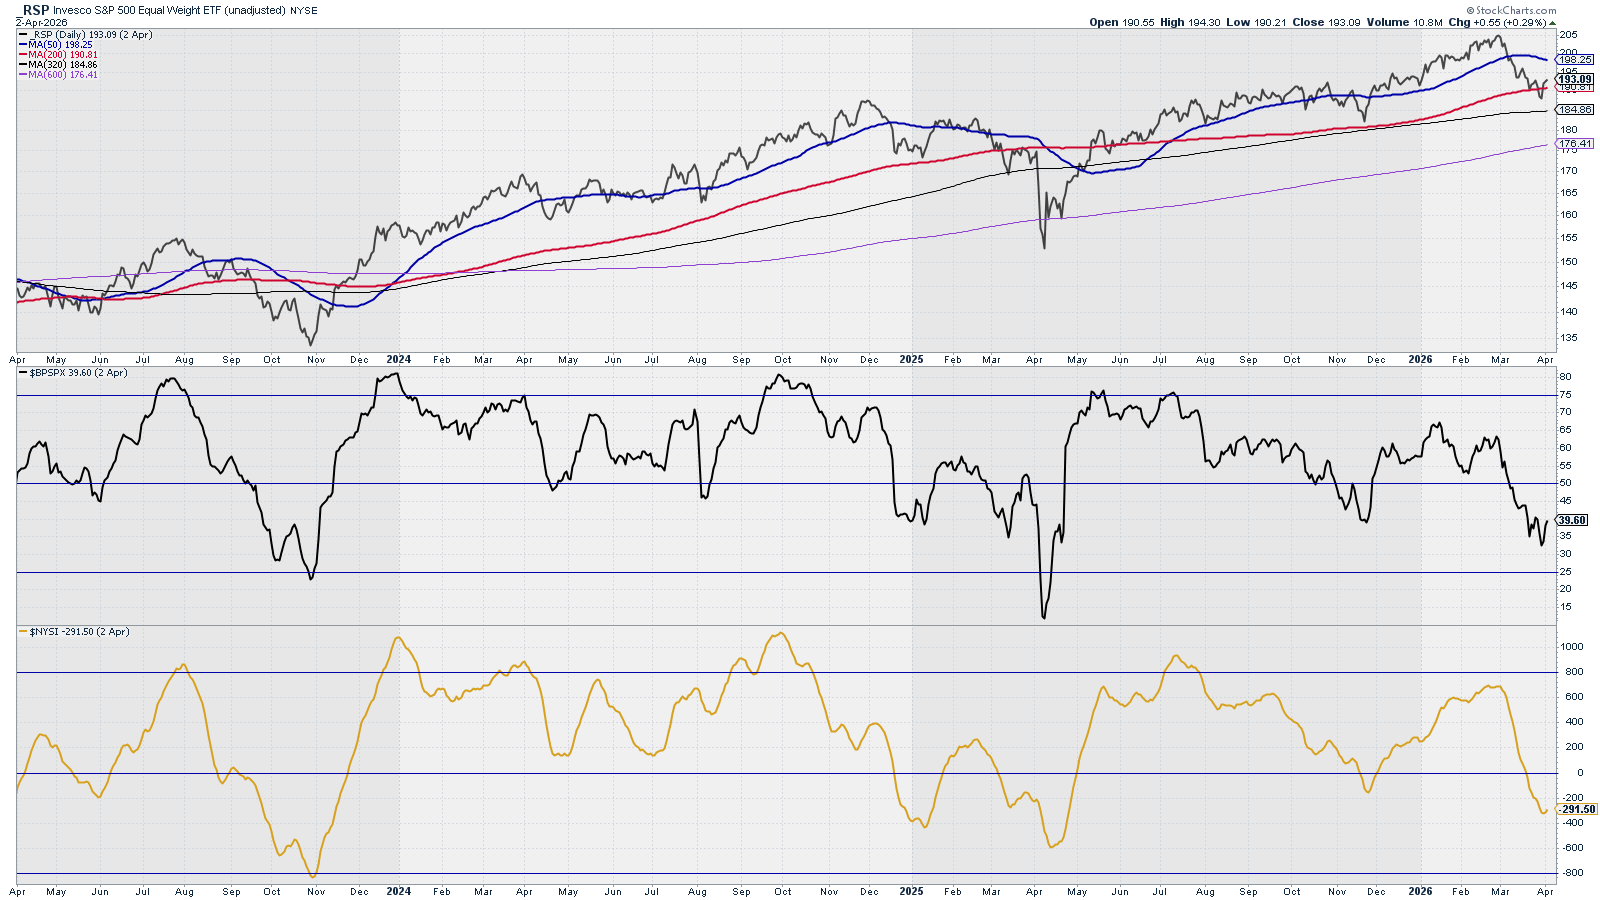
Breadth & Volatility: Ratio Low Volatility Stocks / SPY vs. SPY & RSP
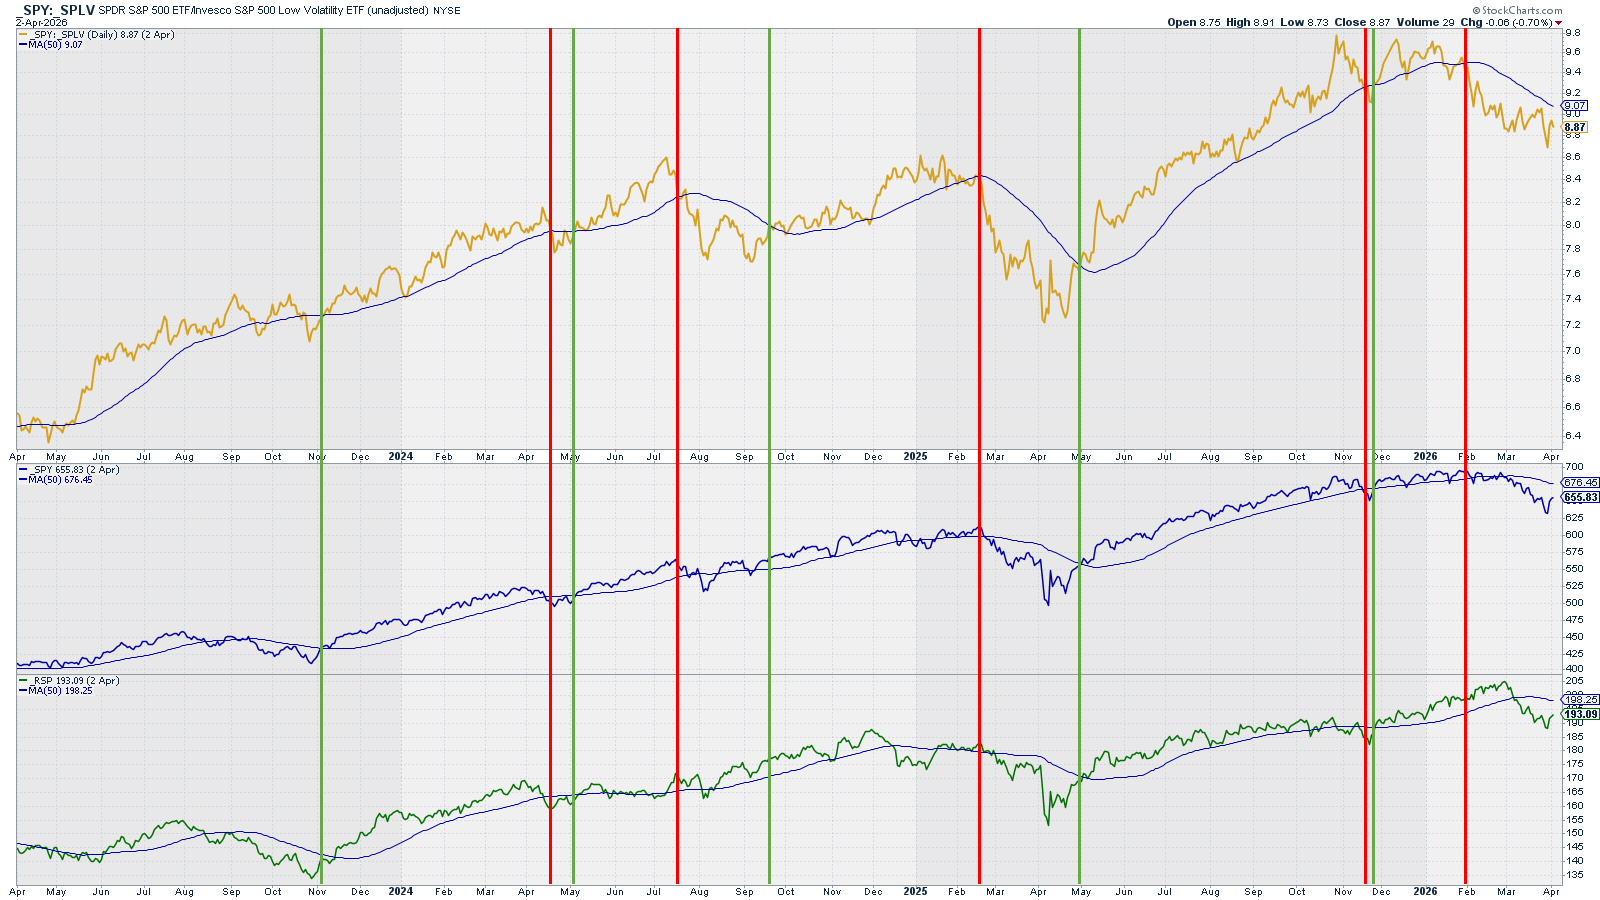
Analysis: Still on bearish territory (signal below its Daily SMA 50).
Outlook: Bearish
What is happening? – Level 2
Breadth & Volatility: New Highs vs. SPY & RSP
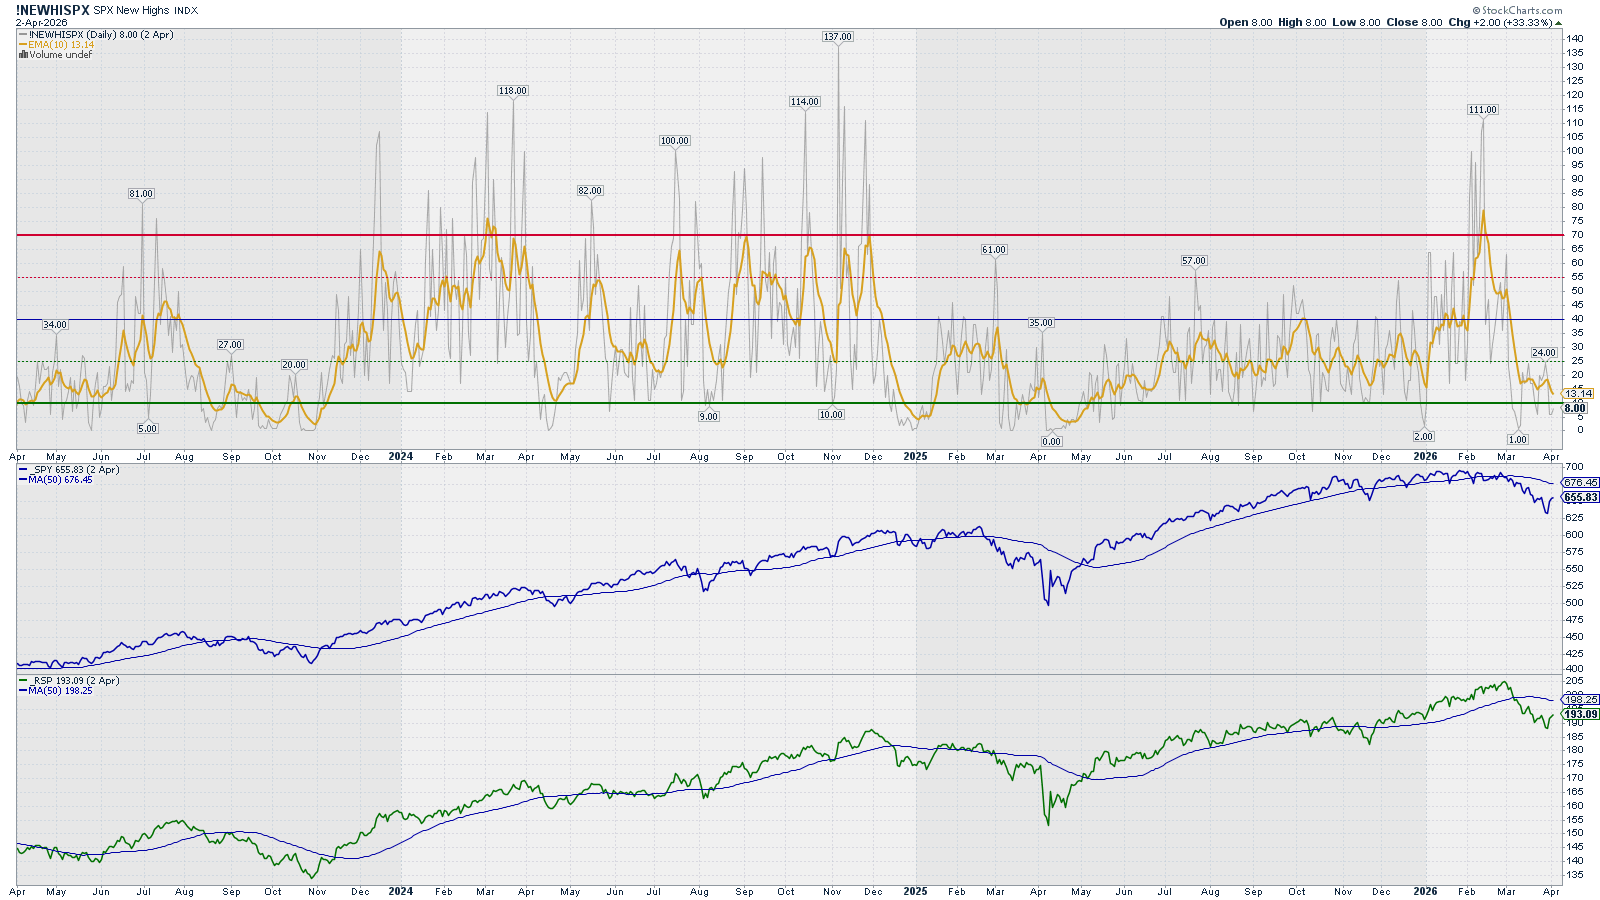
Analysis: New Highs have decrease from 24 to 8 this week. The market is still not flashing a bottom pattern with the New Highs SMA repeatedly below level 10.
Outlook: Bearish
What is happening? – Level 2
Breadth & Volatility: VIX vs. SPY & RSP
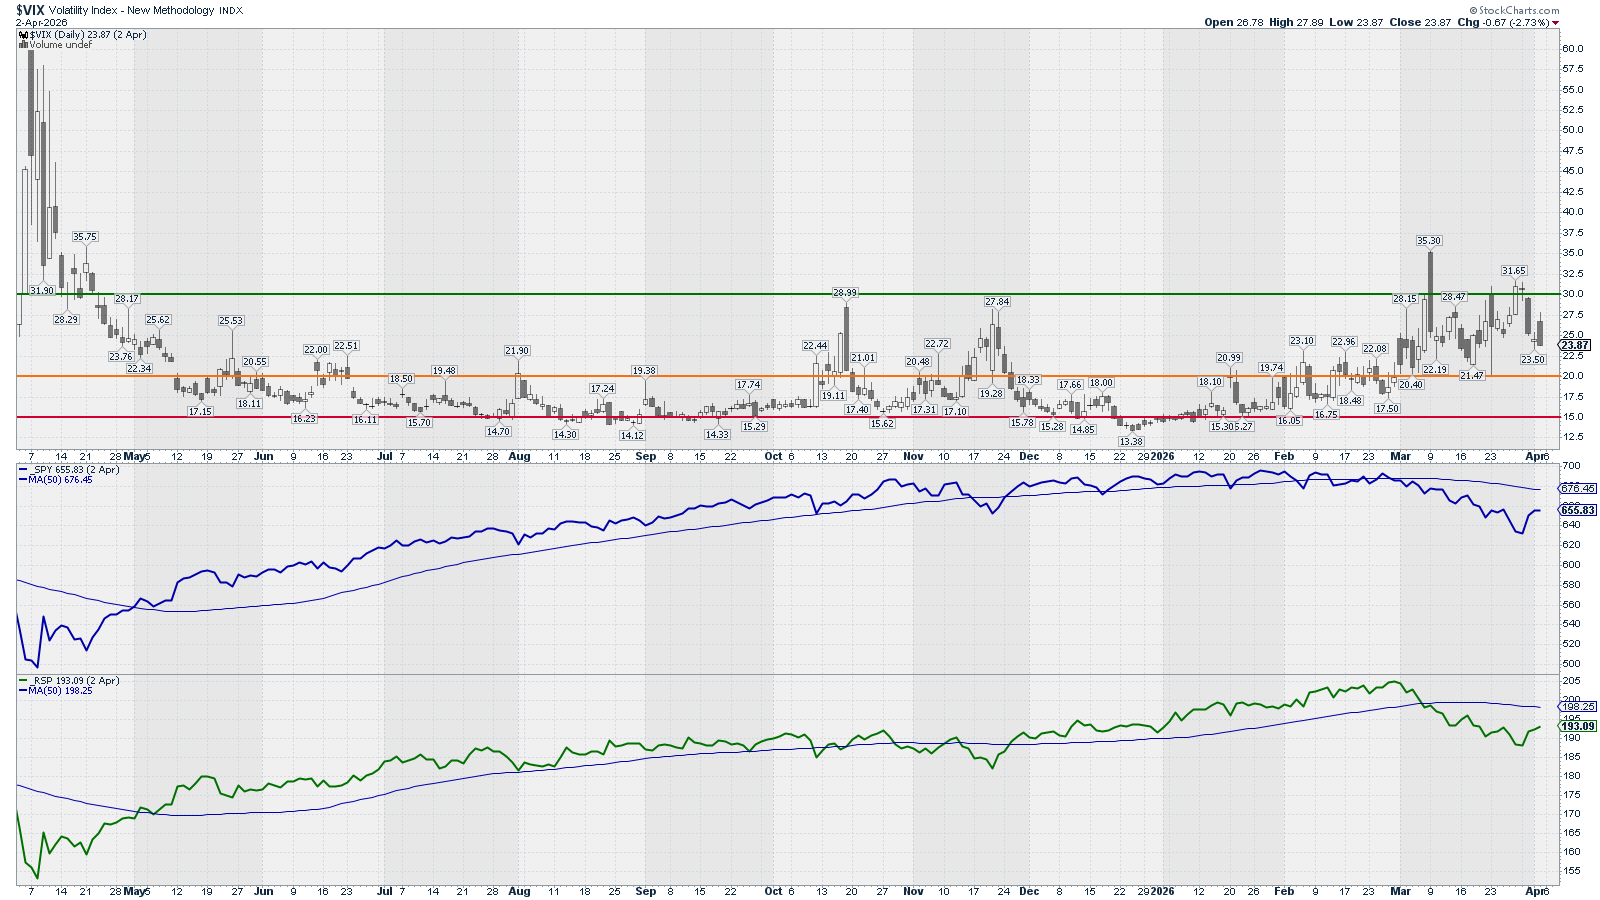
This chart is mainly to detect market bottoms.
Analysis: The trend has changed. Previous weeks have seen an increase in VIX that started at the beginning of 2026. A declining VIX will help the market to recover its bullish trend. VIX reading is above level 20, high volatility shall still be expected.
Outlook: Expect high volatility.
What is happening? – Level 2
Options: (Inverted) Put/Call Ratio vs. SPY
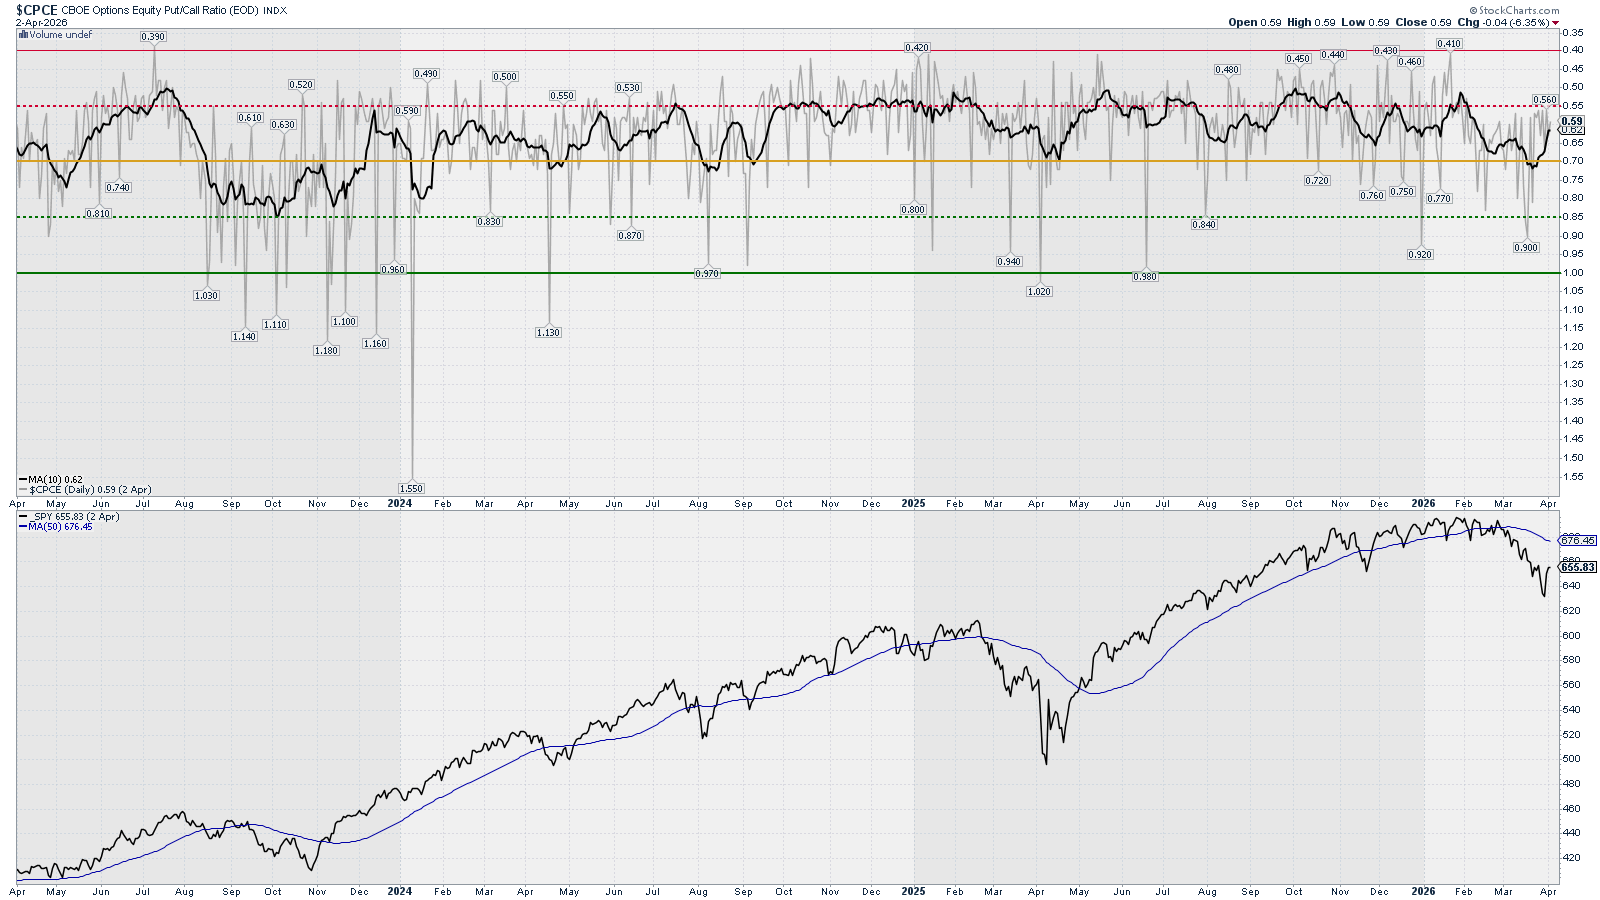
Analysis: If anything, the options market is telling us that we shall see high markets in the near future. There is no sign of neither panic bulls nor bears.
Outlook: Neutral to Bullish
What is happening? – Level 2
Options: Gamma Exposure – SPX
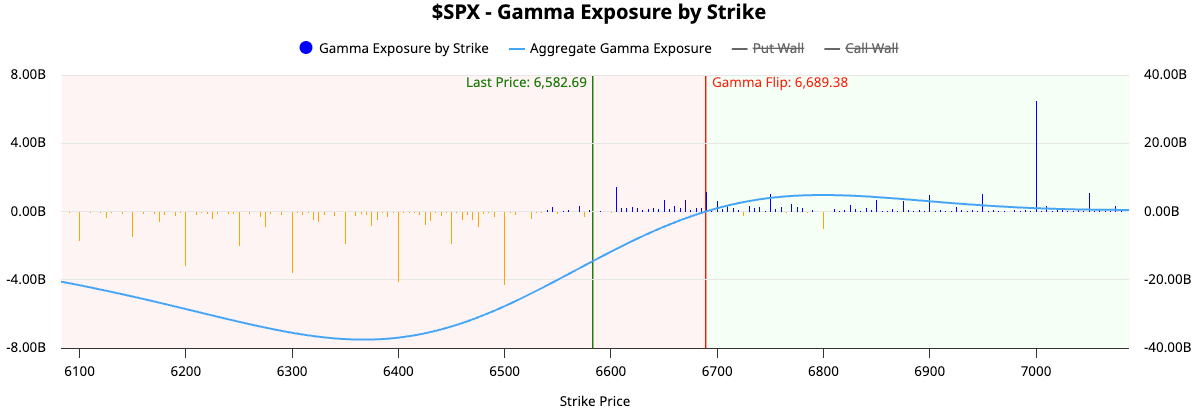
Analysis: About to flip Gamma. What a change compared to previous weeks!
Outlook: Neutral to Bullsih
Level 2 Summary
Price Action: Neutral
Breadth & Volatility: Bearish
Options: Neutral lto Bullish
What is happening? – Level 3
Bulls vs. Bears: RSP vs. RSPD (Cons. Disc. – Bulls) and RSPS (Cons. Sta. – Bears)
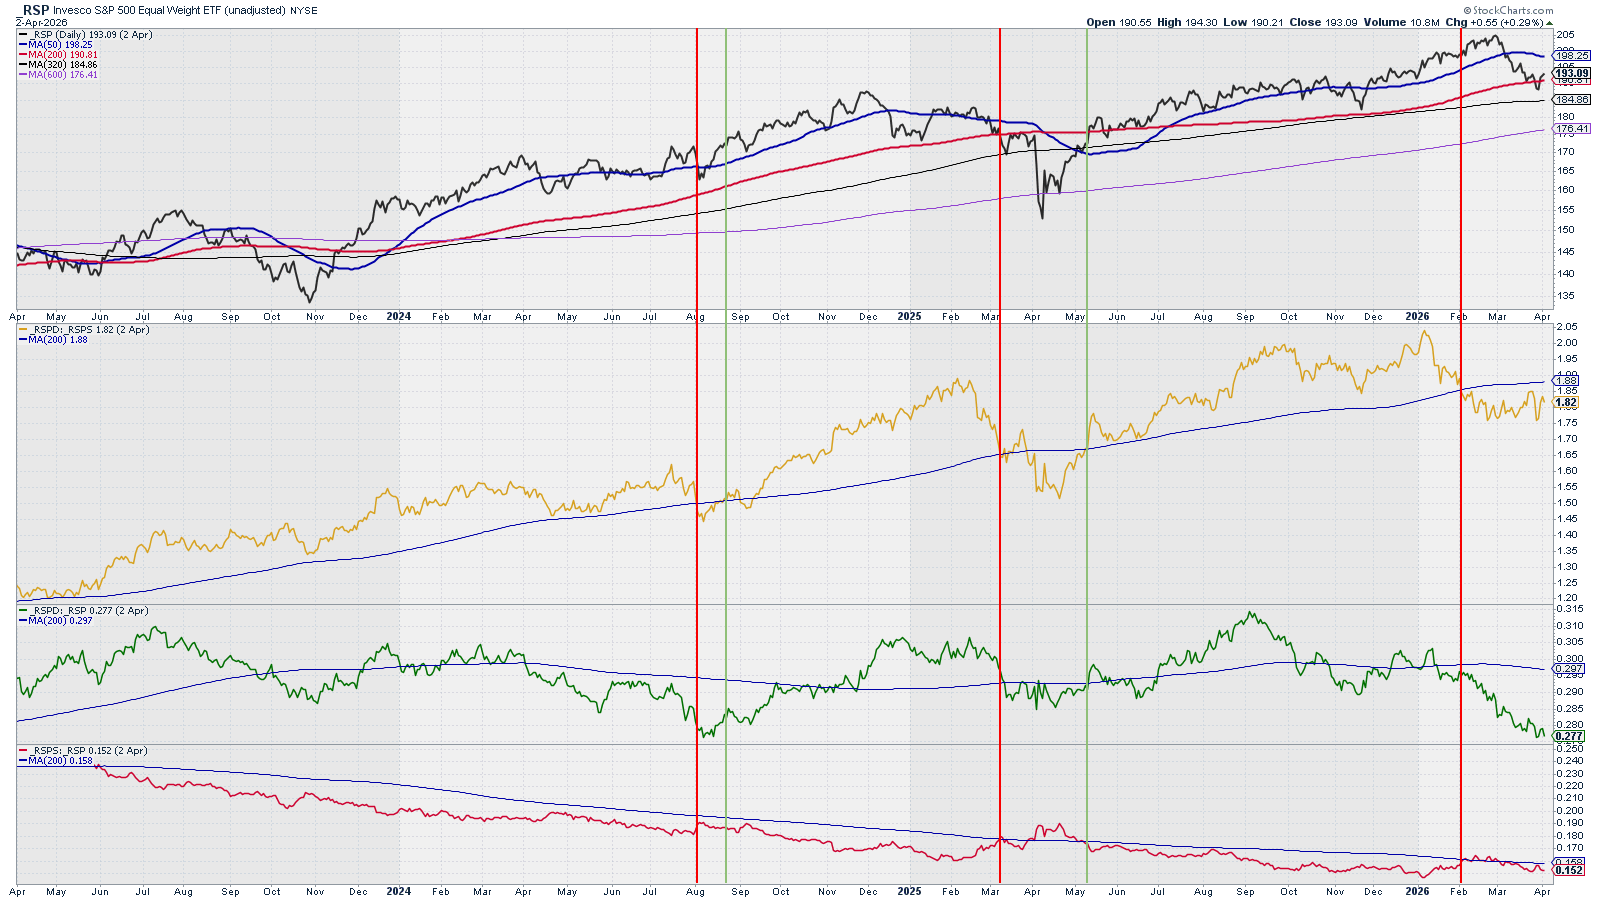
Analysis: The ratio is moving sideways. Bulls (green) are very weak but Bears (red) are not getting stronger. I’m improving the outlook from Bearish to Neutral
Outlook: Neutral
Commentary: With the benefit of the hindsight, the 3rd of February, the RSPD:RSPS ratio crossed below its SMA 200, giving us an early warning of what was to come. Markets really seem to have a crystal ball to see the future.
What is happening? – Level 3
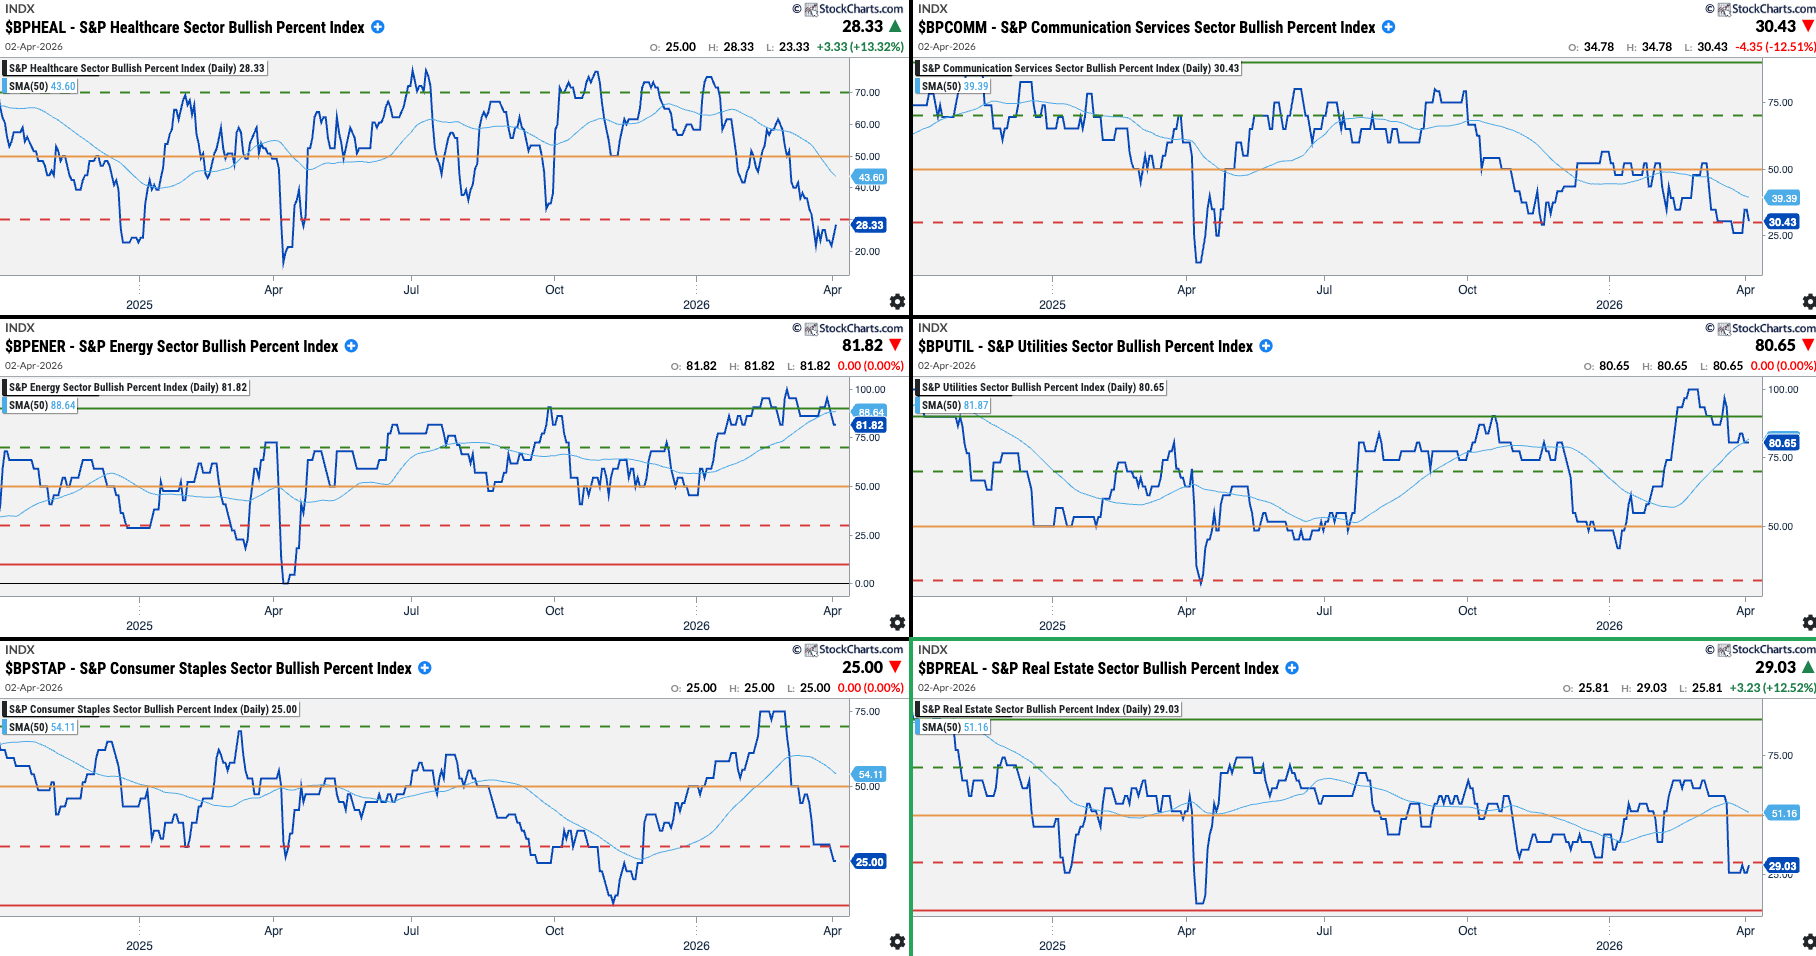
Sectors Rotation: Sectors Bullish Percent Index
Growth Sectors:
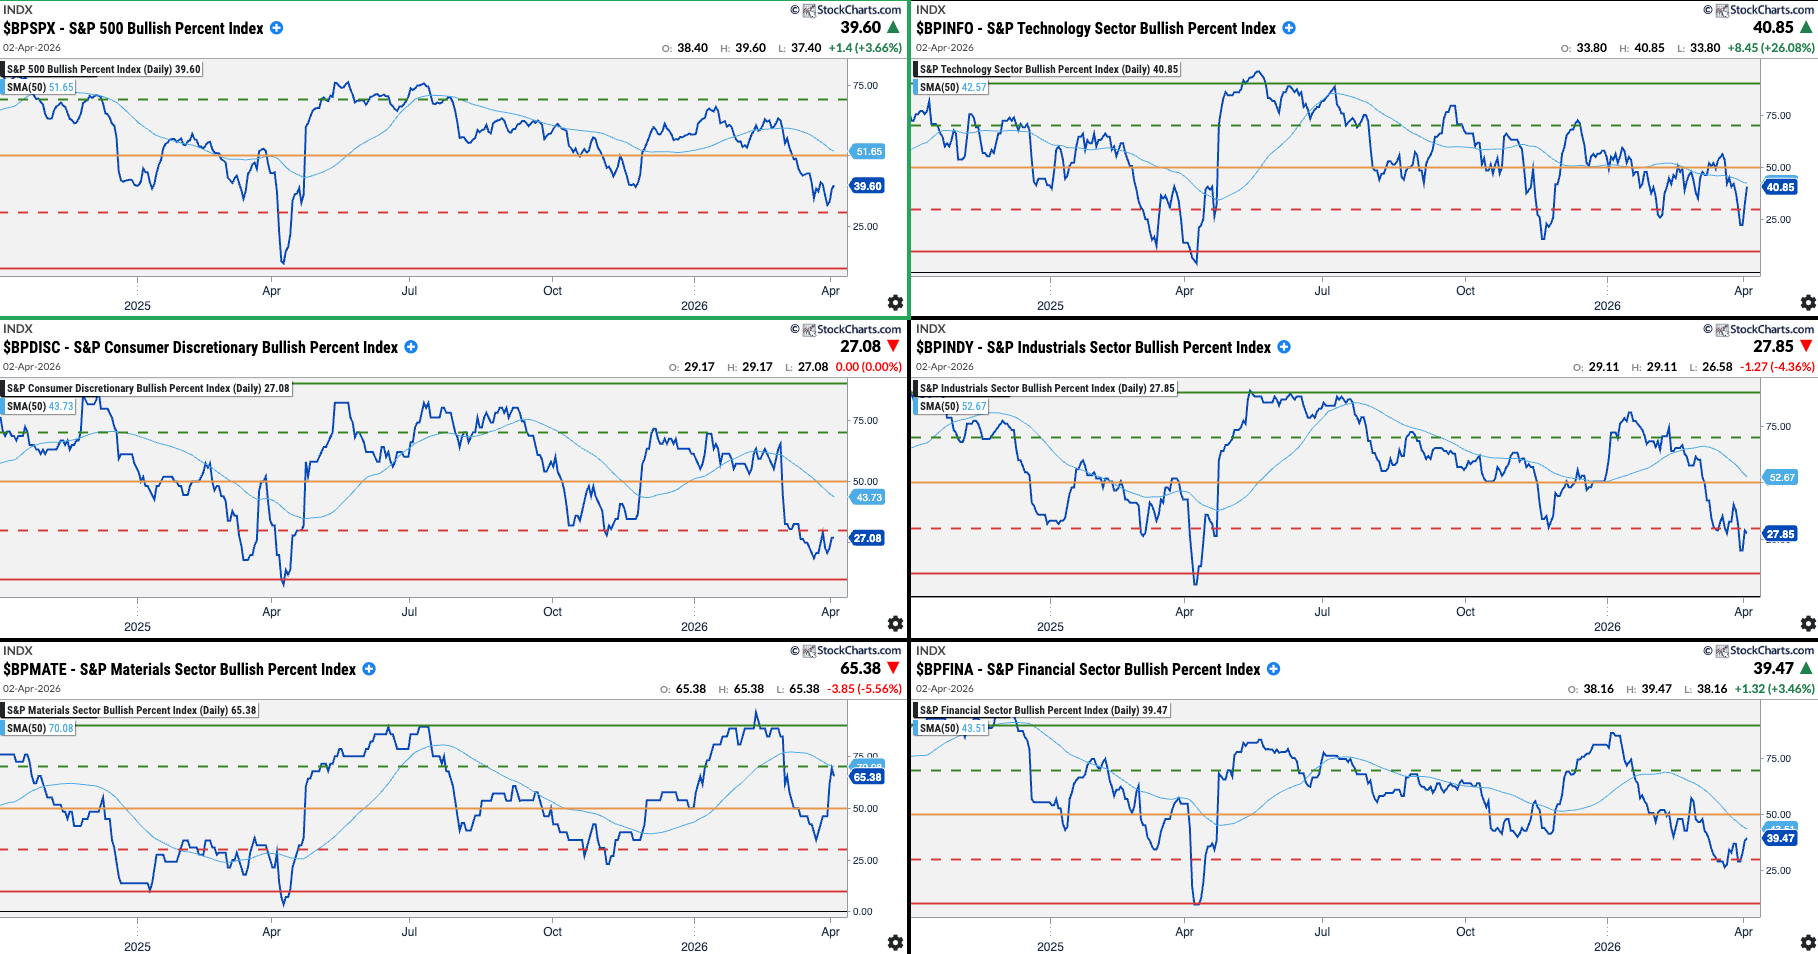
Value Sectors:
US Sectors order by ISM PMI Correlation (between parenthesis)
Growth Sectors - shall outperform when the market is bullish:
XLK: Technology (71%)
XLY: Cons. Discretionary (67%)
XLI: Industrials (66%)
XLB: Basic Materials (66%)
XLF: Financials (59%)
Value Sectors - shall outperform when the market is bearish:
XLV: Healthcare (55%)
XLC: Communications (49%)
XLE: Energy (44%)
XLU: Utilities (35%)
XLP: Cons. Staples (30%)
XLRE: Real Estate (16%)
Analysis:
Any sectors below their red levels are good opportunities to find great companies at good valuations or buy sector ETFs (buy cheap). Those sectors above their Green levels are candidates to be sold (sell expensive).
Buy Opportunities: Industrials, Discretionary, and Healthcare (Tech. and Comm. could also be seen as good opportunities)
Sell Opportunities: Energy
Market & Economy Rotation
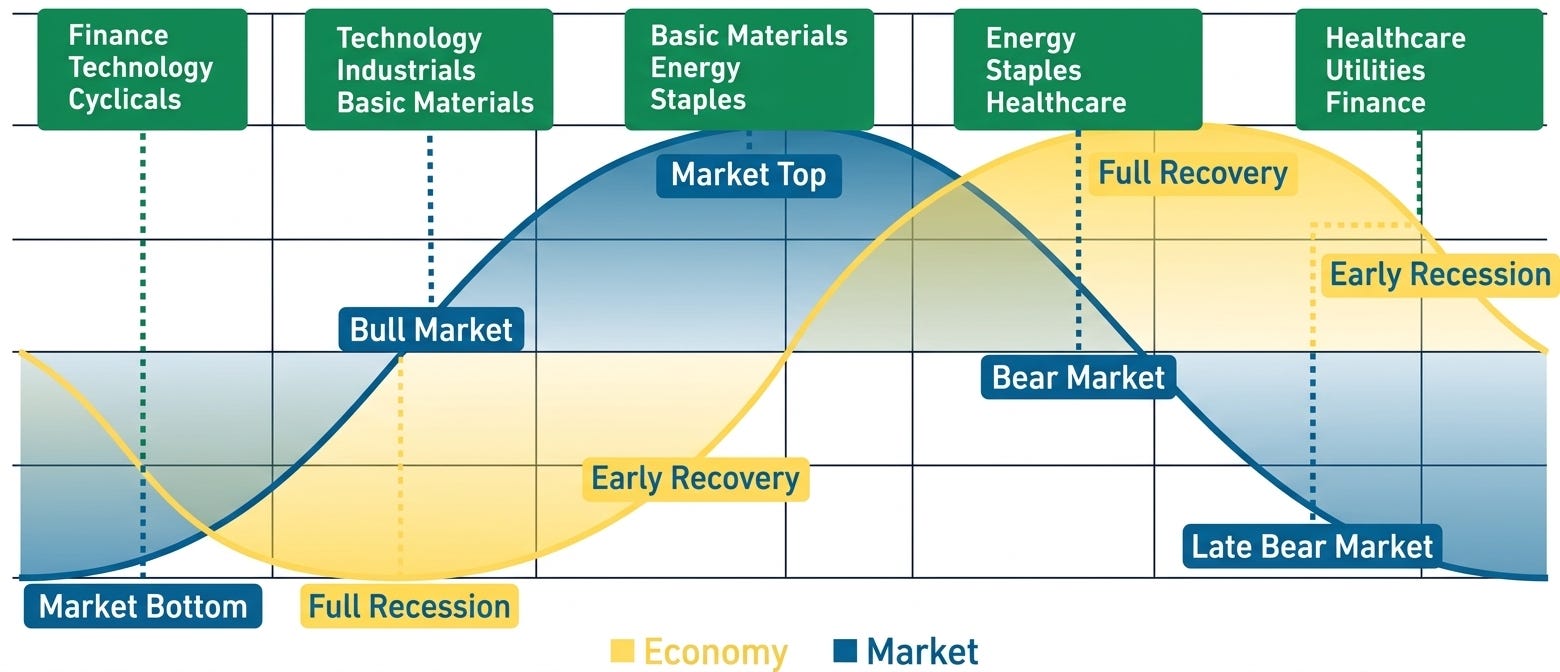
Analysis:
If we consider that Energy has peaked and that the next wave higher comes from Healthcare, Tech, and Industrials, then we are entering the “Late Bear Market” and moving fast towards a “Market Bottom” situation.
Level 3 Summary
Bulls vs. Bears: Neutral
Market & Economy Rotation: Moving towards Late Bear Market
All Levels Summary and Final Thoughts
Level 1 Summary
Economic Data (long-term): Bullish to Neutral
USD & Interest Rates: Bearish
Investors Sentiment: Neutral
Level 2 Summary
Price Action: Neutral
Breadth & Volatility: Bearish
Options: Neutral lto Bullish
Level 3 Summary
Bulls vs. Bears: Neutral
Market & Economy Rotation: Moving towards Late Bear Market
Final Thoughts
Dominant Narrative: Iran’s war duration
Price has found, at least, “a bottom” in the Daily SMA 320. There are early signs of a possible rally, but nothing significant will happen without geopolitics supporting the Bull case. The pressure is on to resolve the conflict with Iran.
Disclaimer: The content on AMAT Investing is strictly for educational and learning purposes. The author is not a licensed financial advisor and holds no formal financial education. This post does not constitute professional financial advice. All investing involves risk of loss. Always conduct your own research and consult a licensed professional before making any investment decisions.