Context: Why is it happening?
Economic Production: ISM PMI vs. SPX
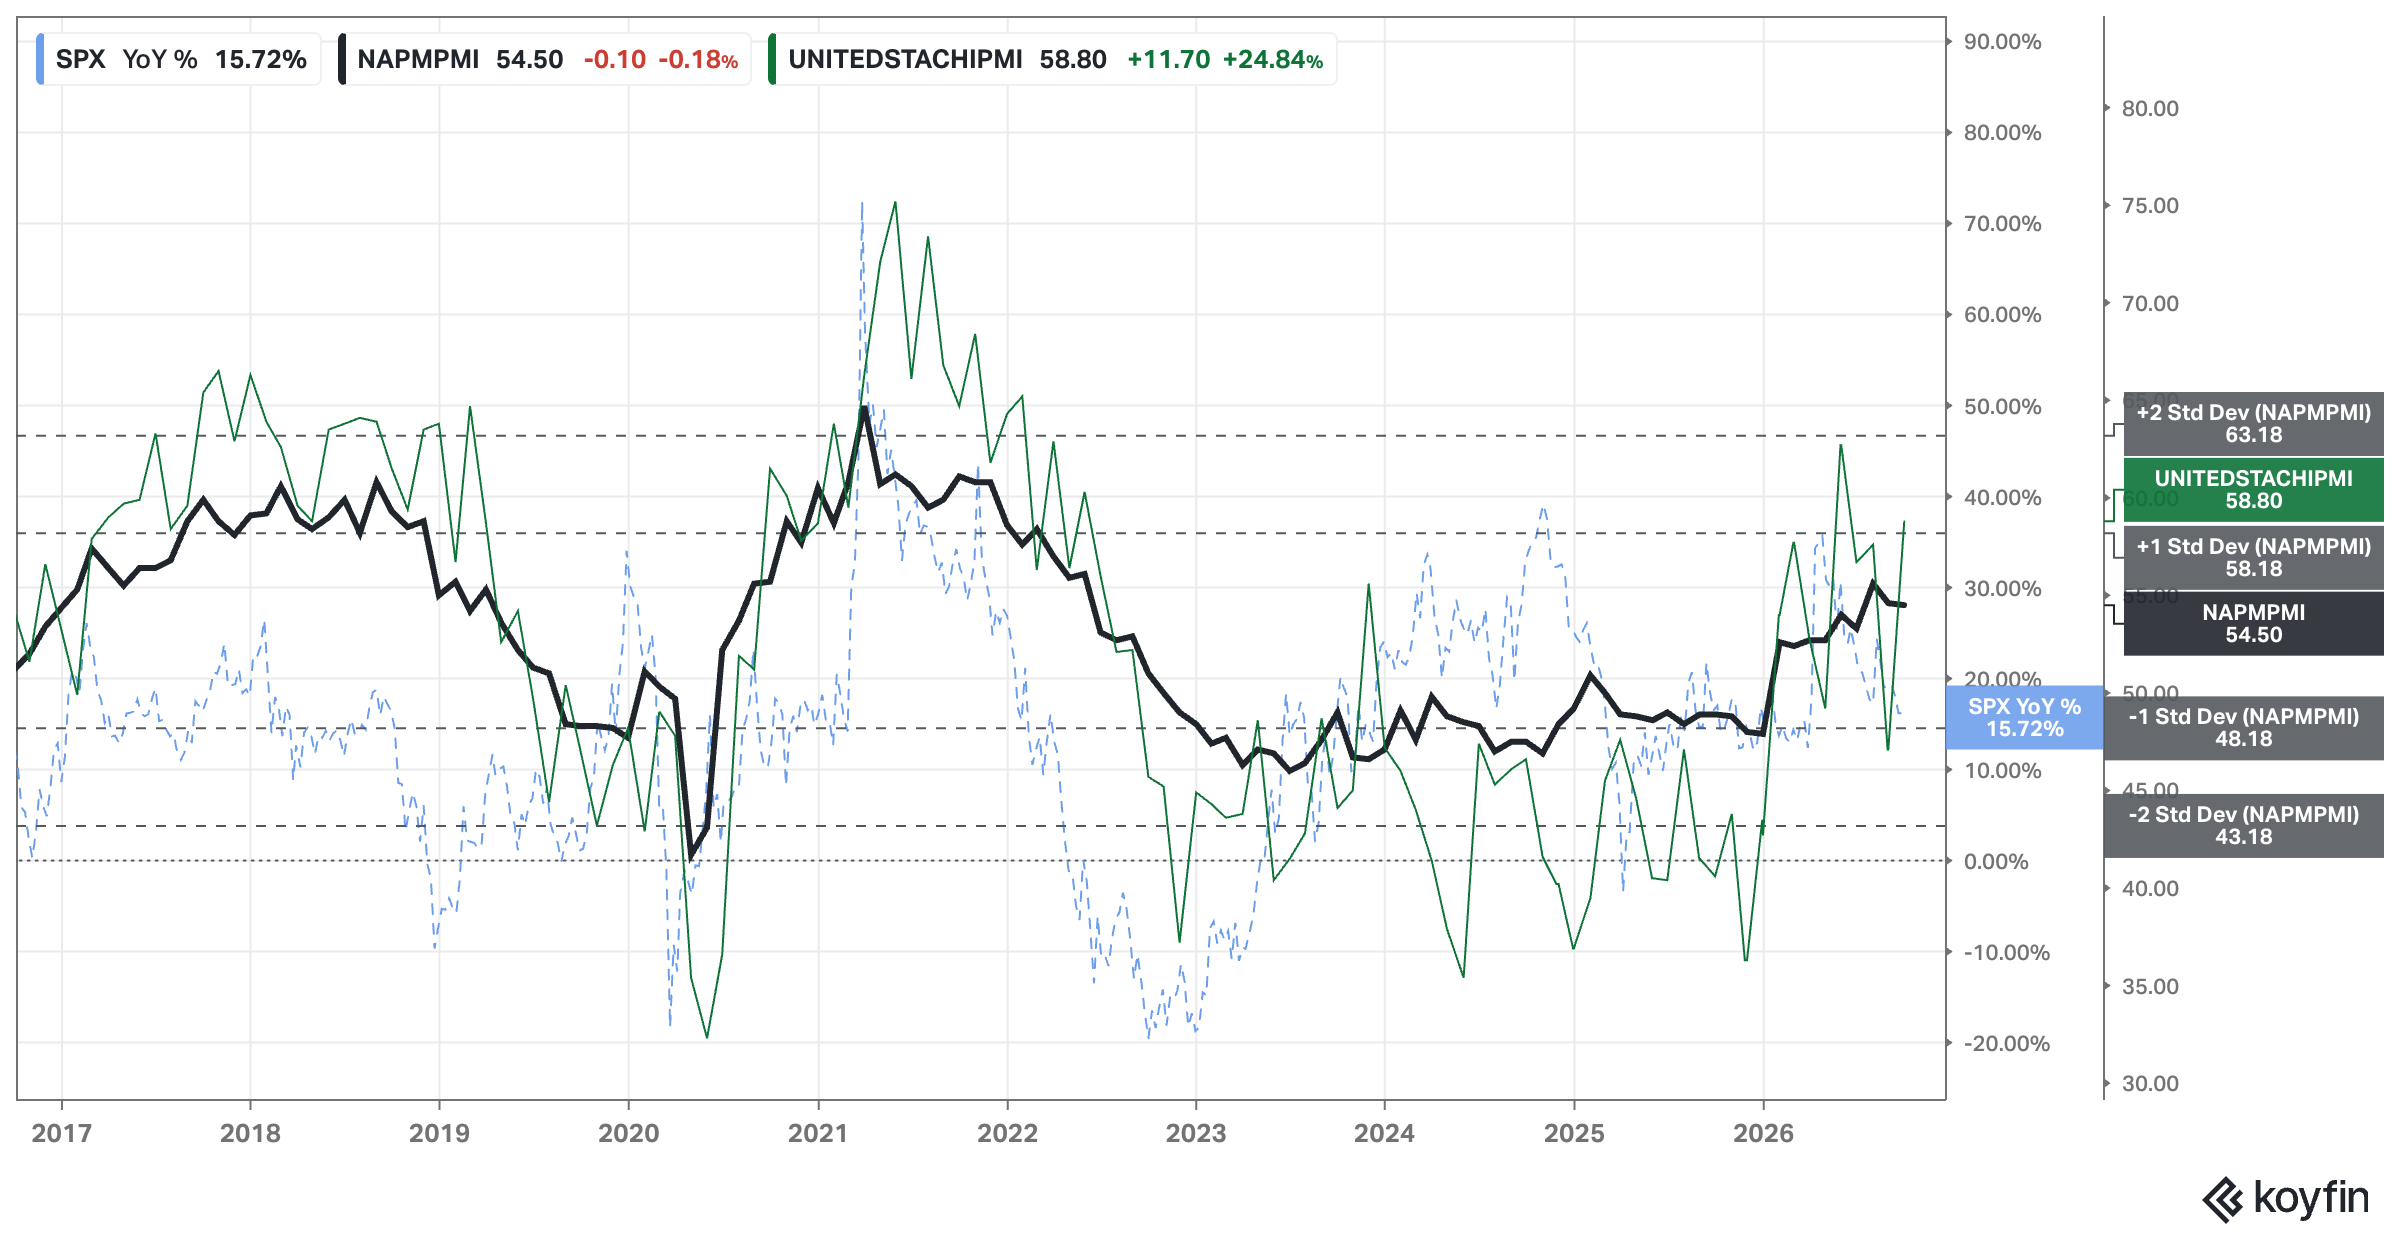
Analysis: No changes since last week.
ACH: 8
Economic Activity: Regional Banks Performance
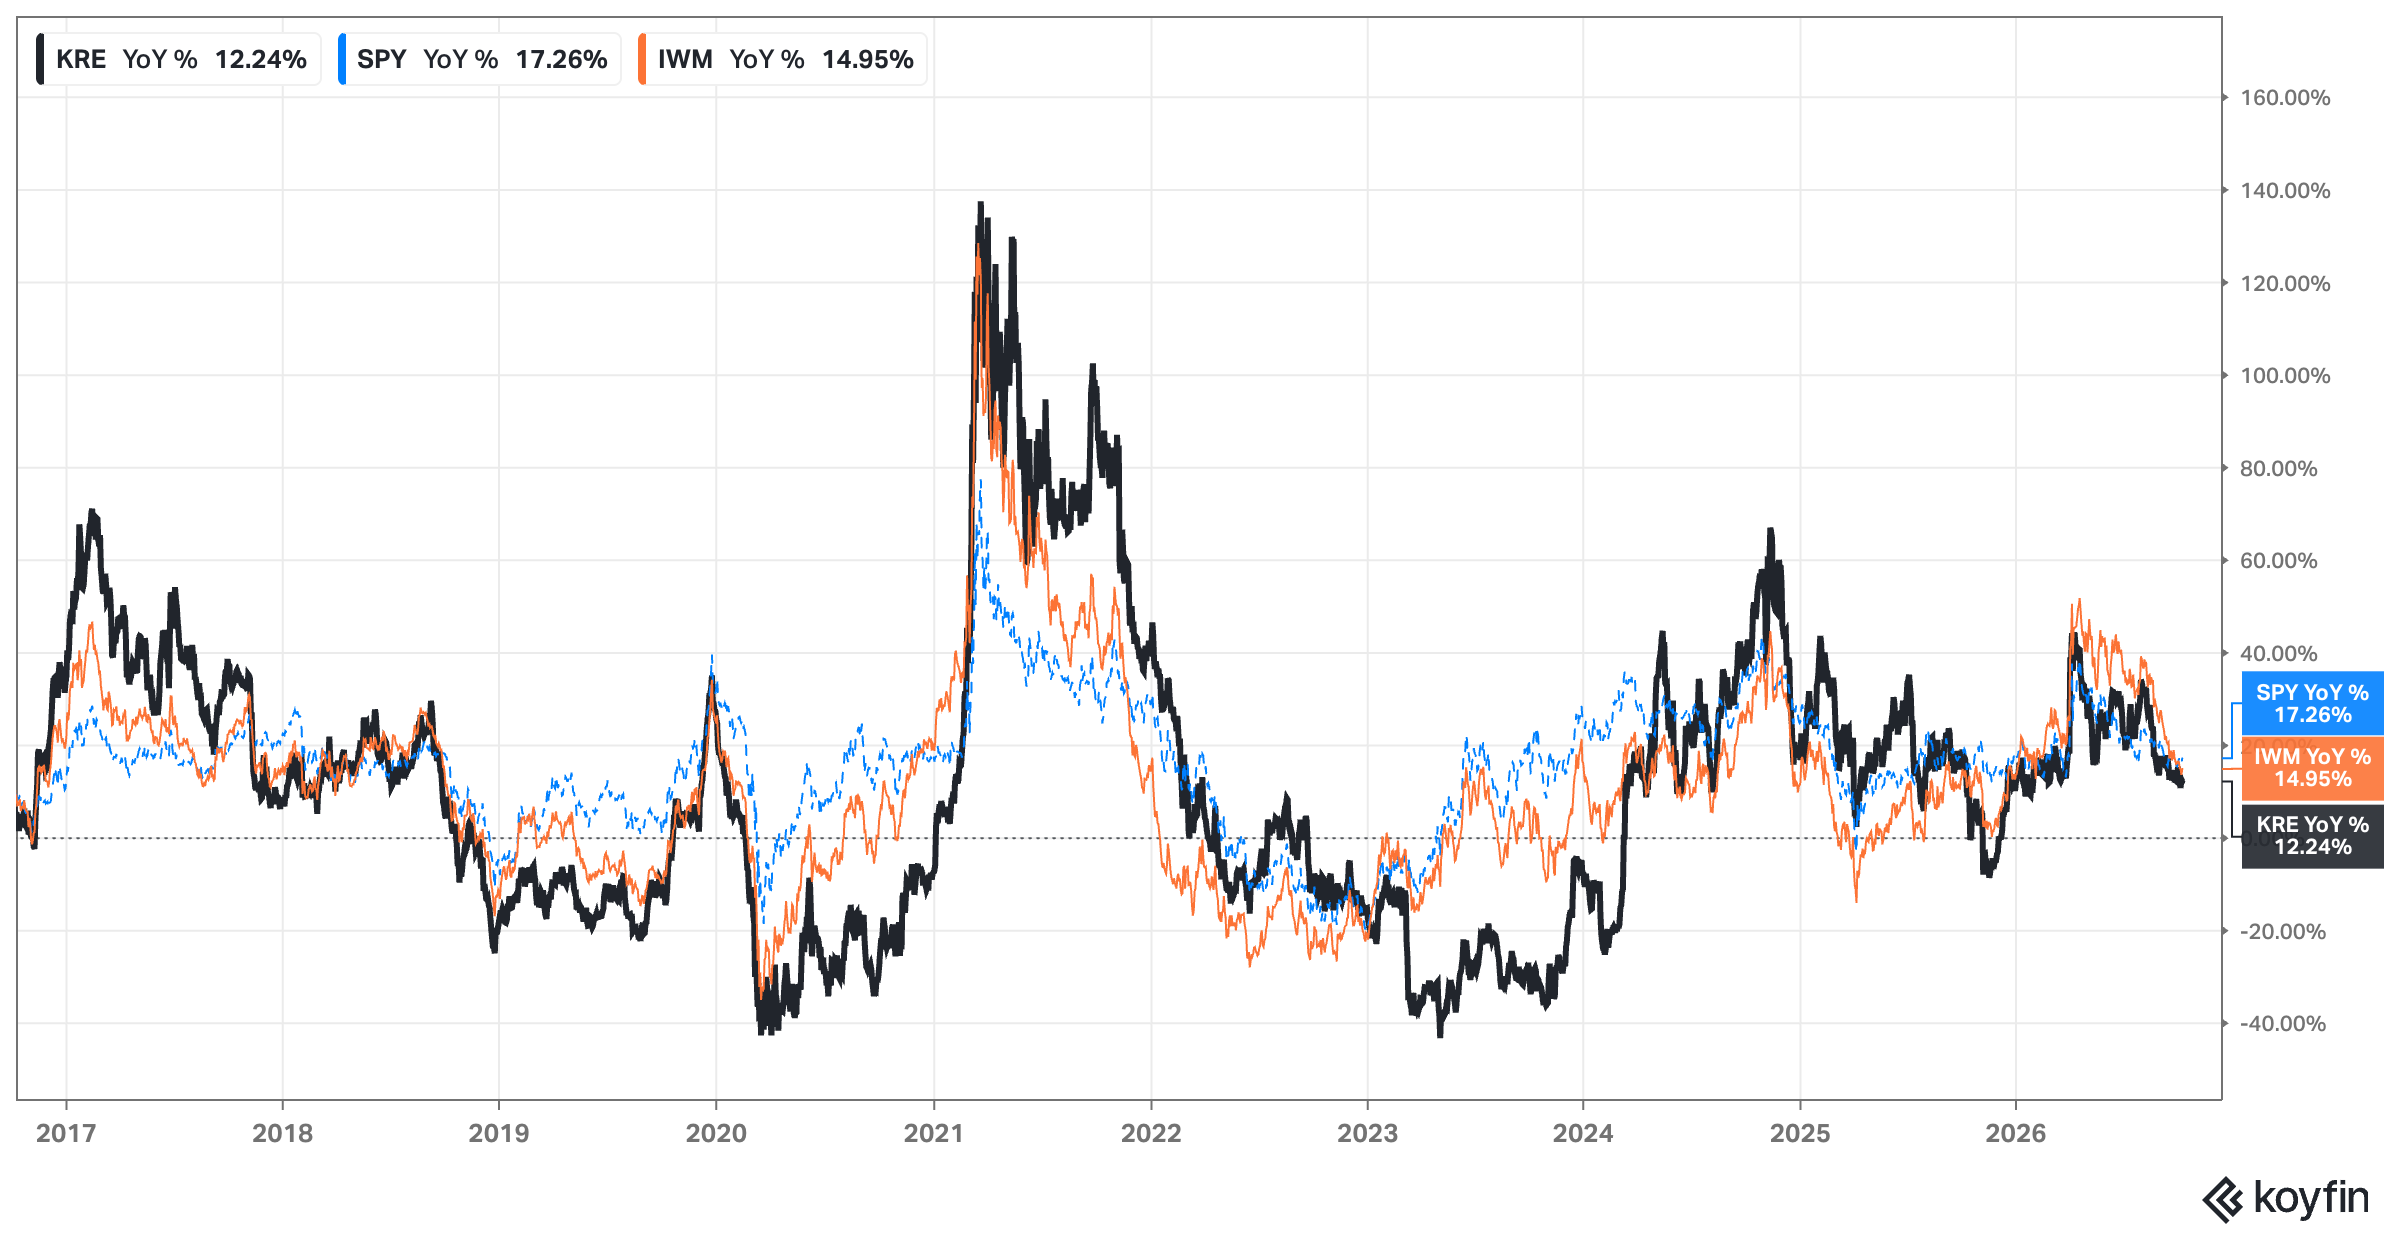
3 years zoom:
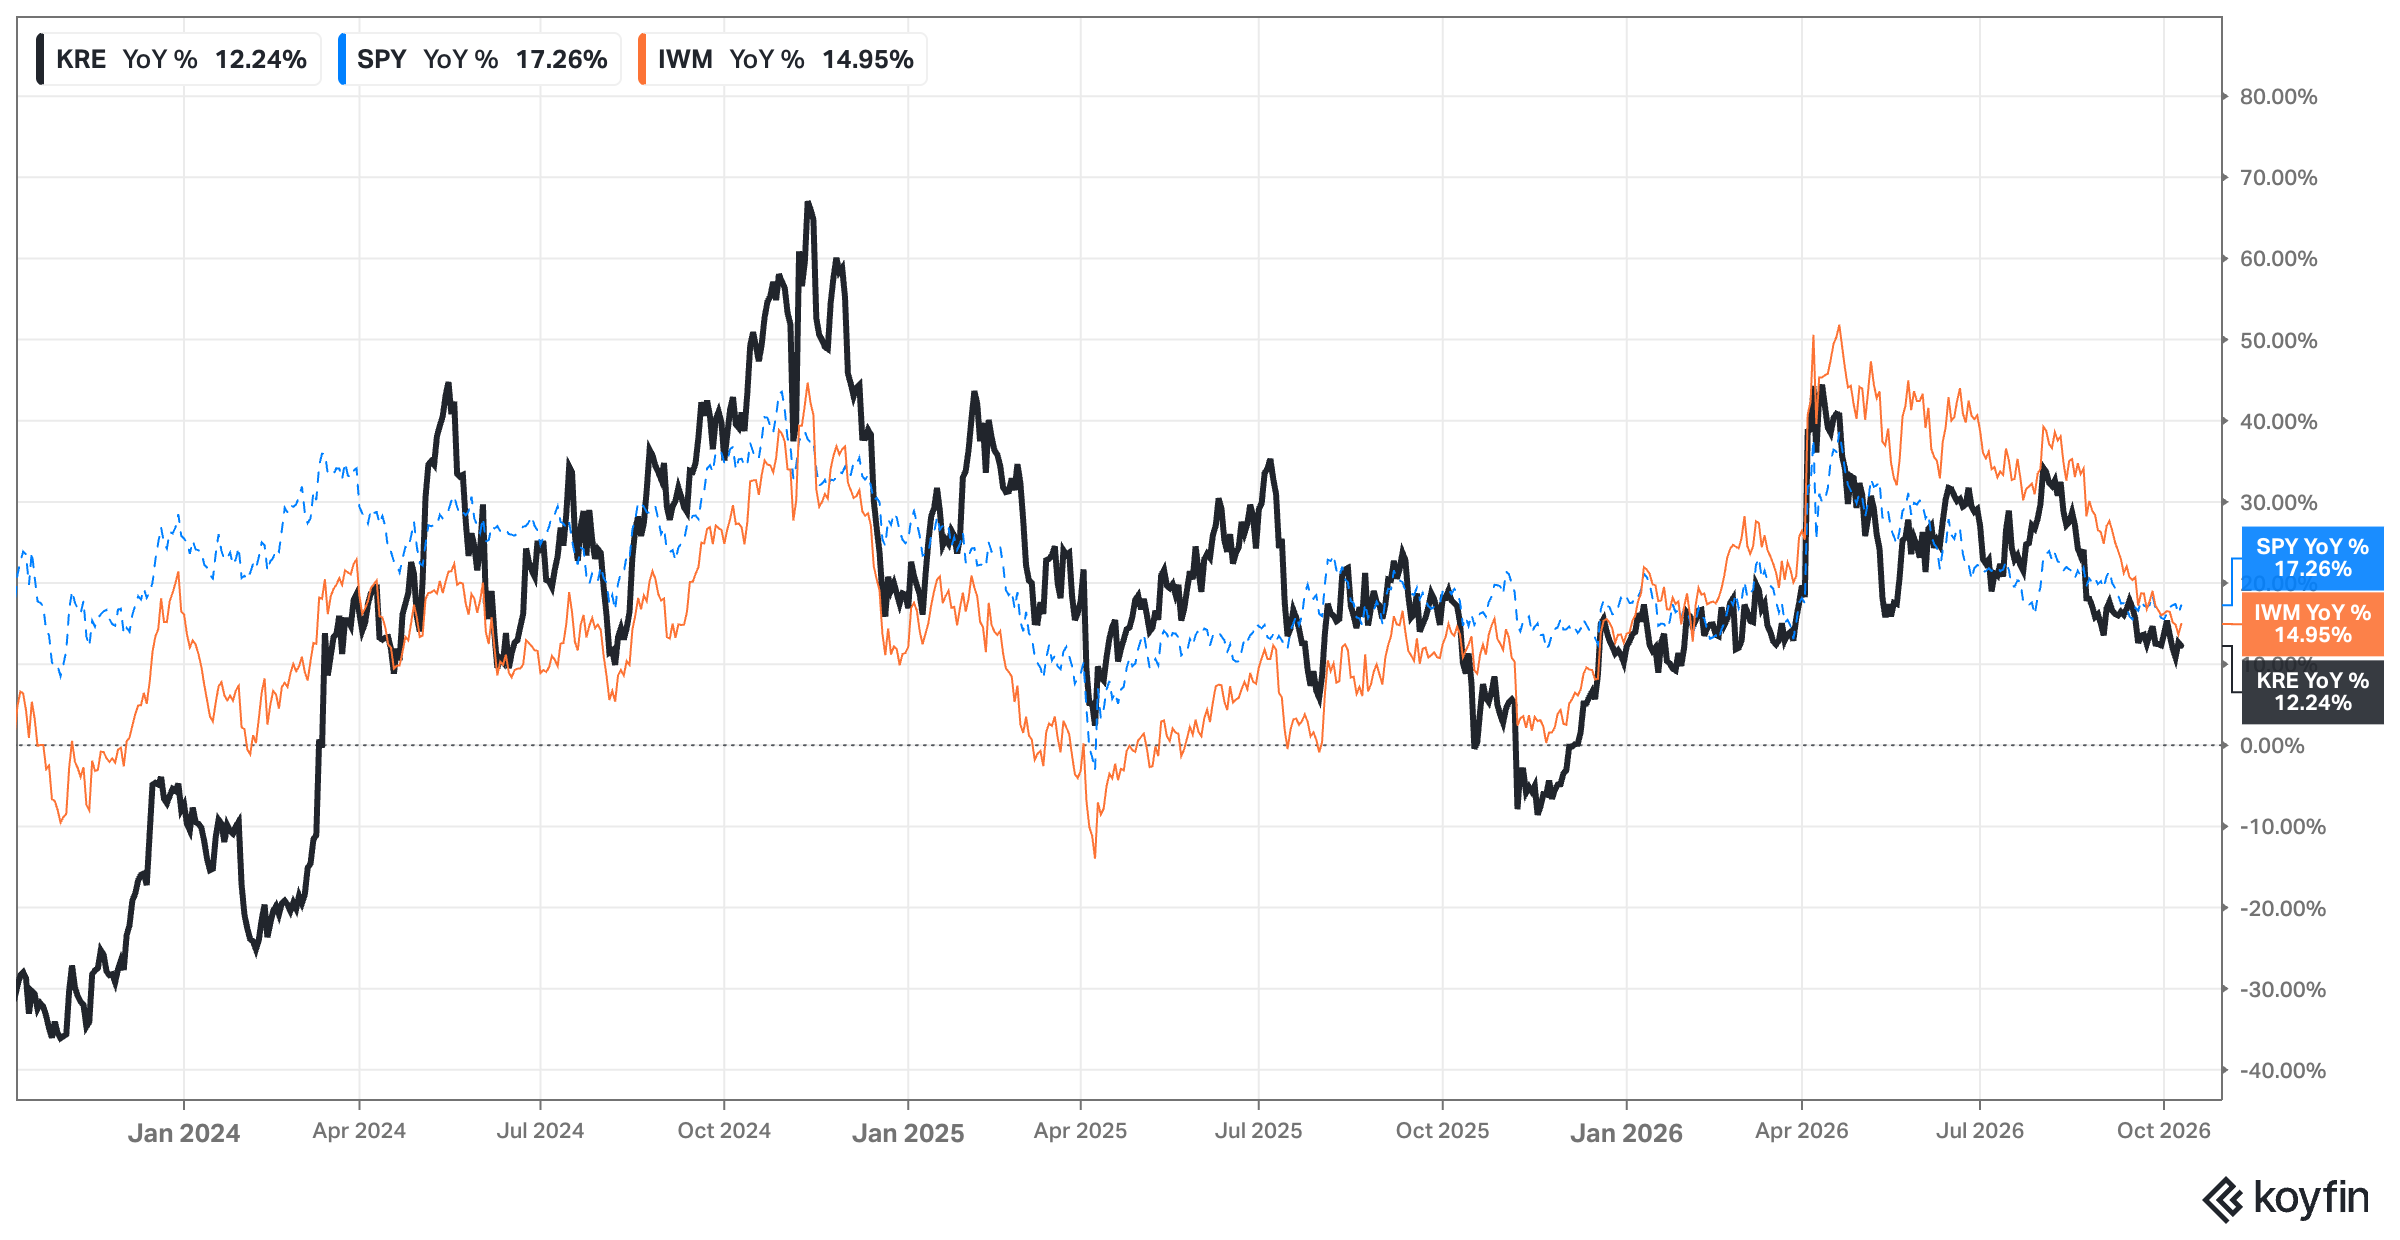
Analysis: The trend continues lower following rate hikes that negatively impact banks.
ACH: 3
Interest Rates: FED, 2yr, 10yr, and 30yr Rates
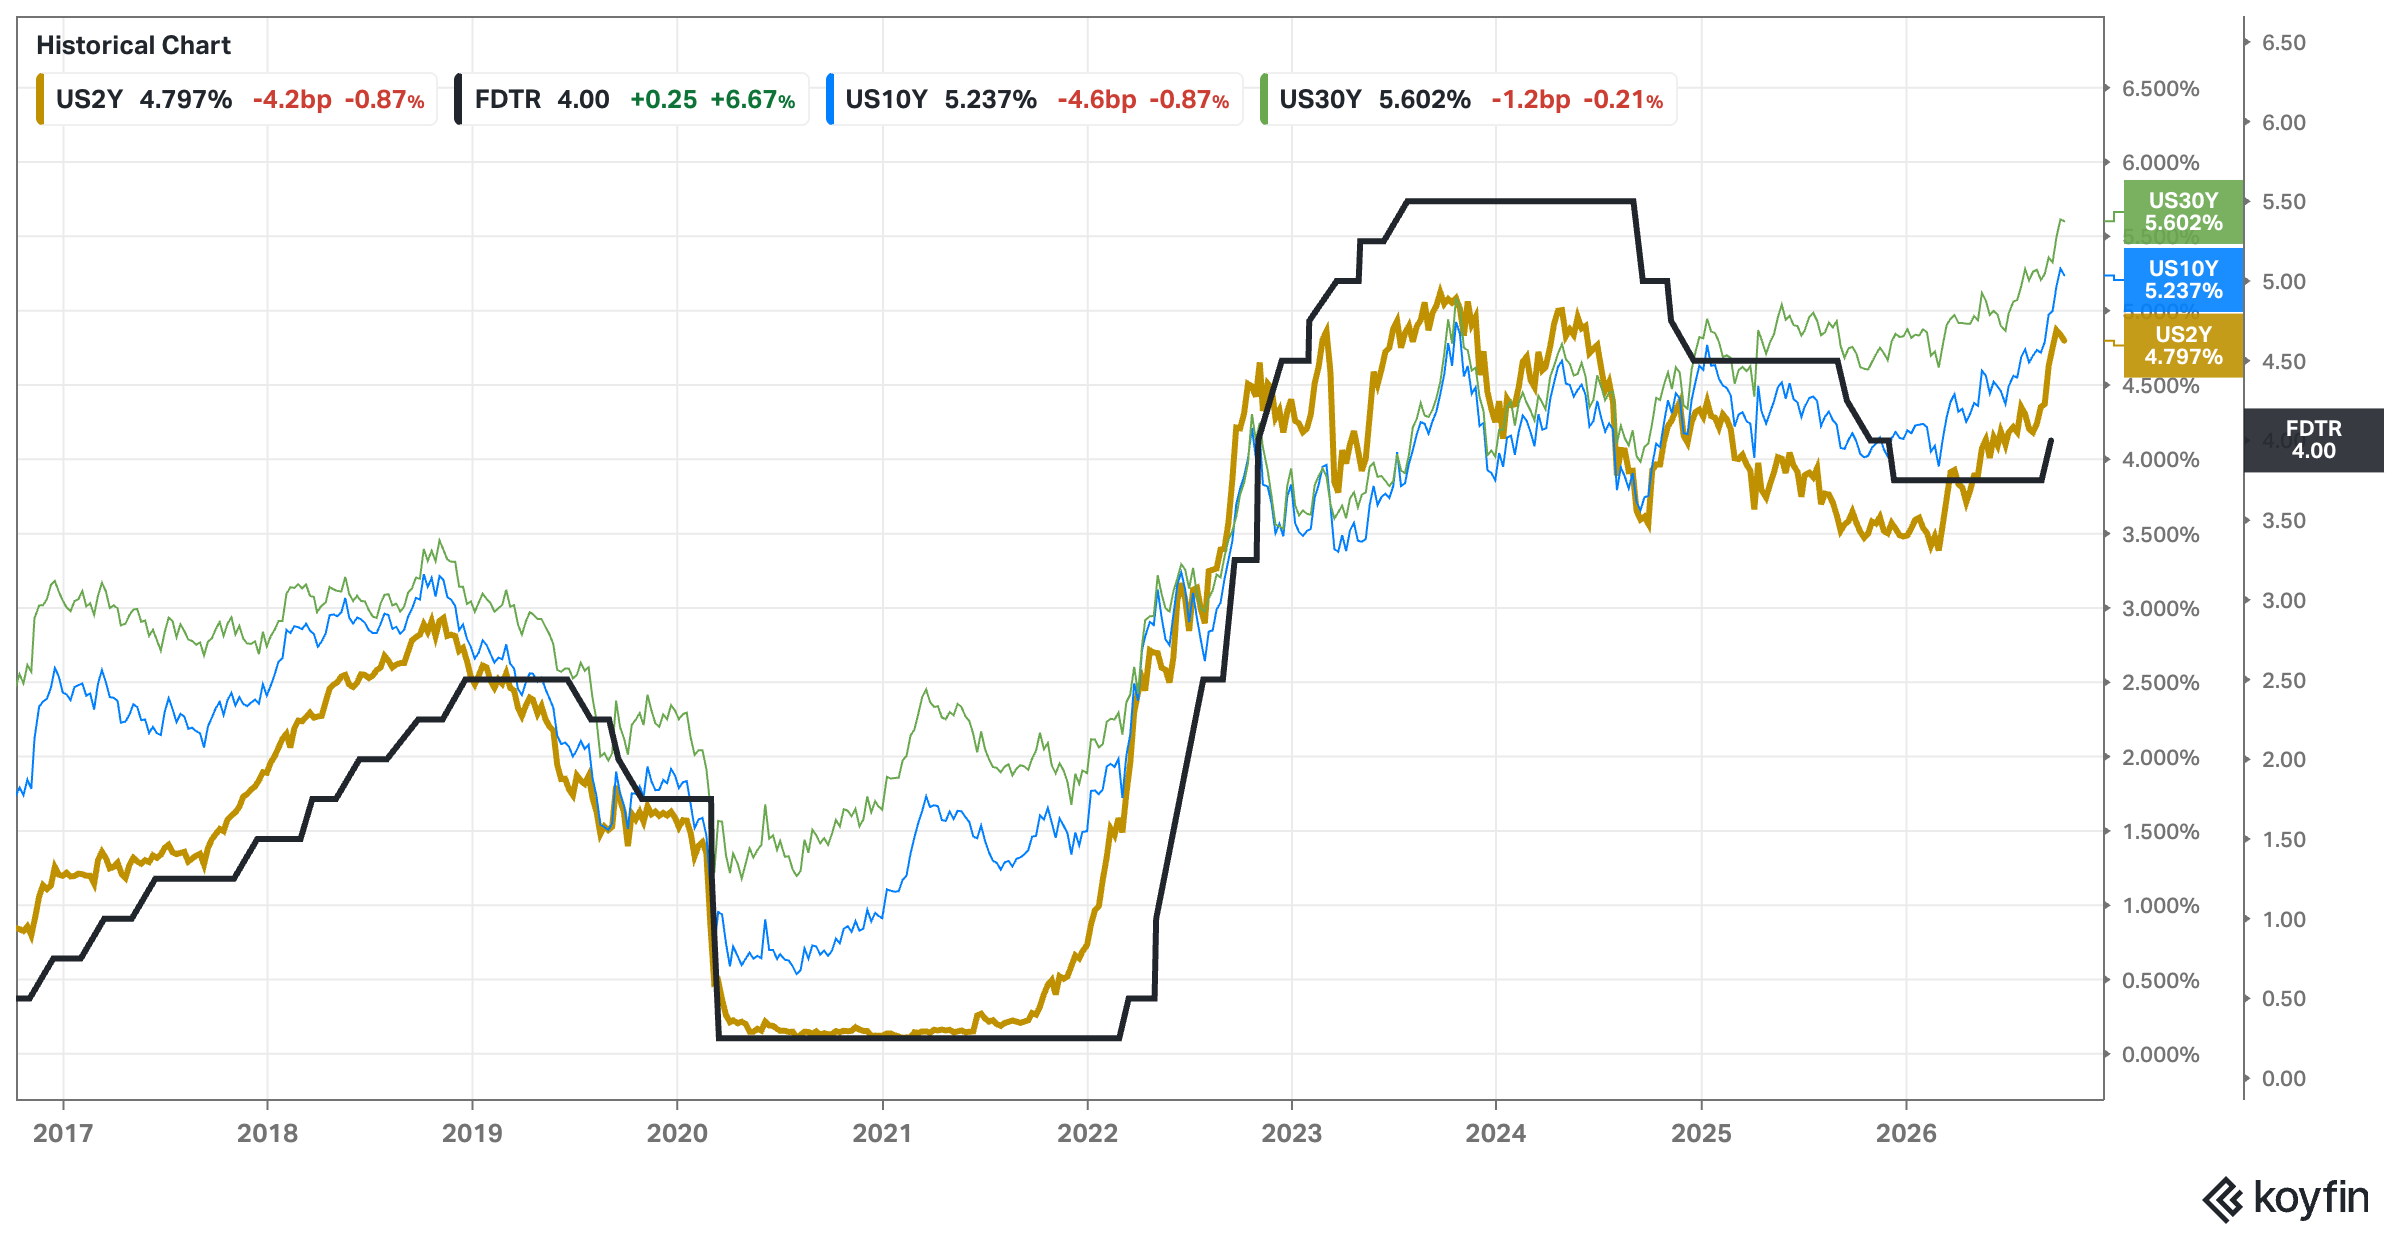
Analysis: First pause and small reduction on rates. Are we near the top?
ACH (inverted color): 11
Indexes: What is happening?
TA: Price Action, Trend, Momentum & Volume:
Weekly & Daily SPY, QQQ, and IWM
Technical Analysis:
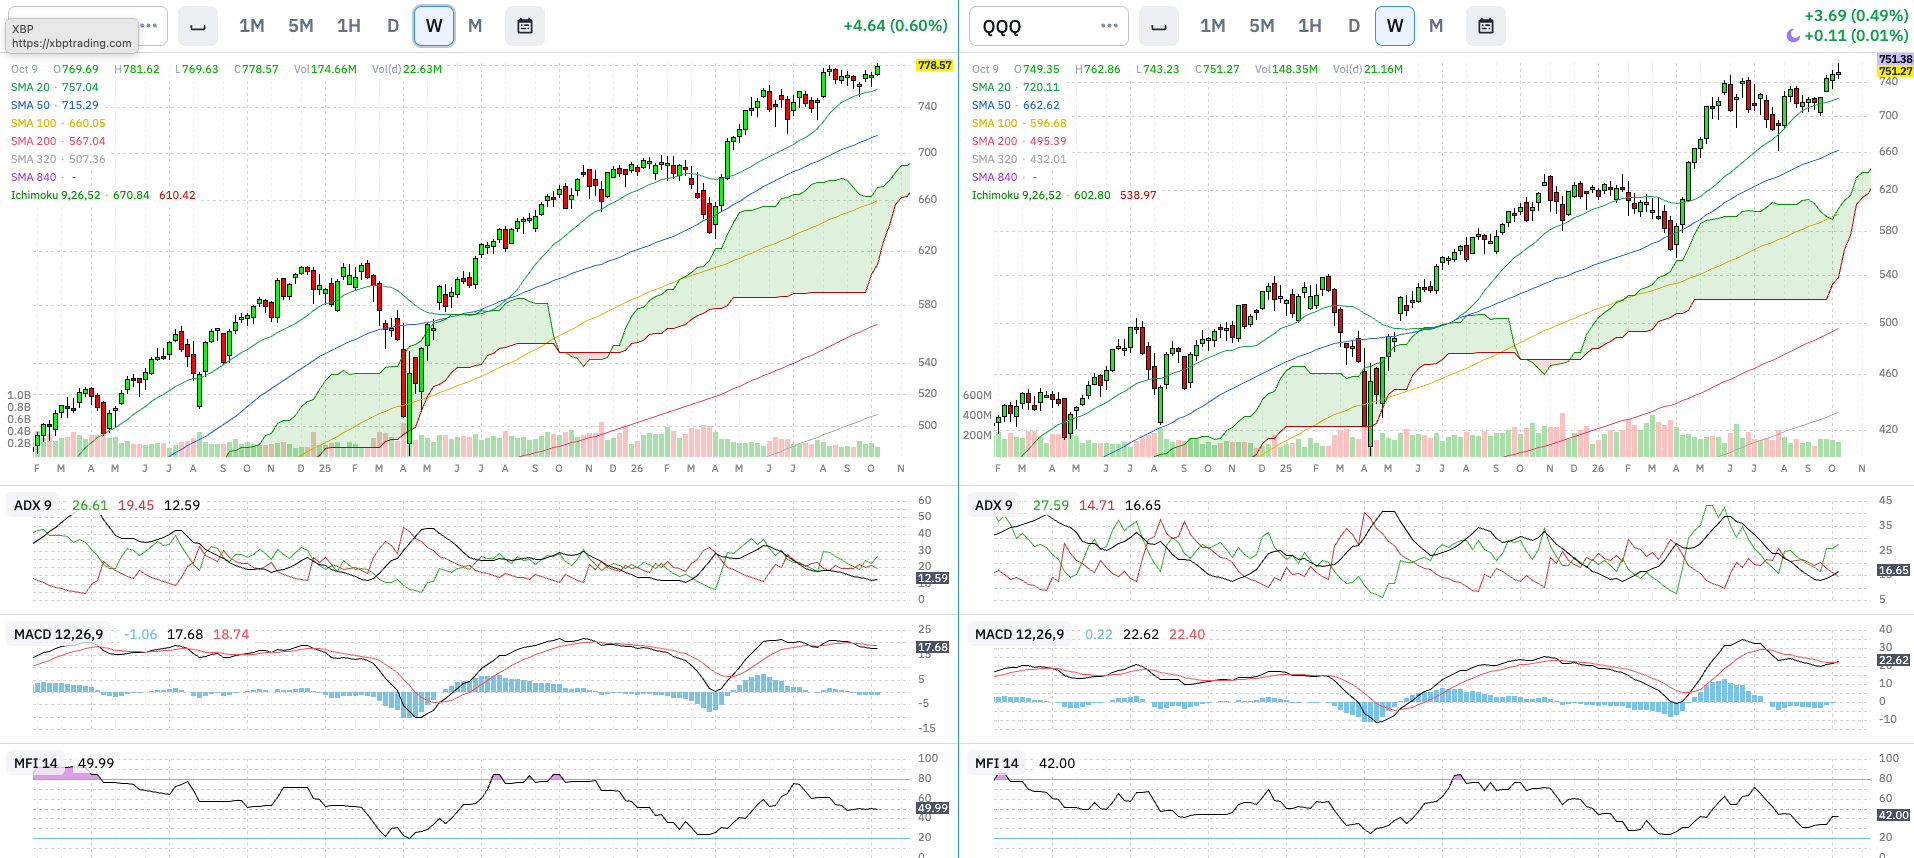
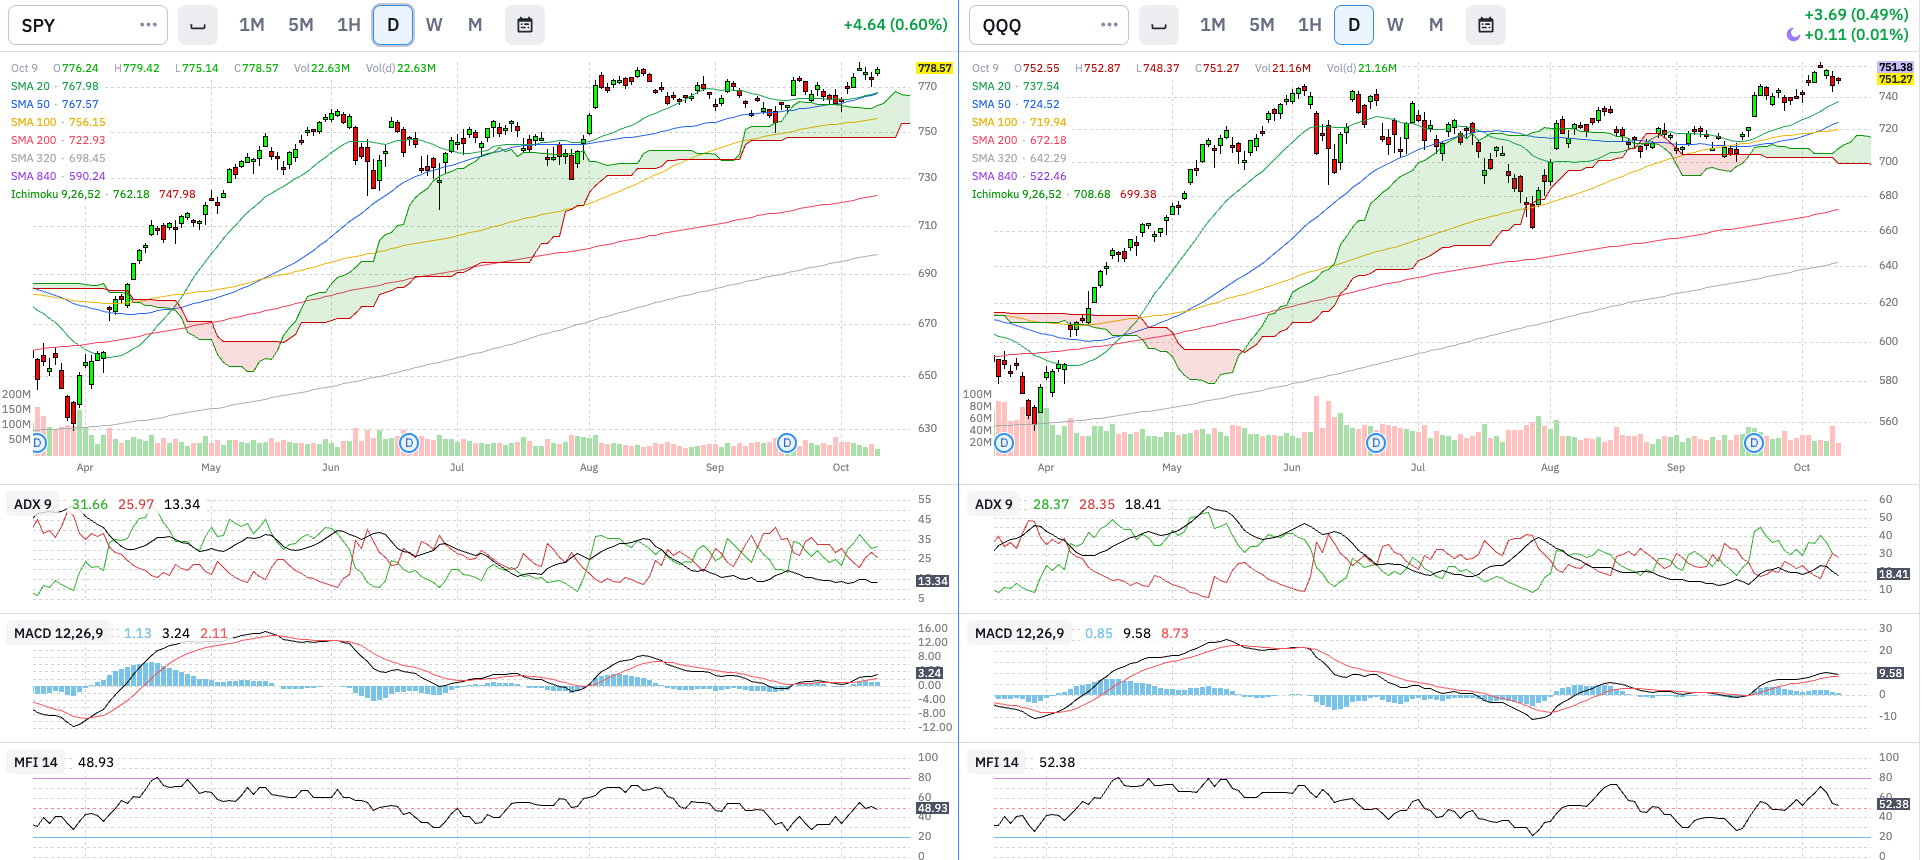
Price (SMAs & Cloud): Weekly: ATHs for both SPY and QQQ. Daily: Both indexes reached ATH and retraced from there. Summary: Price action is definitely bullish. ACH: 9
Trend (ADX): Weekly: Both indexes with a low ADX starting a bullish uptrend. Daily: Weak ADX trends with mixed signals in both indexes. Summary: Weak but bullish trends are visible. ACH: 8
Momentum (MACD): Weekly: ‘Toppy’ MACD, specially in SPY, but we know that markets can stay in toppy momentum for quite a while. QQQ has more free upside room compared to historical levels. Daily: Both indexes with low readings but raising trends. Summary: Momentum is building up towards the bullish side. ACH: 8
Volume (MFI): Weekly: Quite flat readings below level 50, as volume is relatively low. Daily: Both with readings around level 50. No clear signals towards any direction. ACH: 8
Breadth: % Stocks above SMAs
Above 200 Daily SMA
Above 20, 50, and 200 Daily SMAs vs. RSP
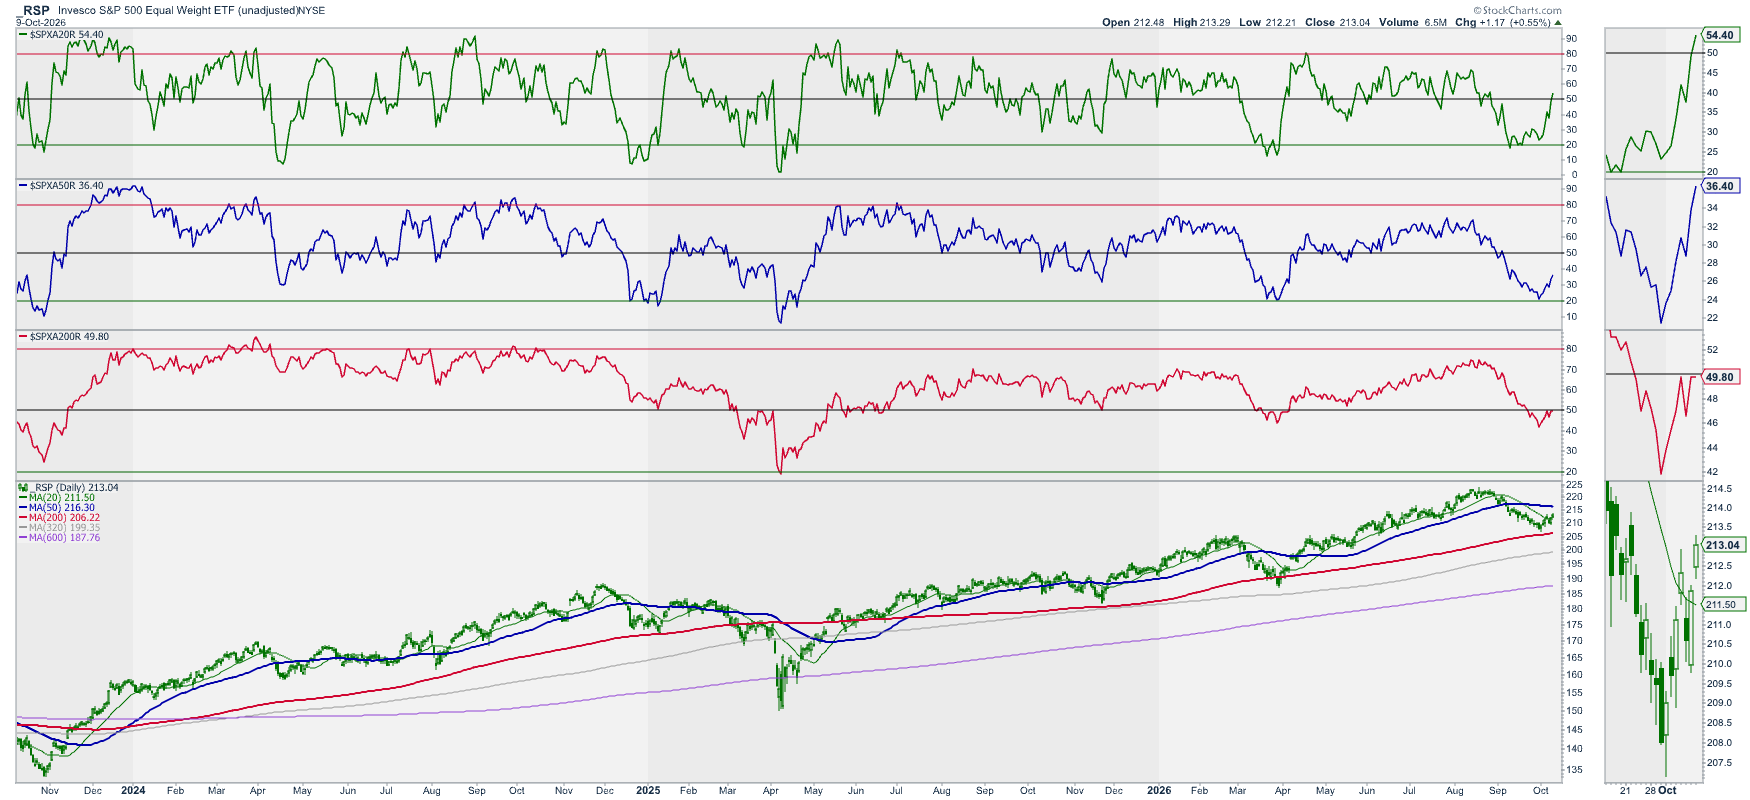
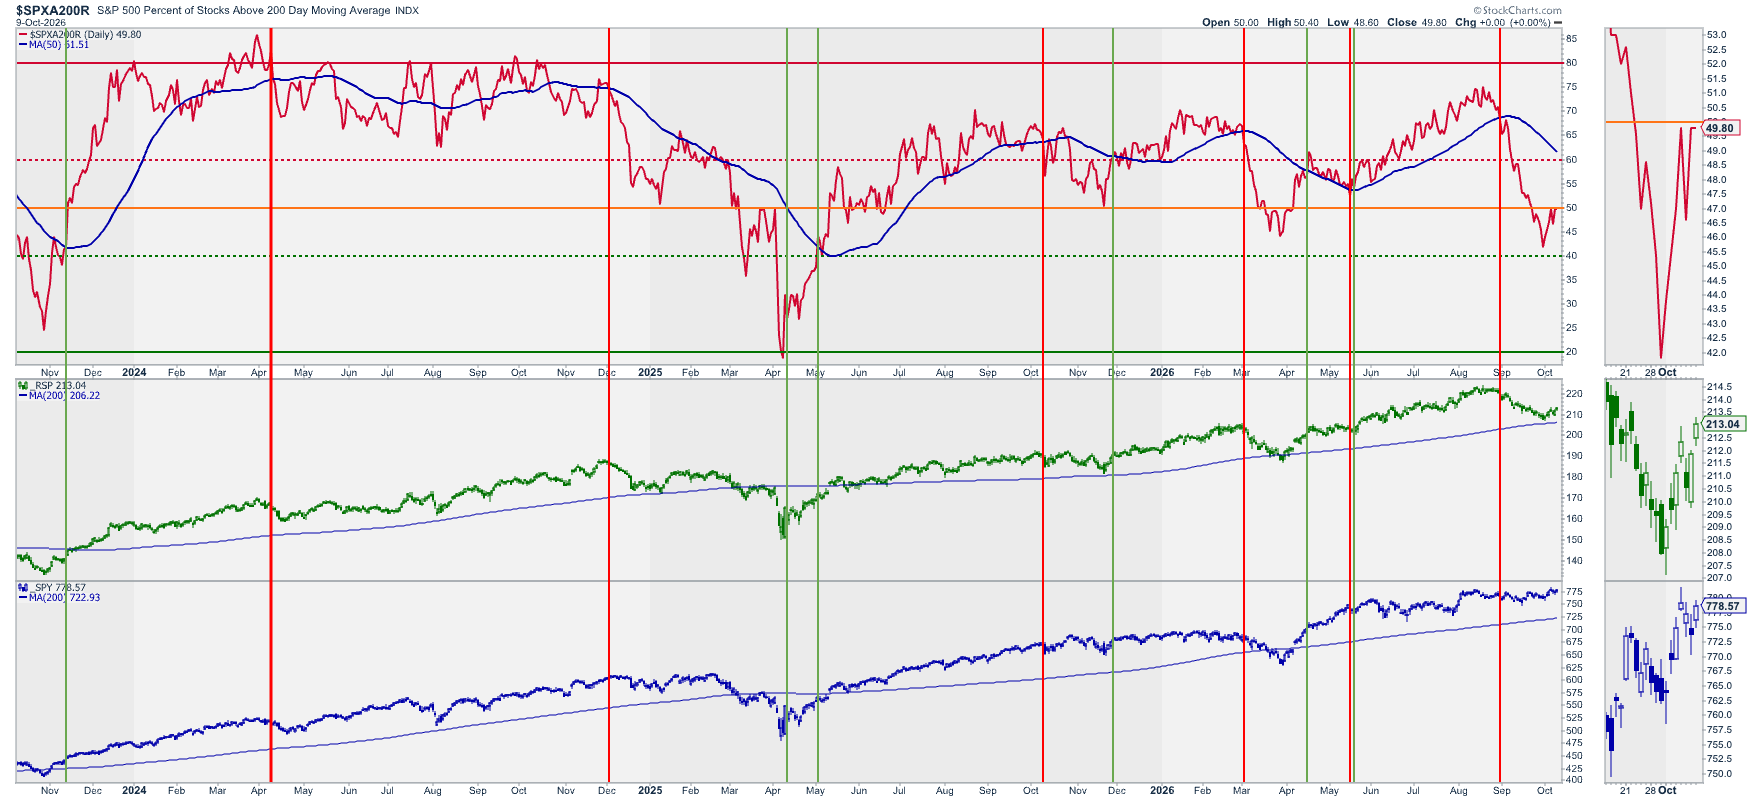
Analysis: Same analysis as last week: % of stocks above their 200D SM reversed from a sub-50 level. % of stocks above their 20D and 50D signals both bounced off their 20s level. At the same time the RSP index (equal weight S&P500) found support on the daily 200D SMA. All these signals mark the beginning of a bullish move.
ACH: 8
Volatility: Ratio Low Vol. Stocks / SPY vs. RSP & SPY
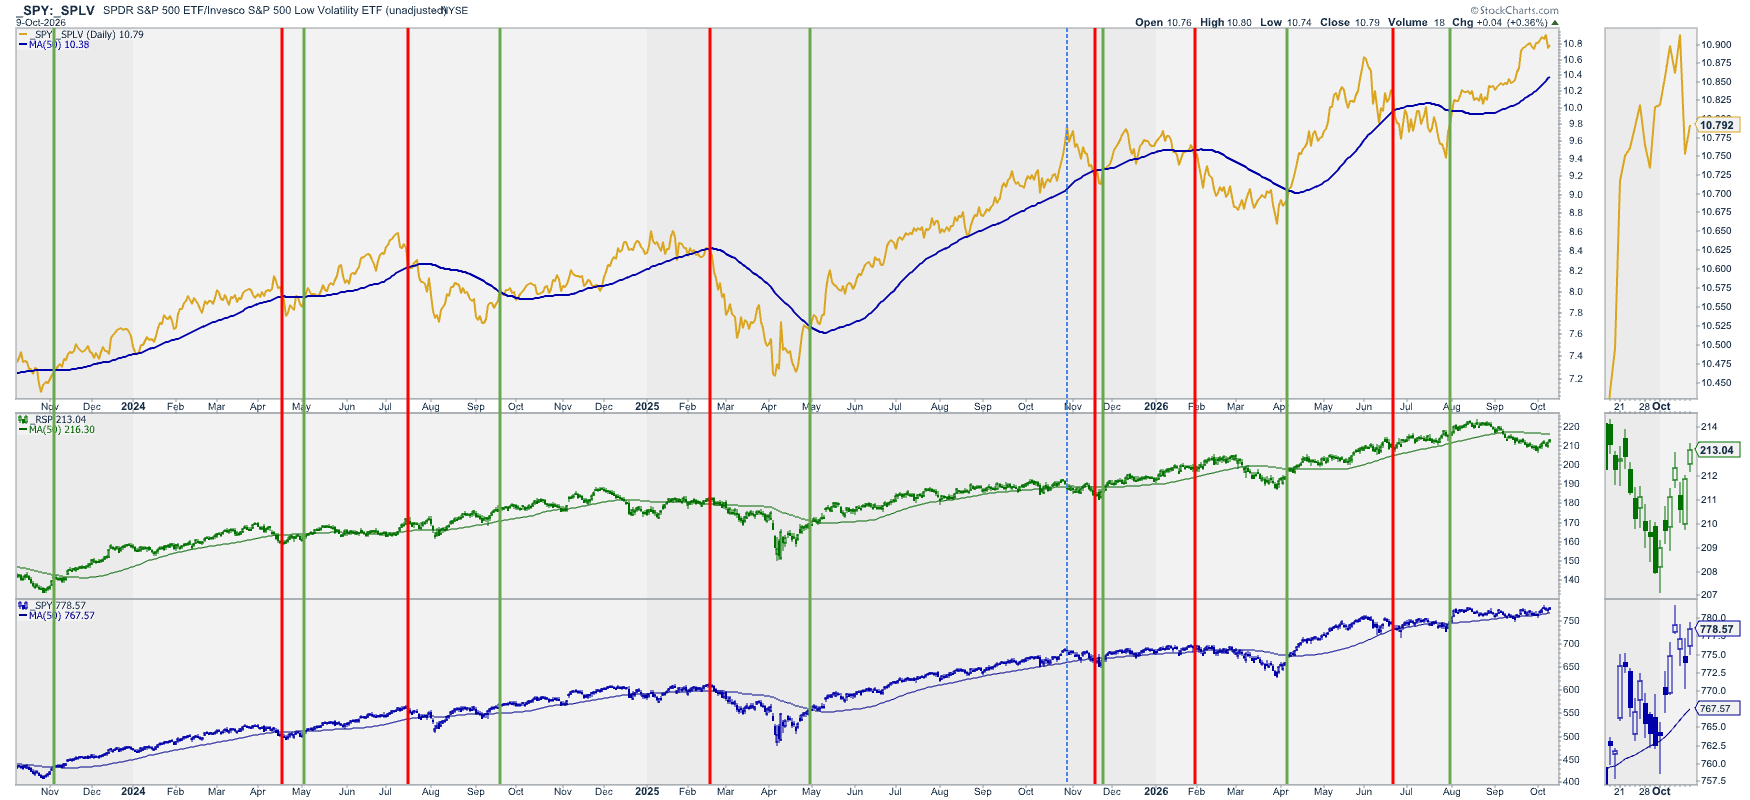
Analysis: We can see some “toppy” action in this ratio. I’m advancing the AMAT clock to to the distribution quarter.
ACH: 11
Volatility: (Inverted) VIX vs. SPY
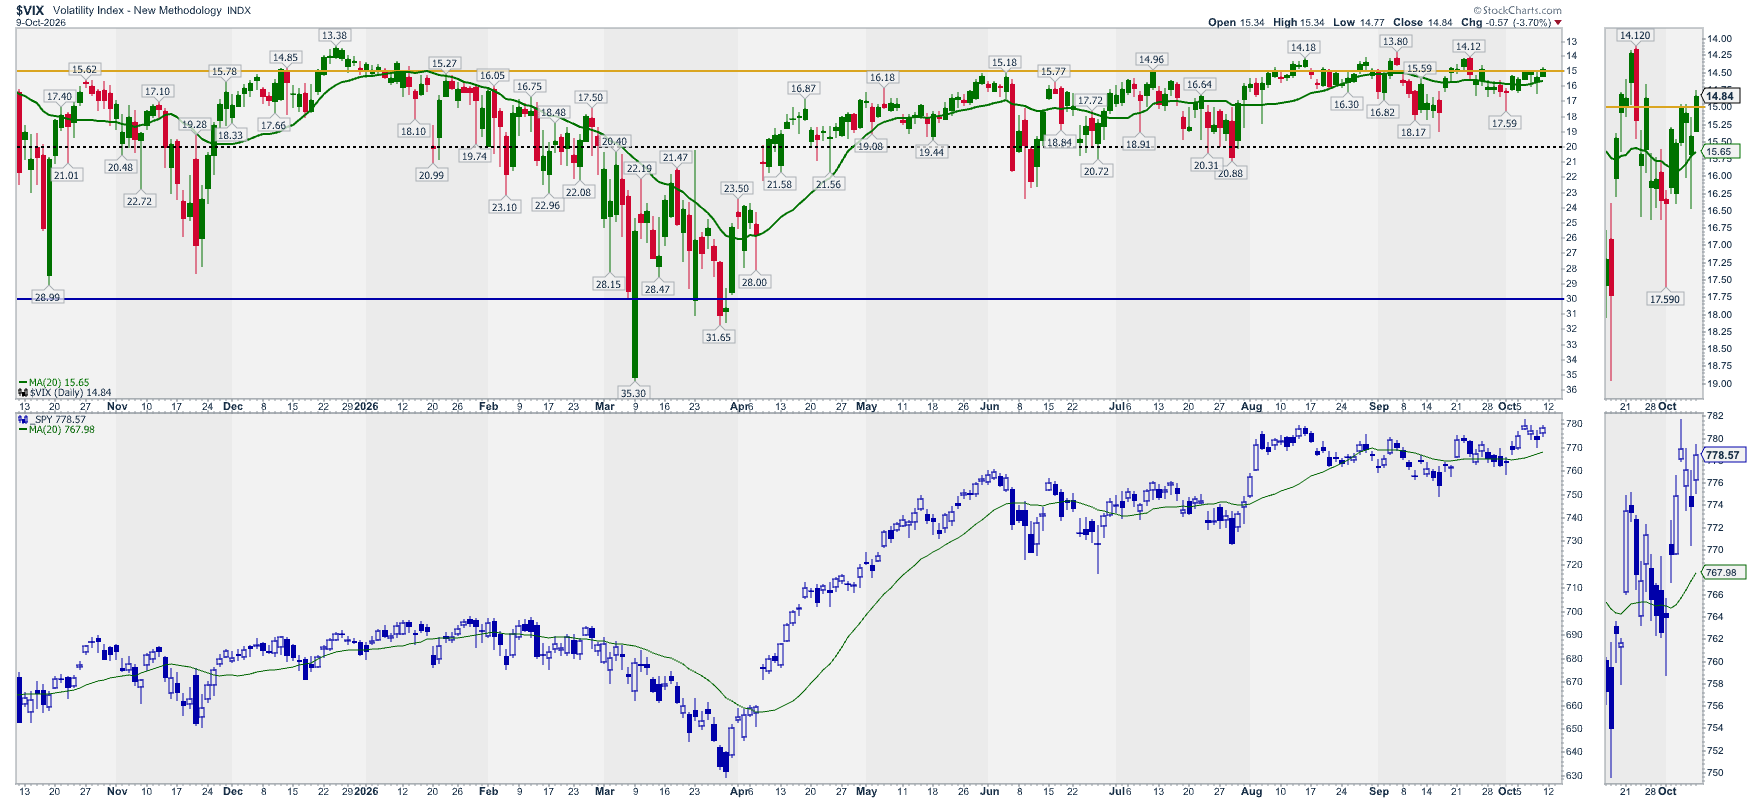
Note: This chart is mainly to detect extreme volatility situations that, once they reverse, offer great long opportunities in the market.
Analysis: Same as last week: Inverted VIX crossed back above the SMA signal line. Low volatility is expected.
ACH: 12
Options: (Inverted) Put/Call Ratio vs. SPY
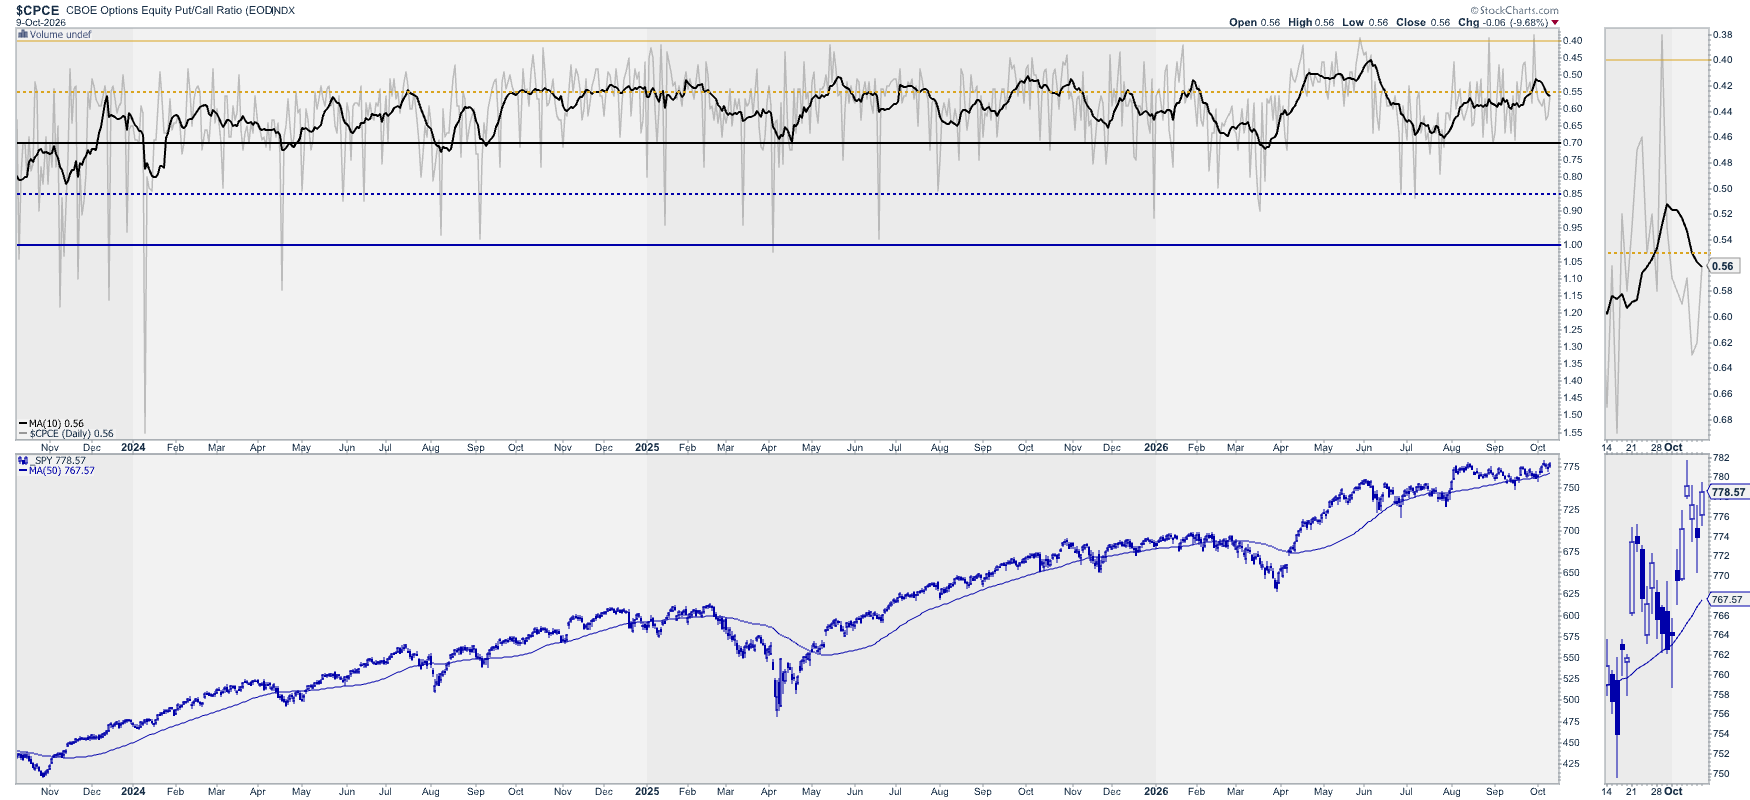
Analysis: The uptrend has stalled.
ACH: 12
Options: Gamma Exposure – SPY
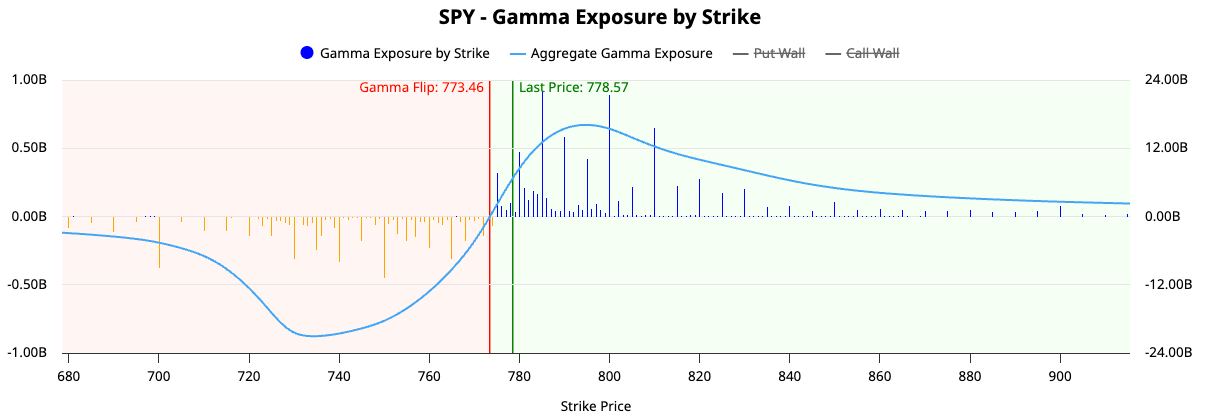
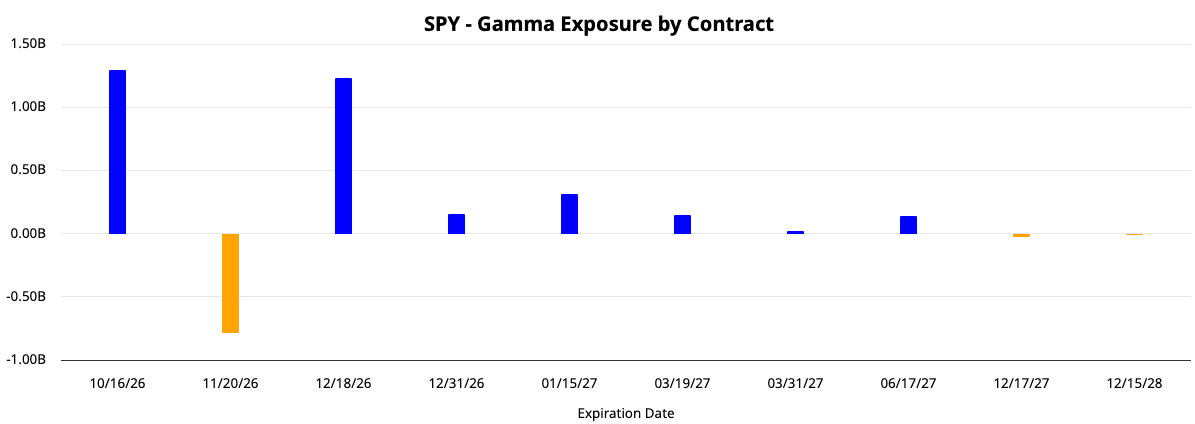
Analysis: In positive GEX territory with walls creeping up the price ladder. Future dated expirations are in clear positive territory with only the 20th of November expiration left in net negative territory (which most probably will see a turn to net positive territory).
Upper wall(s): 785, 800, 810
Lower wall(s): 750
Sectors: Where is it happening?
Sectors Rotation
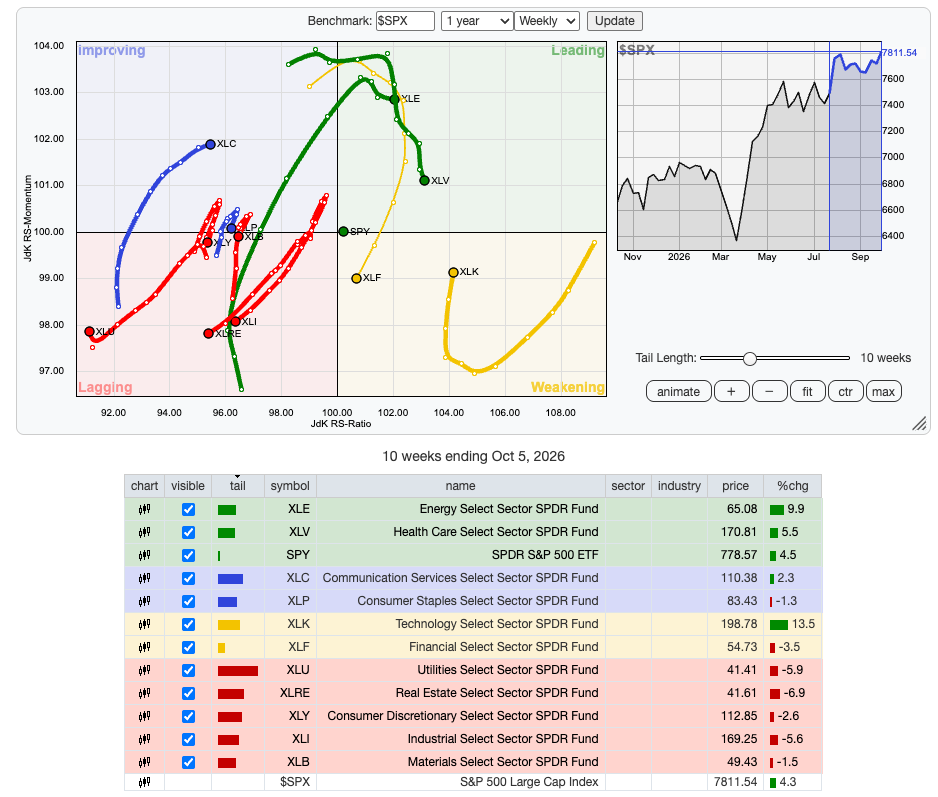
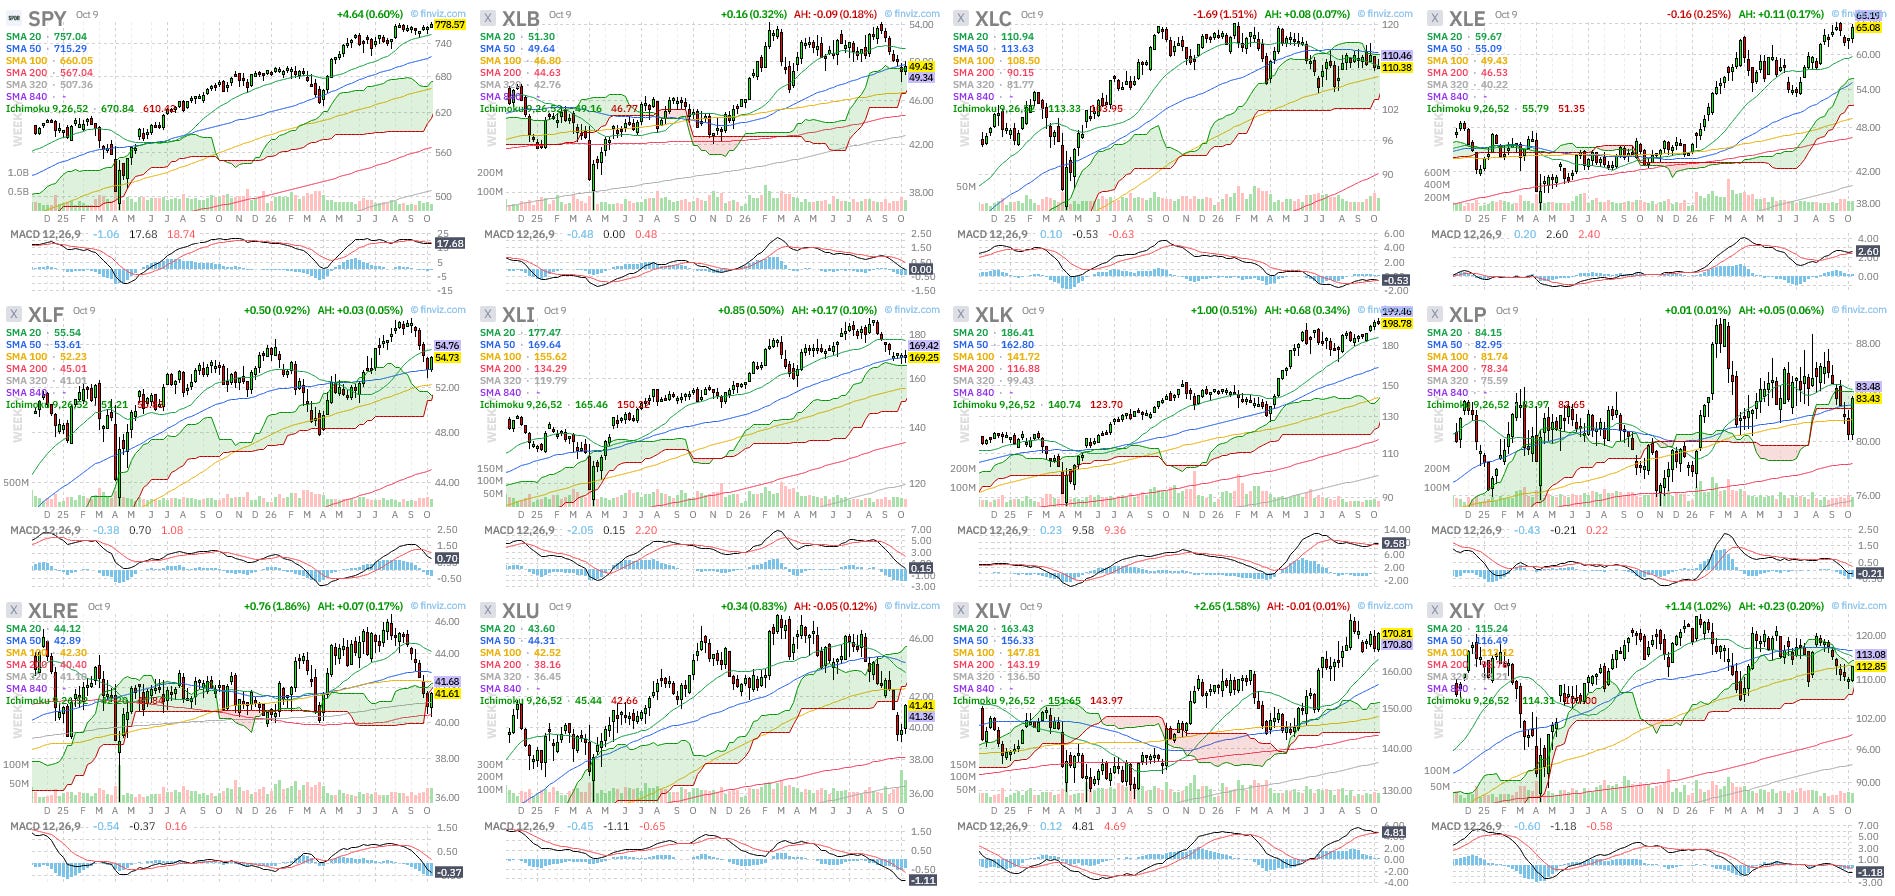
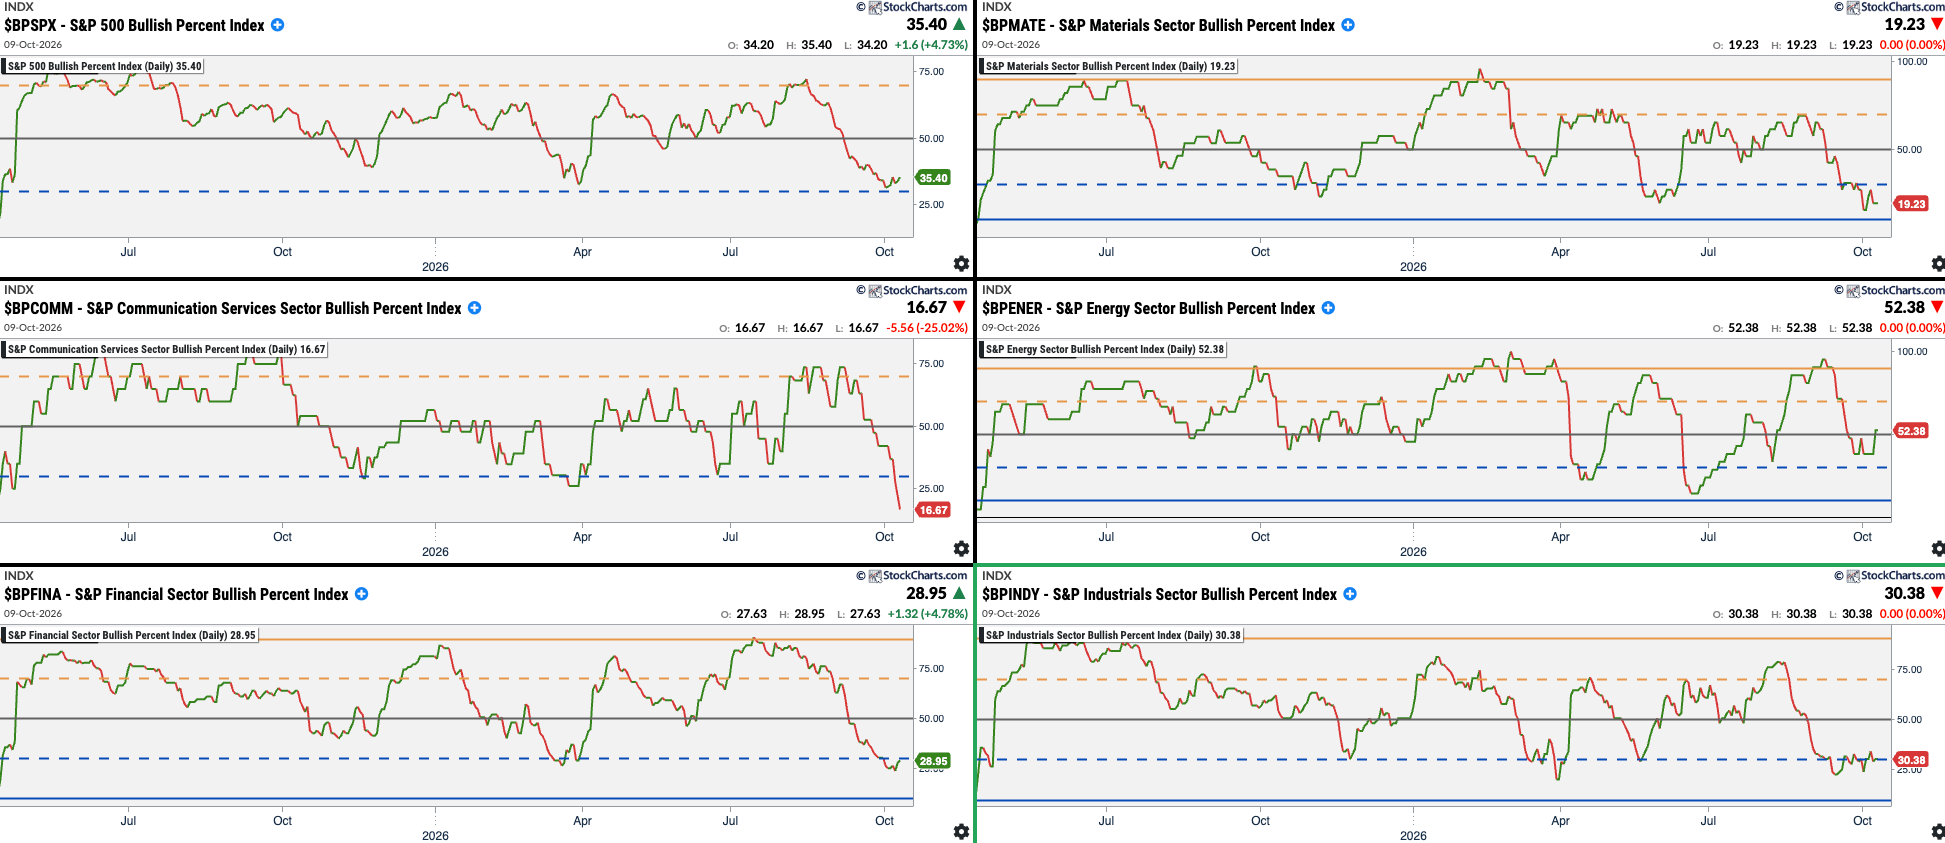
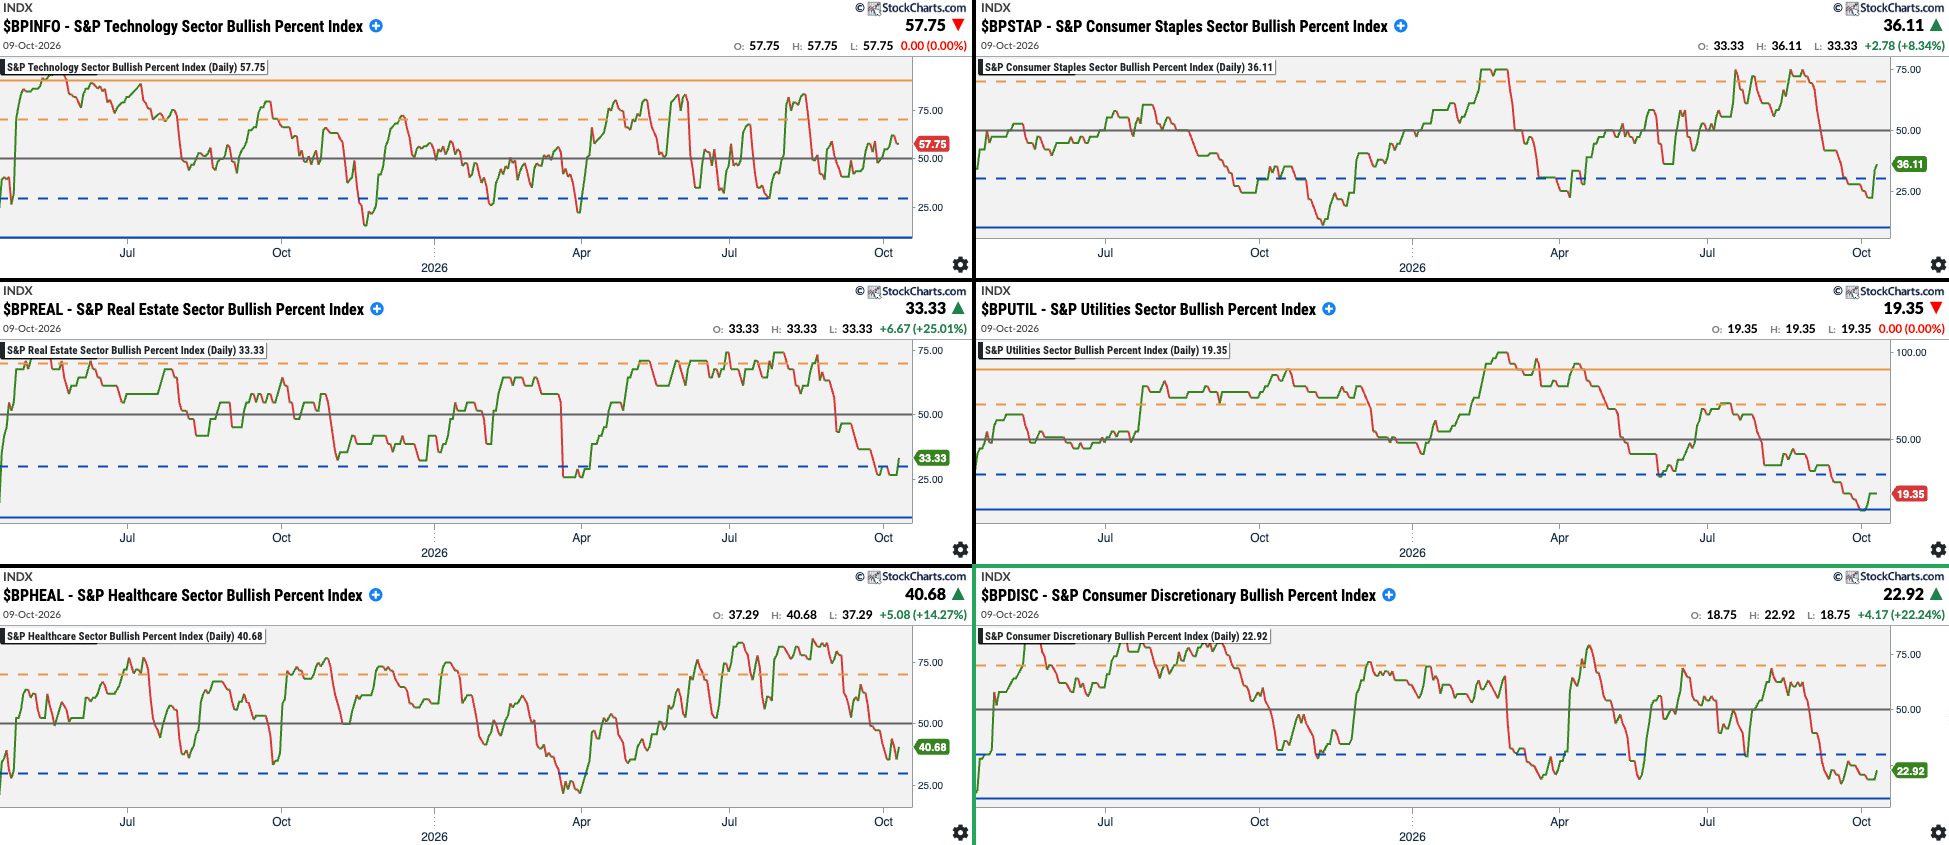
Summary:


AMAT Portfolios
Forever Portfolio

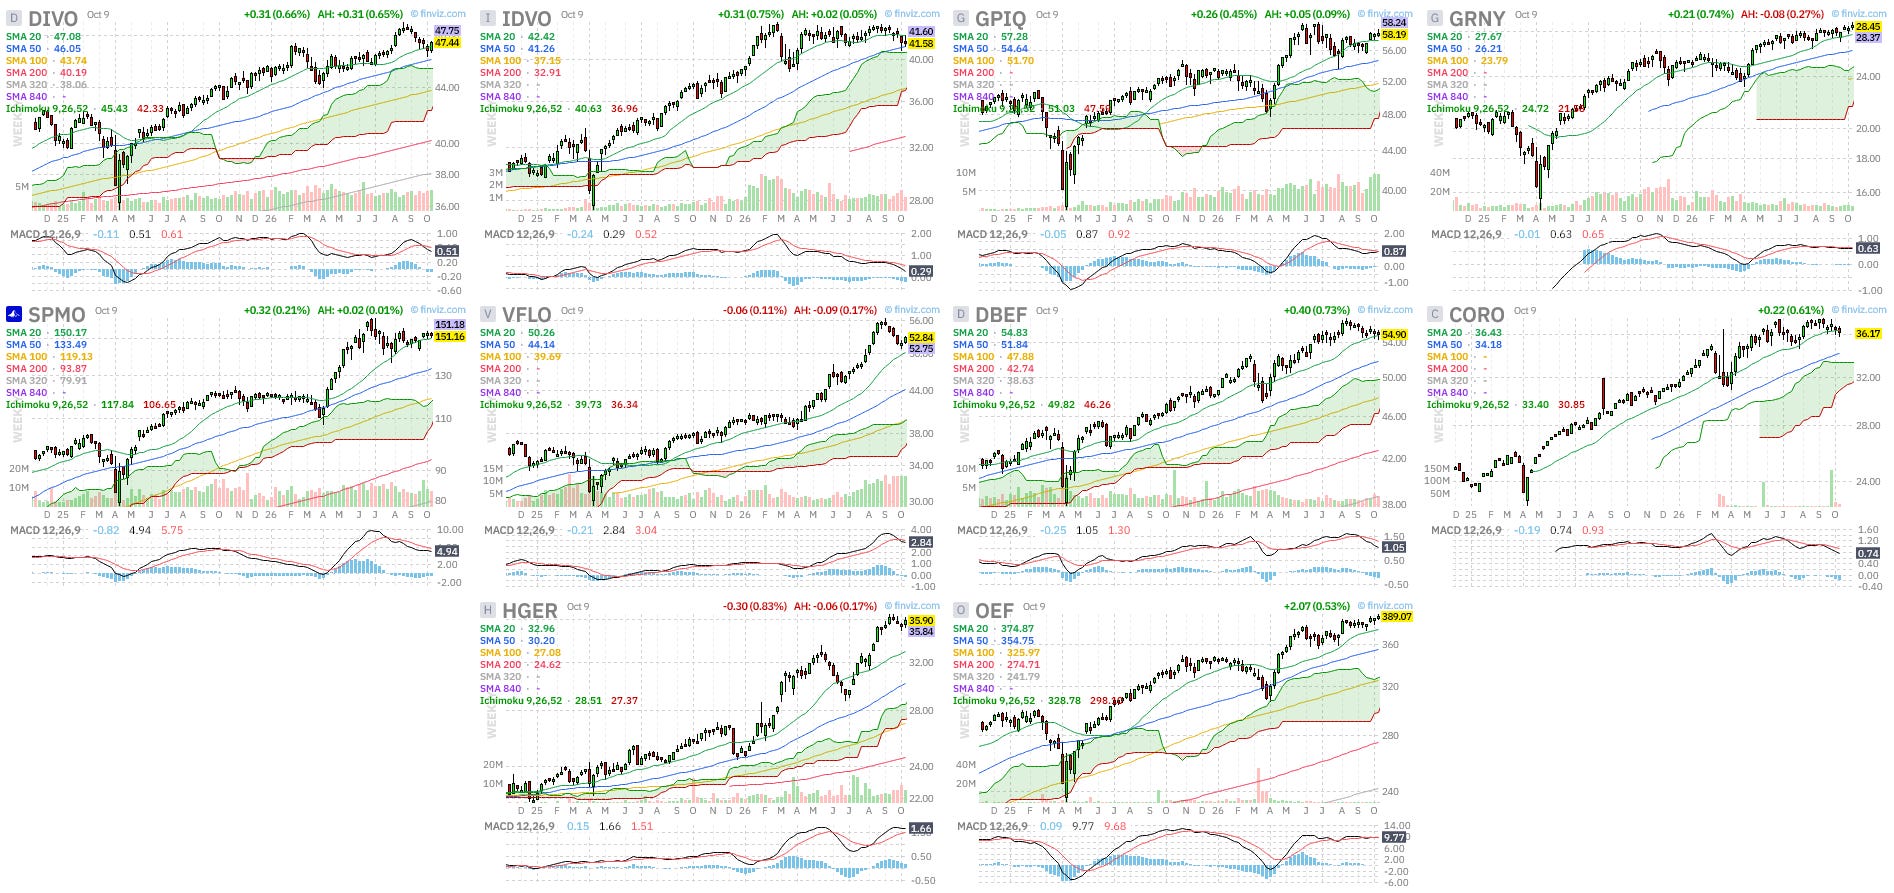
The World of Tomorrow

Summary:

Last Word
Below is a chart with the equal weight S&P 500 index (top - green), the bullish percent index (middle - blue), and the McClellan indicator (bottom - gold), for the last 5 years (daily).
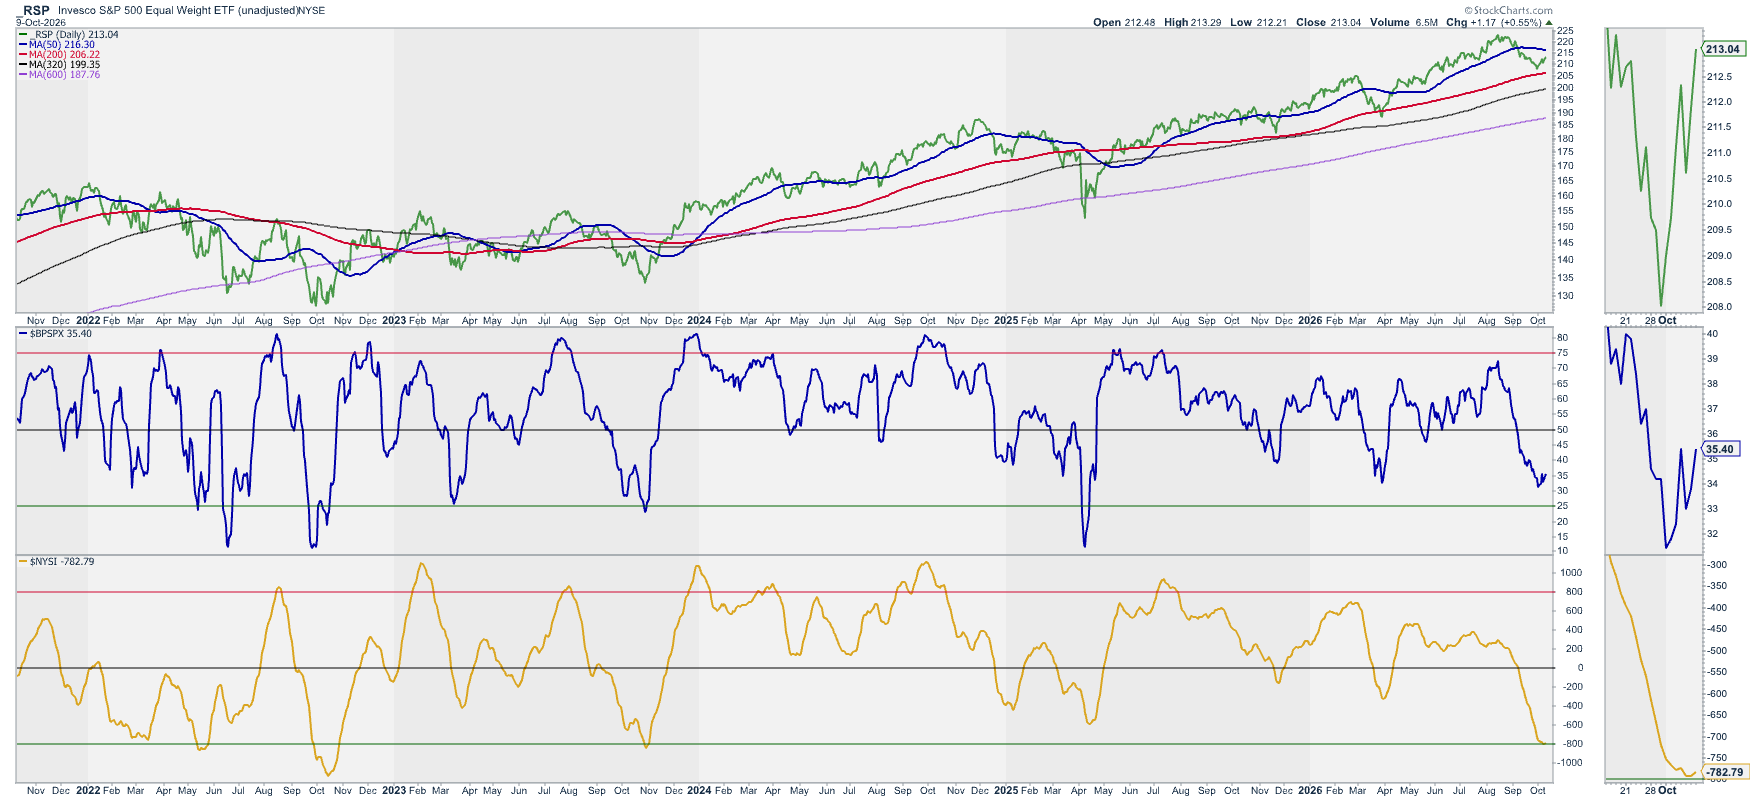
At the current levels in both the bullish percent index and the McClellan indicator, we usually have rallies in the market.
The following chart compares the equal weighted (RSP) (top - green) with the cap. weighted (SPY) (middle - blue) indexes. The bottom (black) is the ratio between the two indexes. Currently, the RSP is underperforming the SPY, or said in other words, the leaders and leading and the laggers are lagging.
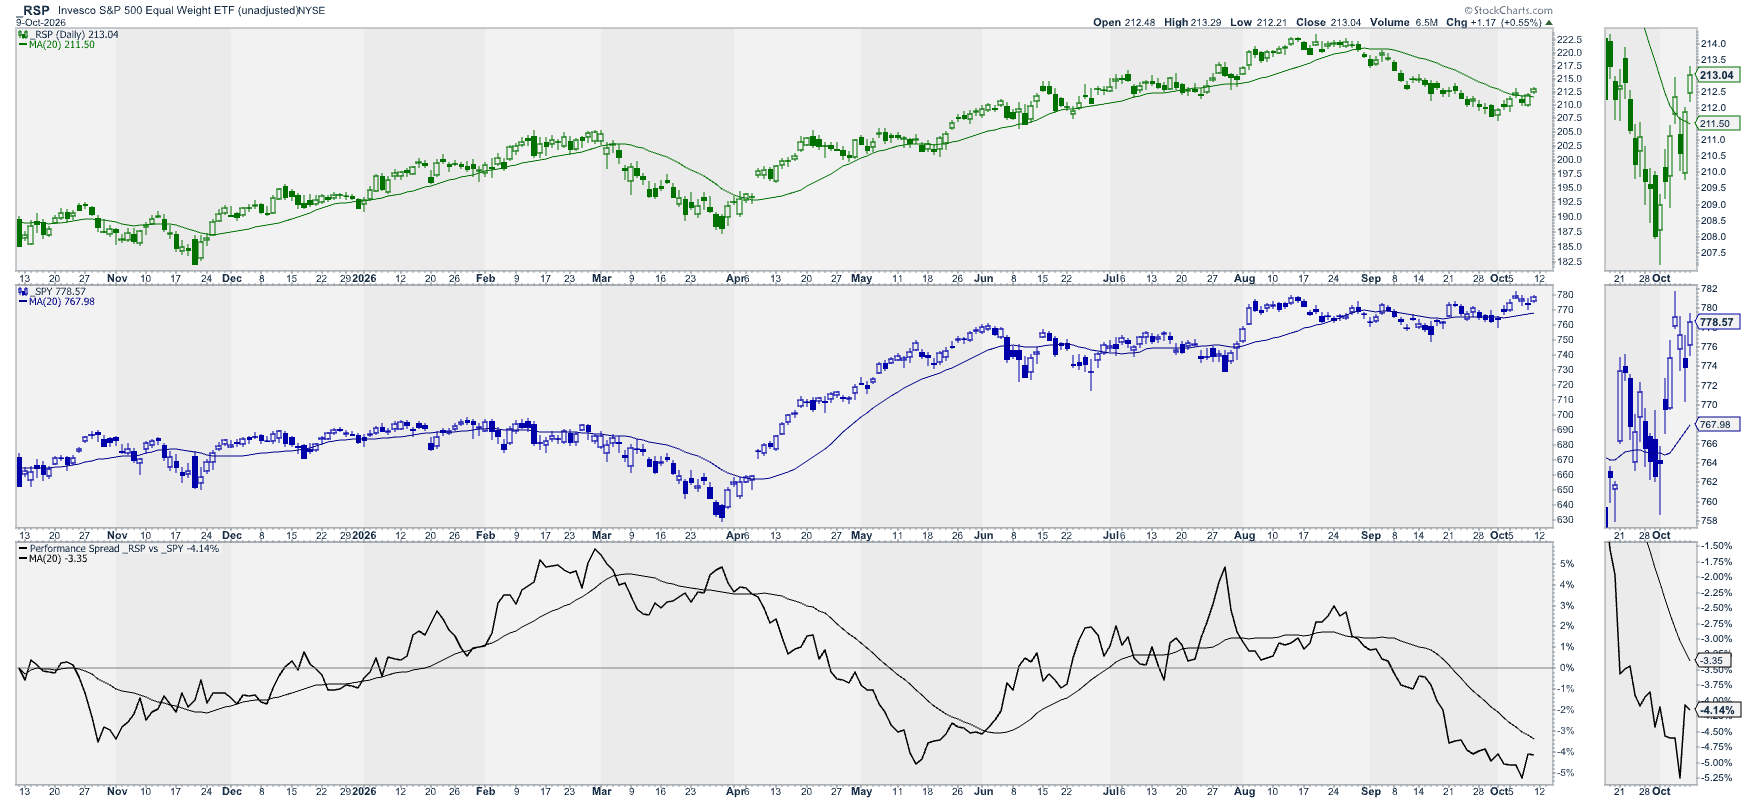
In my opinion, if we can get some positive news from the war fronts that could reduce the price of oil, which will have an impact to lower rates, we can see a significant rally in all markets. So far, the most isolated companies from financial conditions (big tech) are the ones keeping the cap. weighted indexes outperforming everything else. So, stay with the winners.
Disclaimer: The content on AMAT Investing is strictly for educational and learning purposes. The author is not a licensed financial advisor and holds no formal financial education. This post does not constitute professional financial advice. All investing involves risk of loss. Always conduct your own research and consult a licensed professional before making any investment decisions.