Context: Why is it happening?
Economic Production: ISM PMI vs. SPX
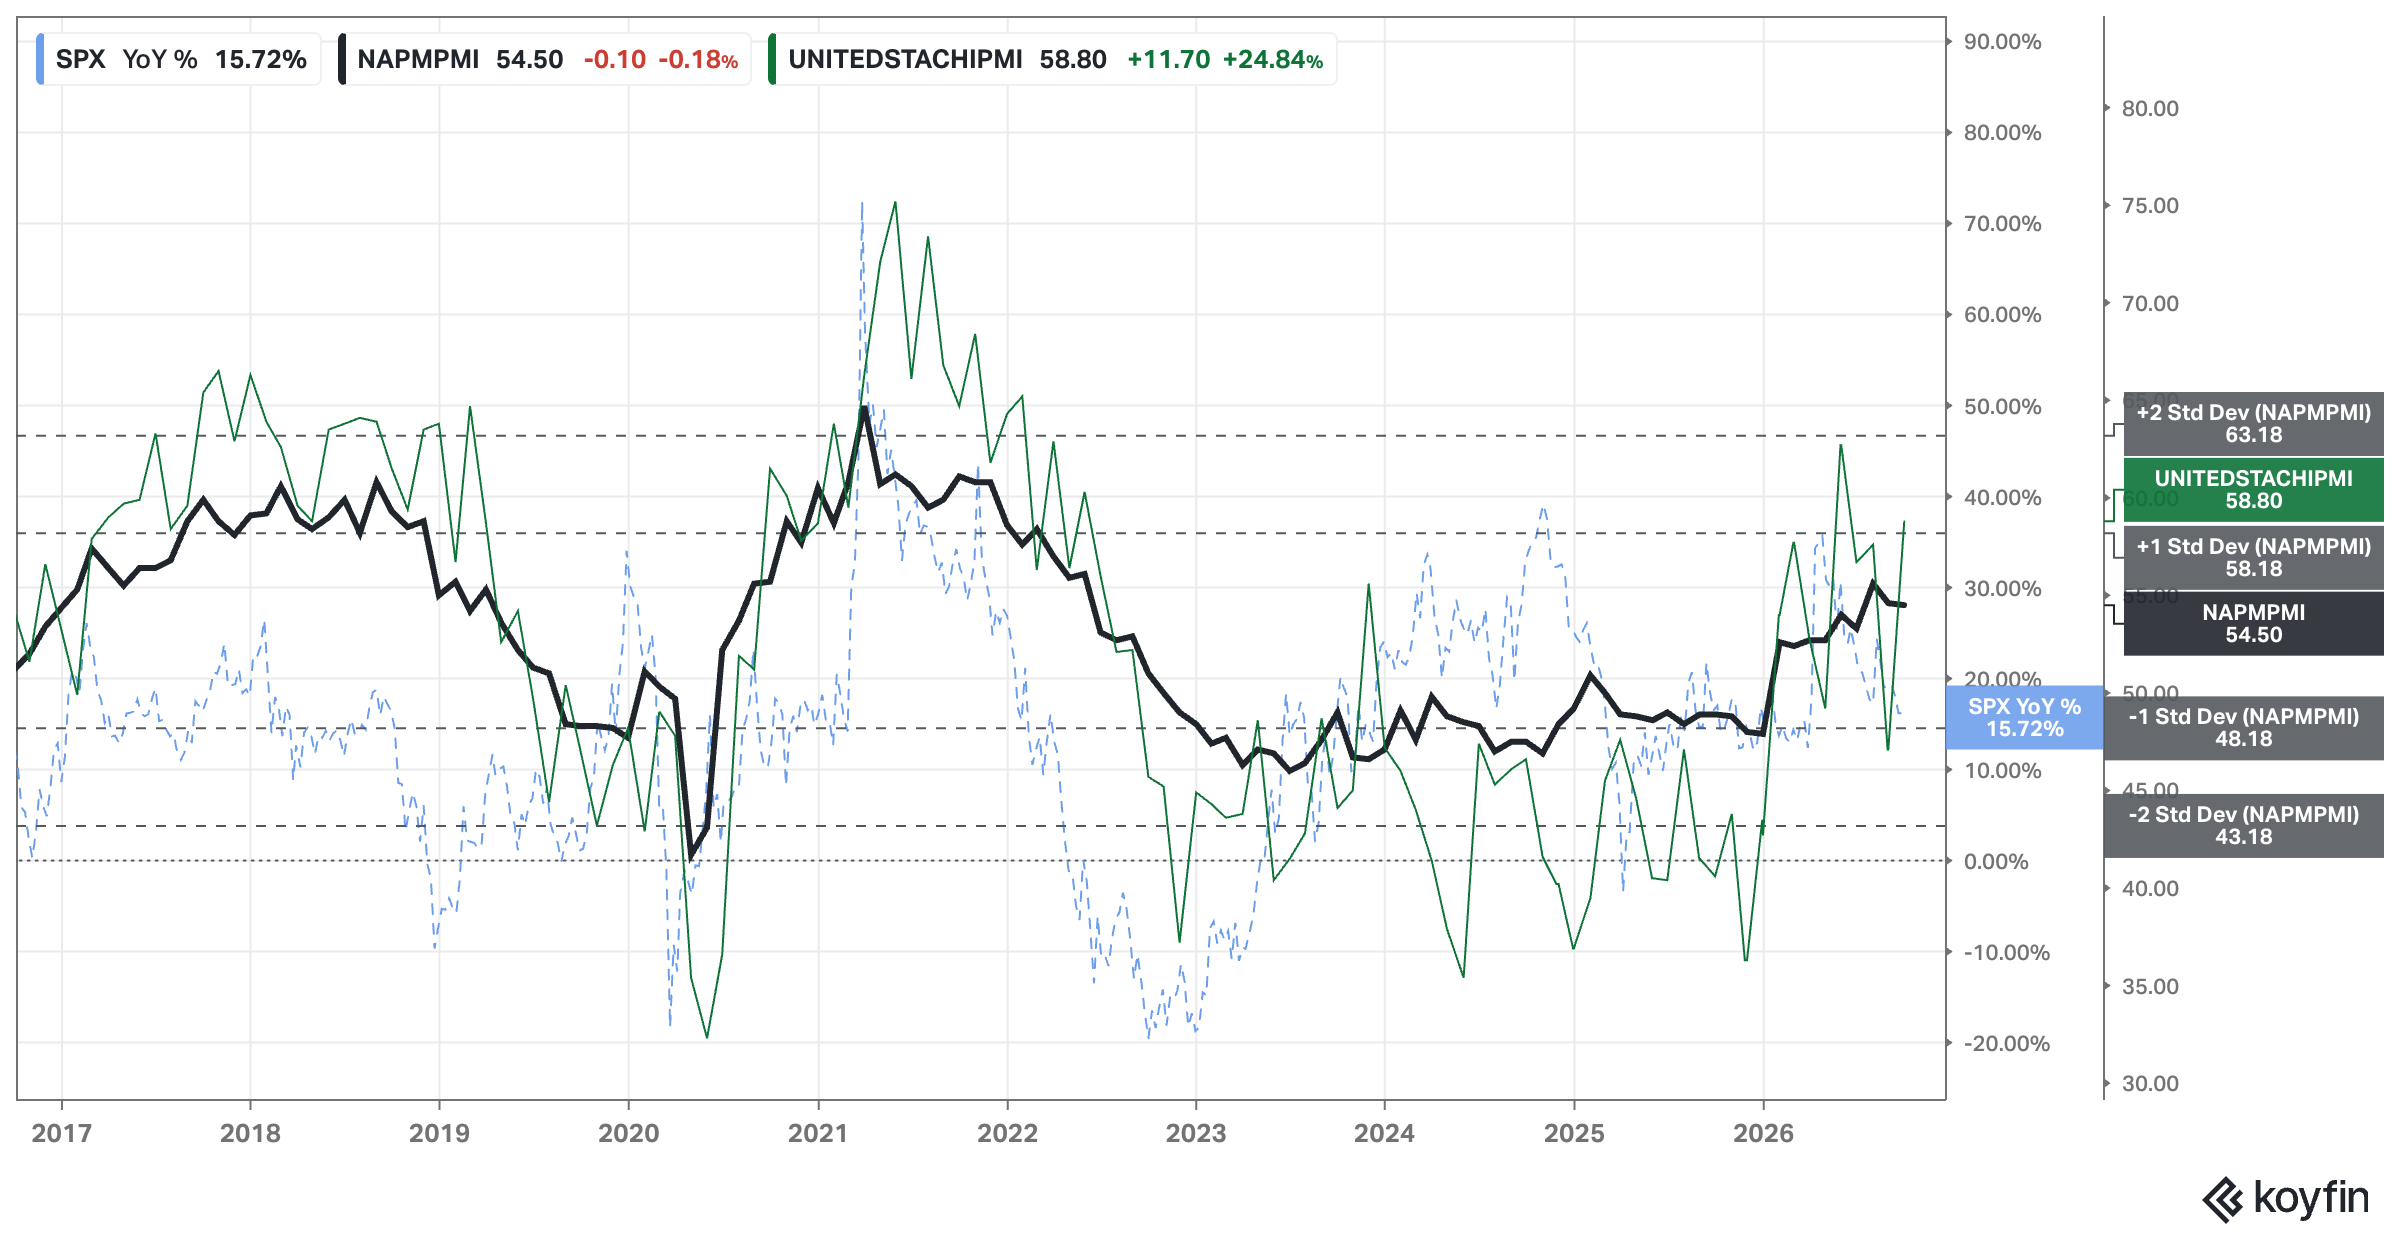
Analysis: No significant changes since last week.
ACH: 8
Economic Activity: Regional Banks Performance
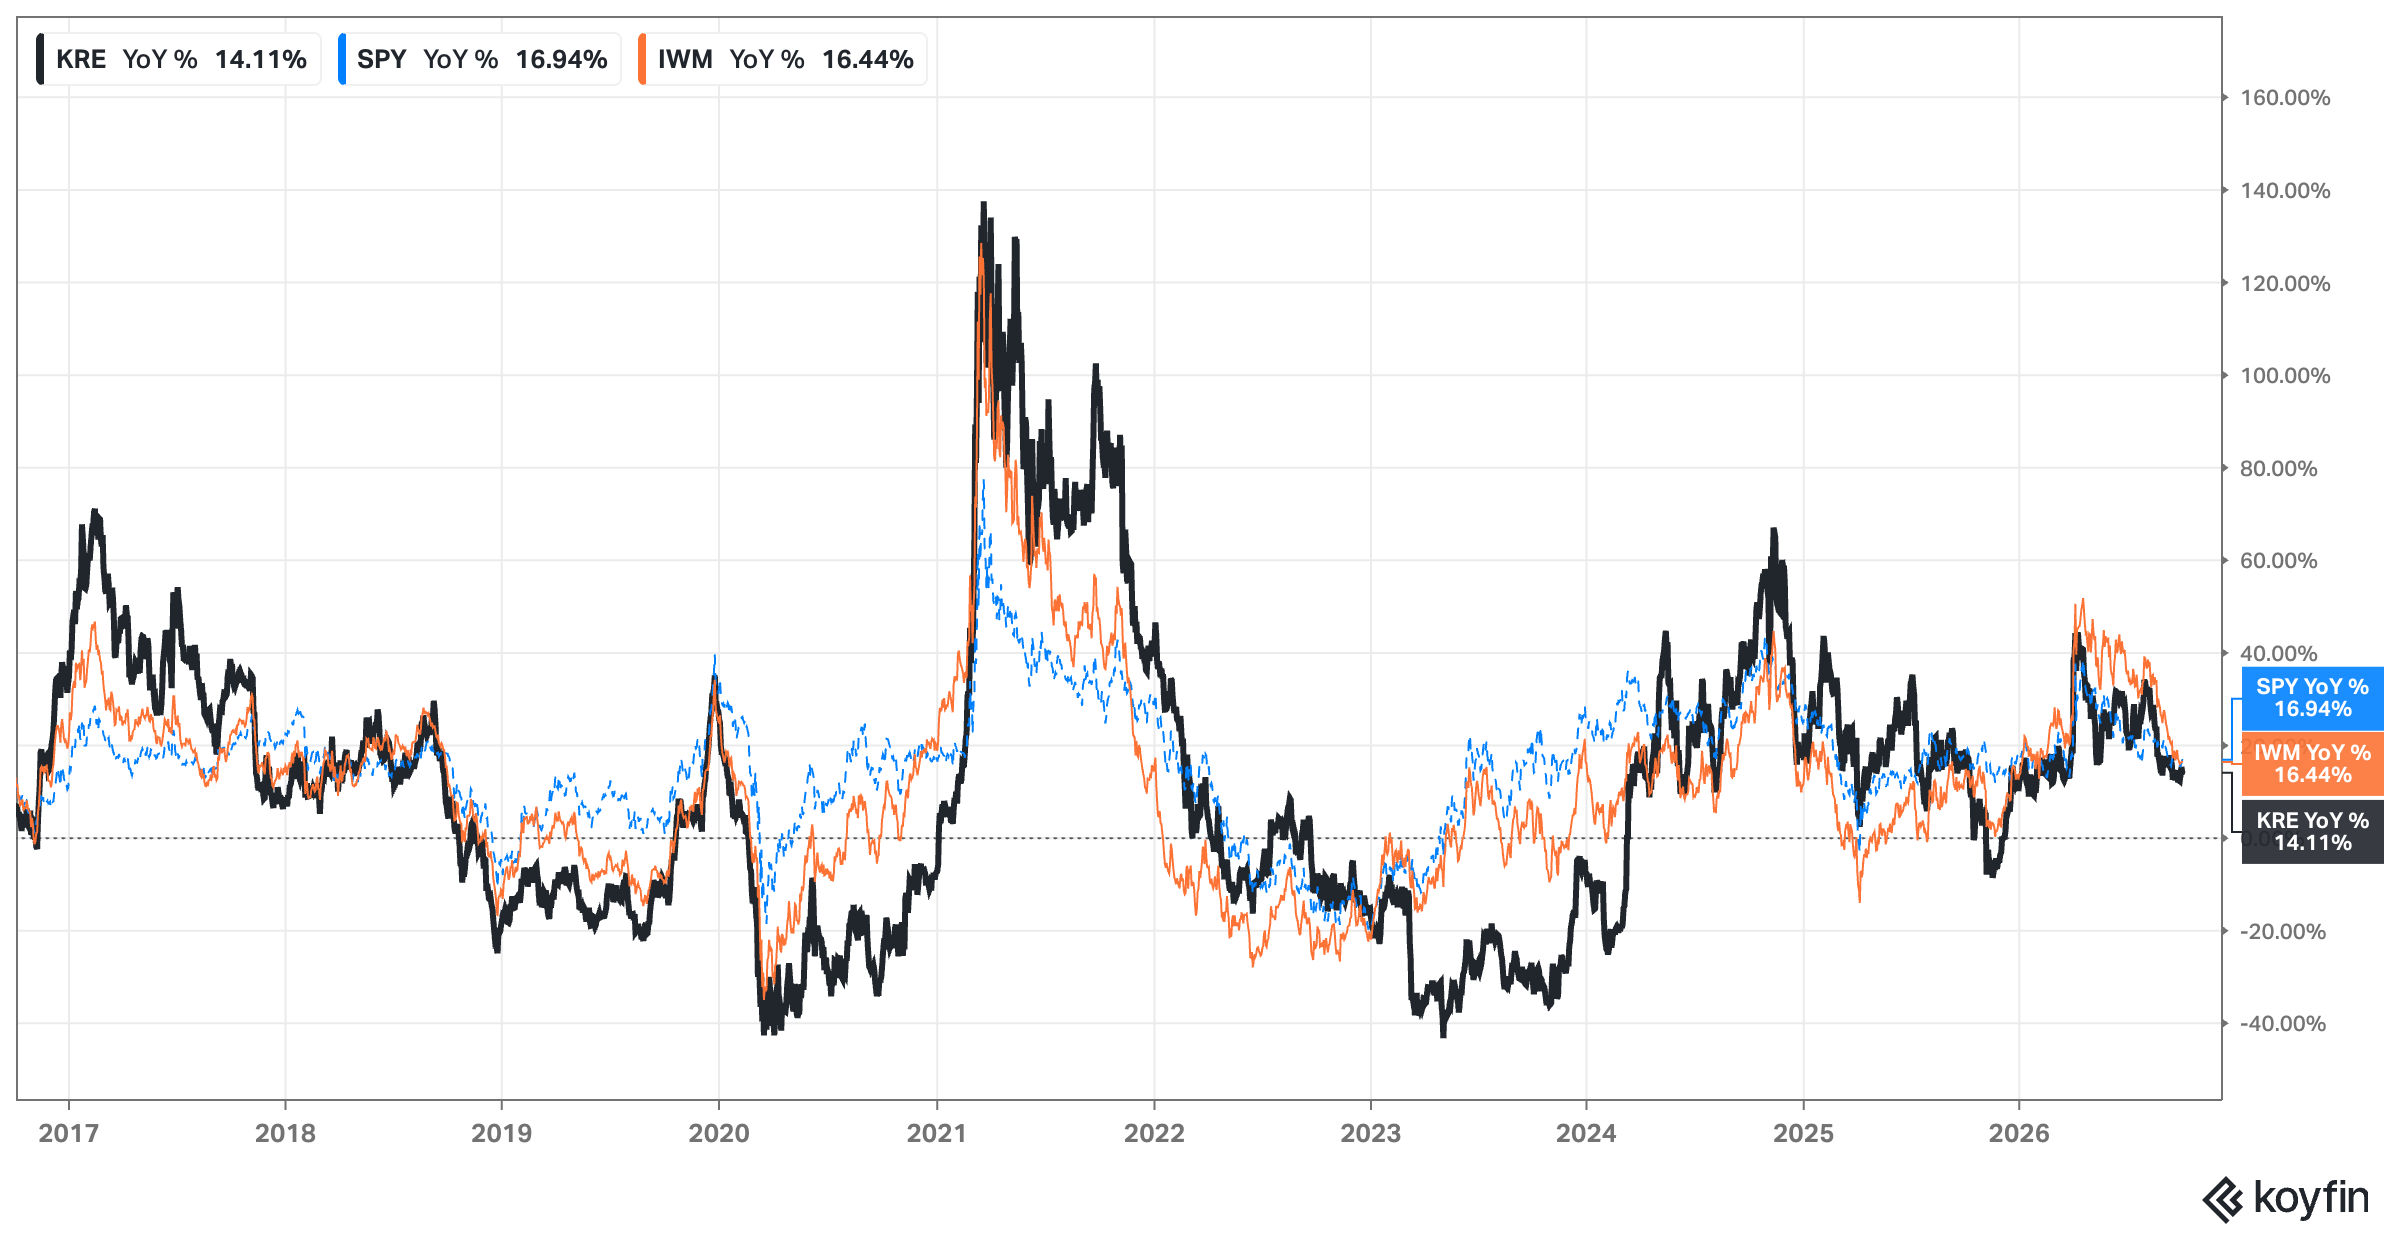
Analysis: The trend continues lower following rate hikes that negatively impact banks.
ACH: 3
Interest Rates: FED, 2yr, 10yr, and 30yr Rates
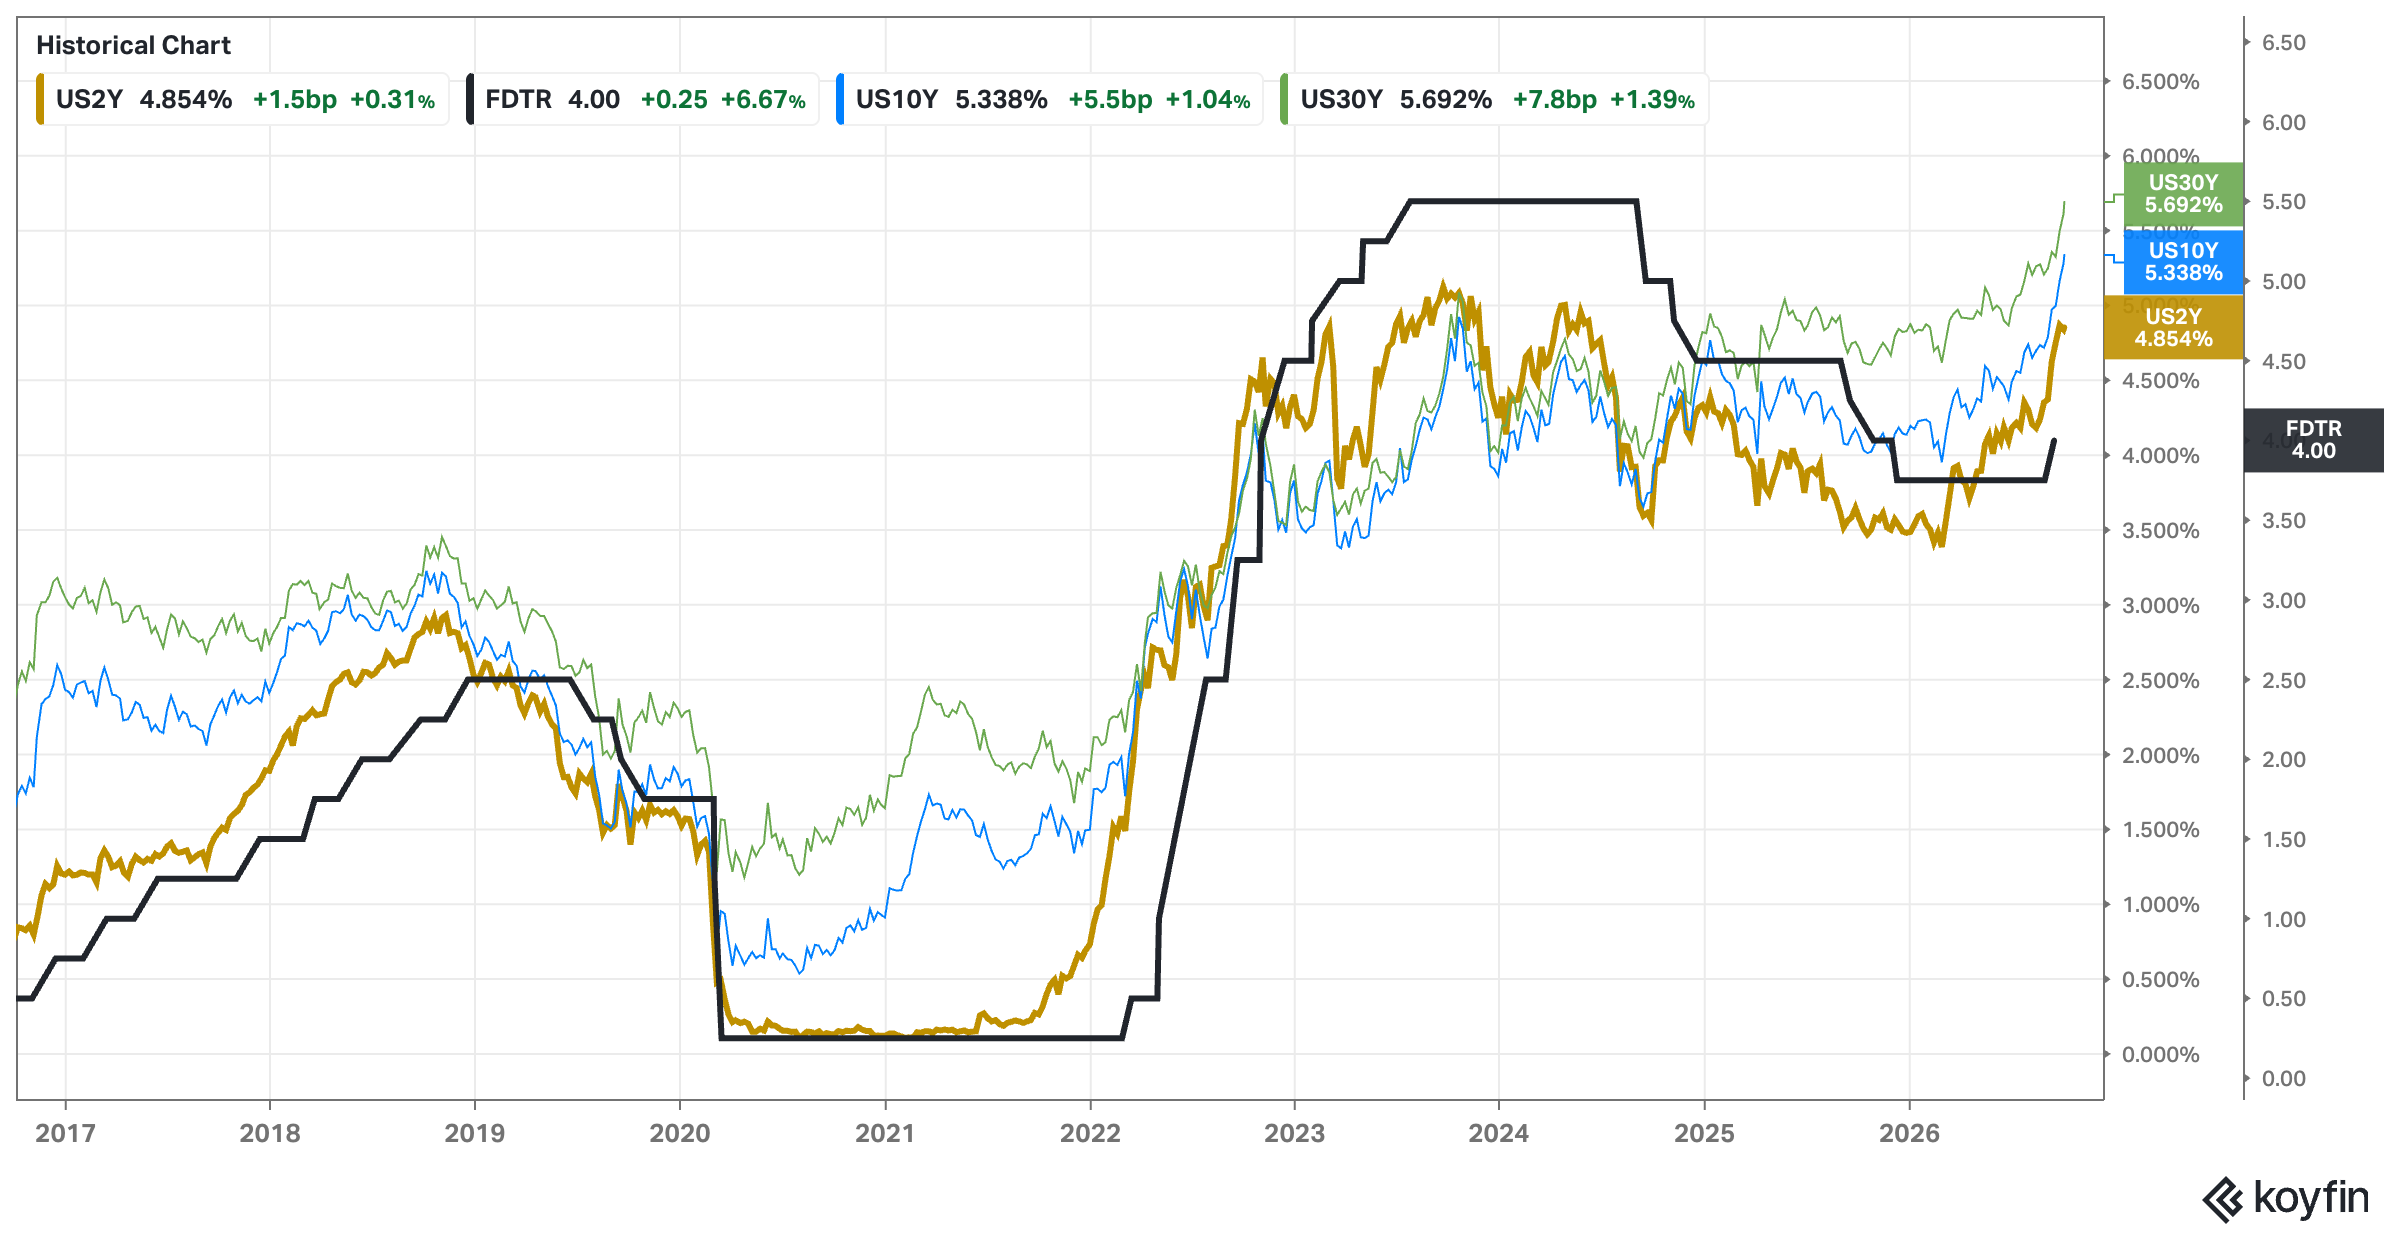
Analysis: Same comment as last week: Rates continue to increase and the market continues to ignore them. How long this will last is anyone’s guest.
ACH (inverted color): 11
Indexes: What is happening?
TA: Price Action, Trend, Momentum & Volume:
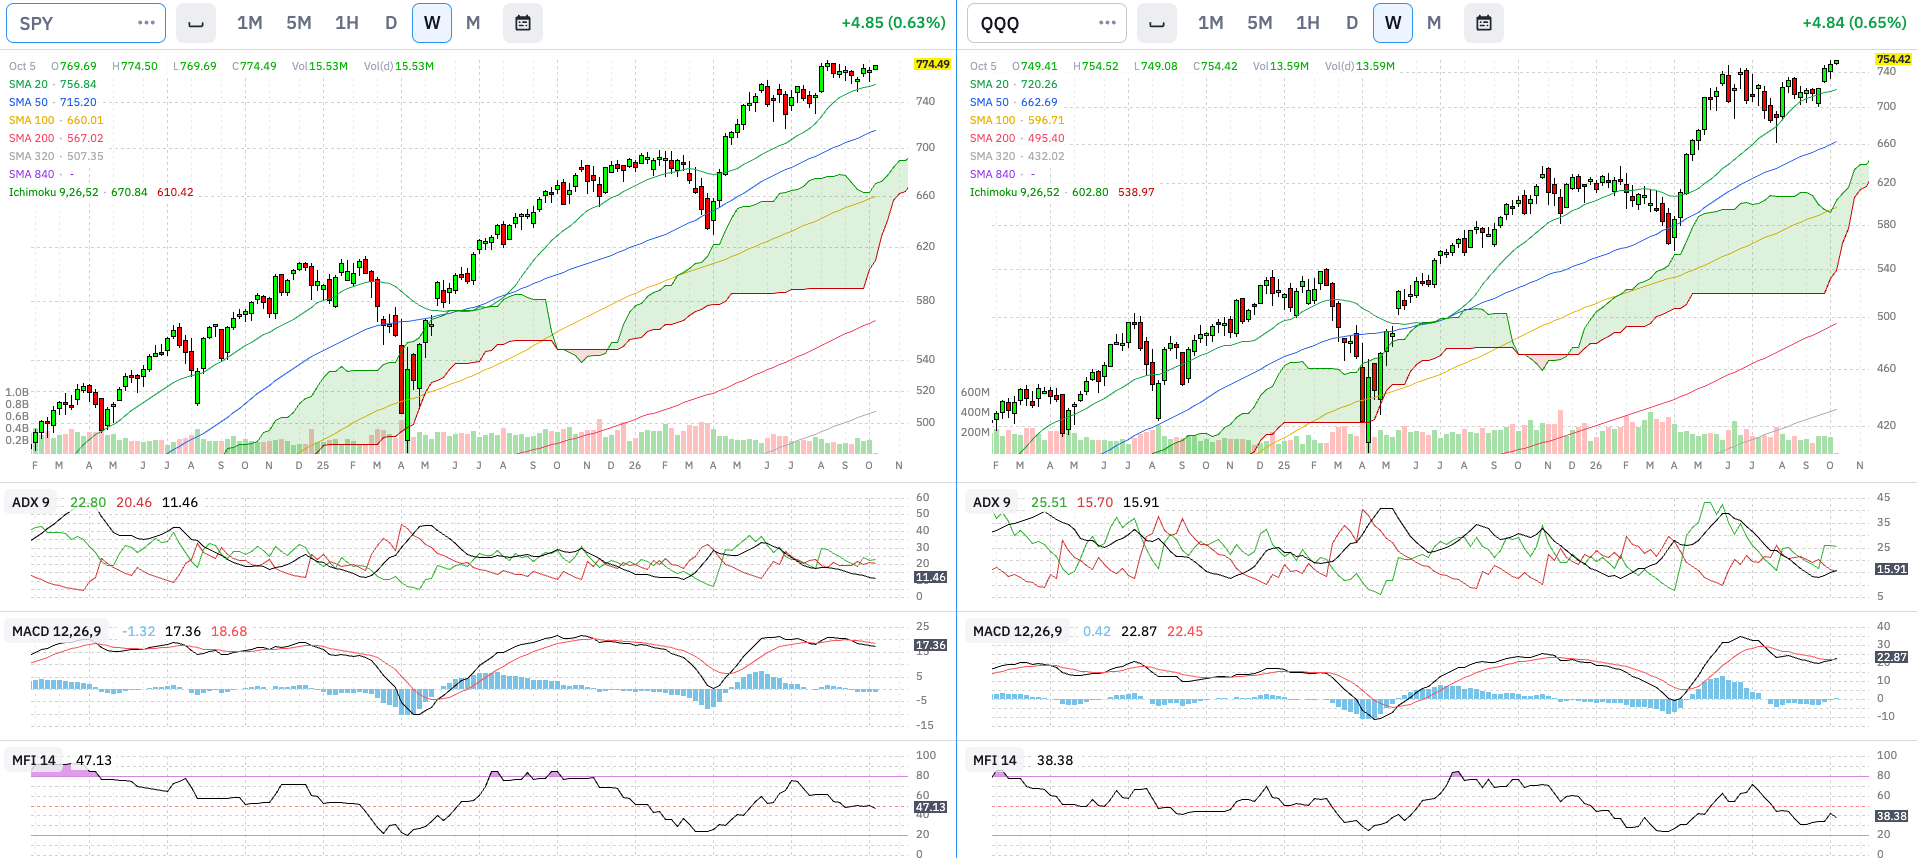
Weekly & Daily SPY, QQQ, and IWM
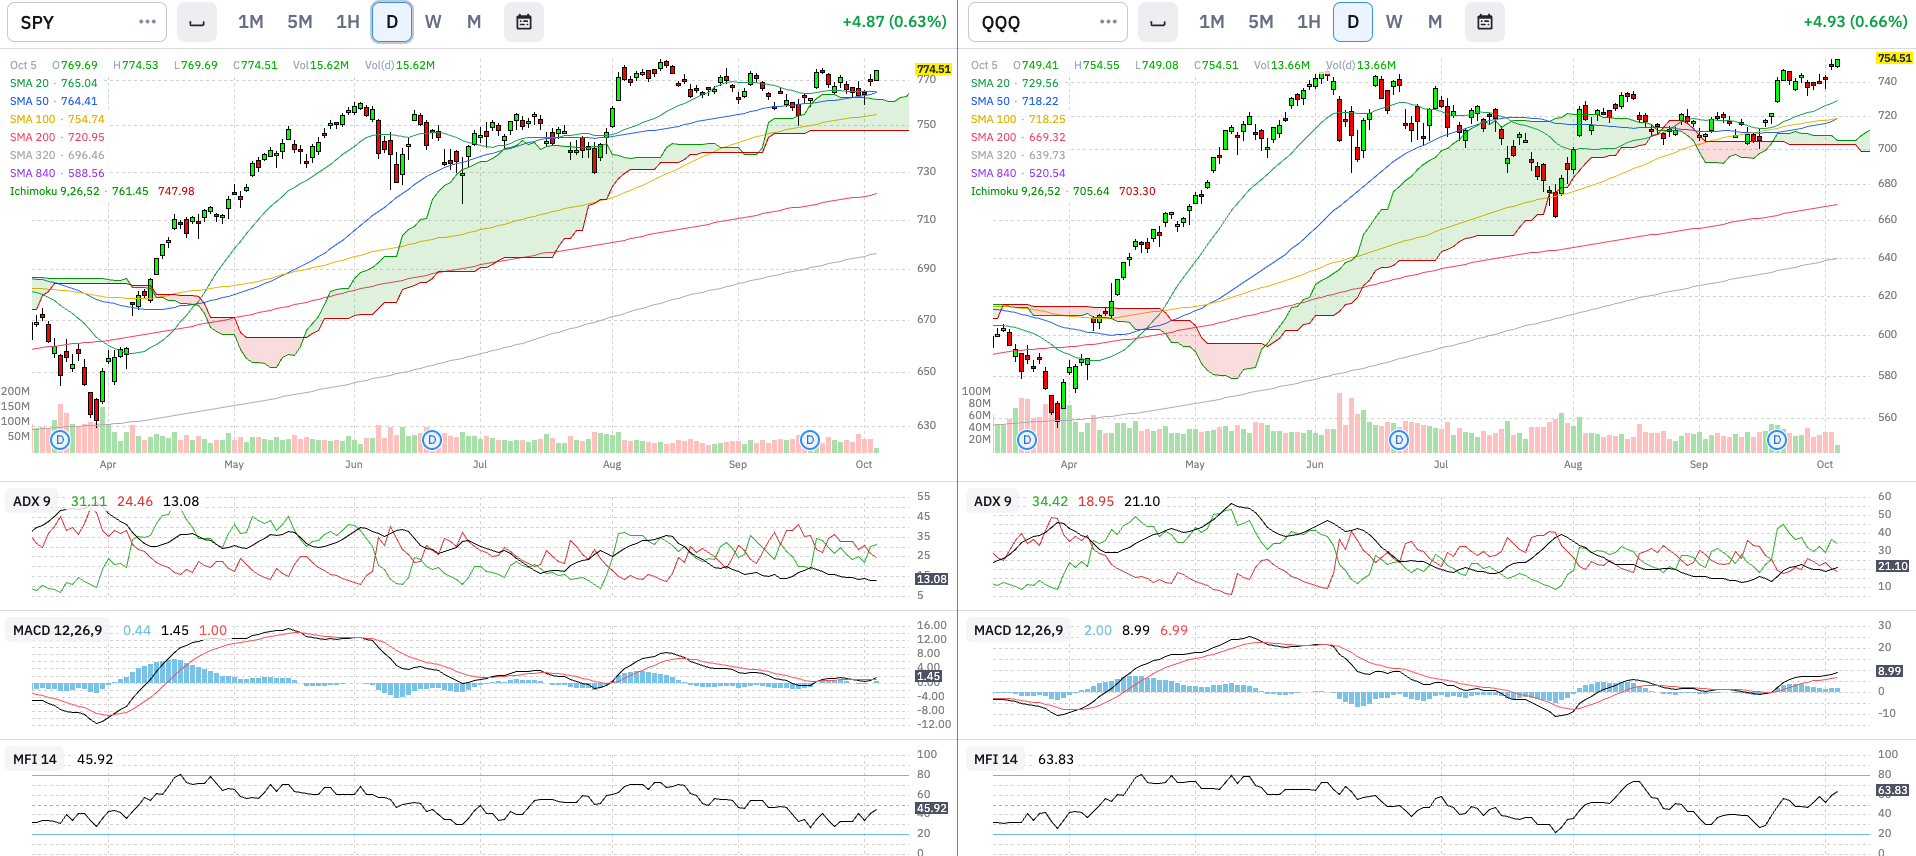
Technical Analysis:
Price (SMAs & Cloud): Weekly: QQQ reached ATHs and SPY is about to do the same. Daily: Both indexes bounced off on supports. Summary: Price action is definetly bullish. ACH: 9
Trend (ADX): Weekly: ADX seem to start an uptrend signal in both indexes. The trend is still weak yet this may signal the beginning of a new one. Daily: SPY is trendless and weak. QQQ has sharply reversed from a bearish to a bullish trend that is starting to get stronger. Summary: Weak but bullish trends are visible. ACH: 8
Momentum (MACD): Weekly: ‘Toppy’ MACD, specially in SPY, but we know that markets can stay in toppy momentum for quite a while. QQQ has more free upside room compared to historical levels. Daily: SPY hovering at the 0 level. QQQ is taking off. Summary: Momentum is building up towards the bullish side. ACH: 8
Volume (MFI): Weekly: Quite flat readings, as volume is relatively low. Daily: Both have turned up and signal a clear bullish trend. ACH: 8
Breadth: % Stocks above SMAs
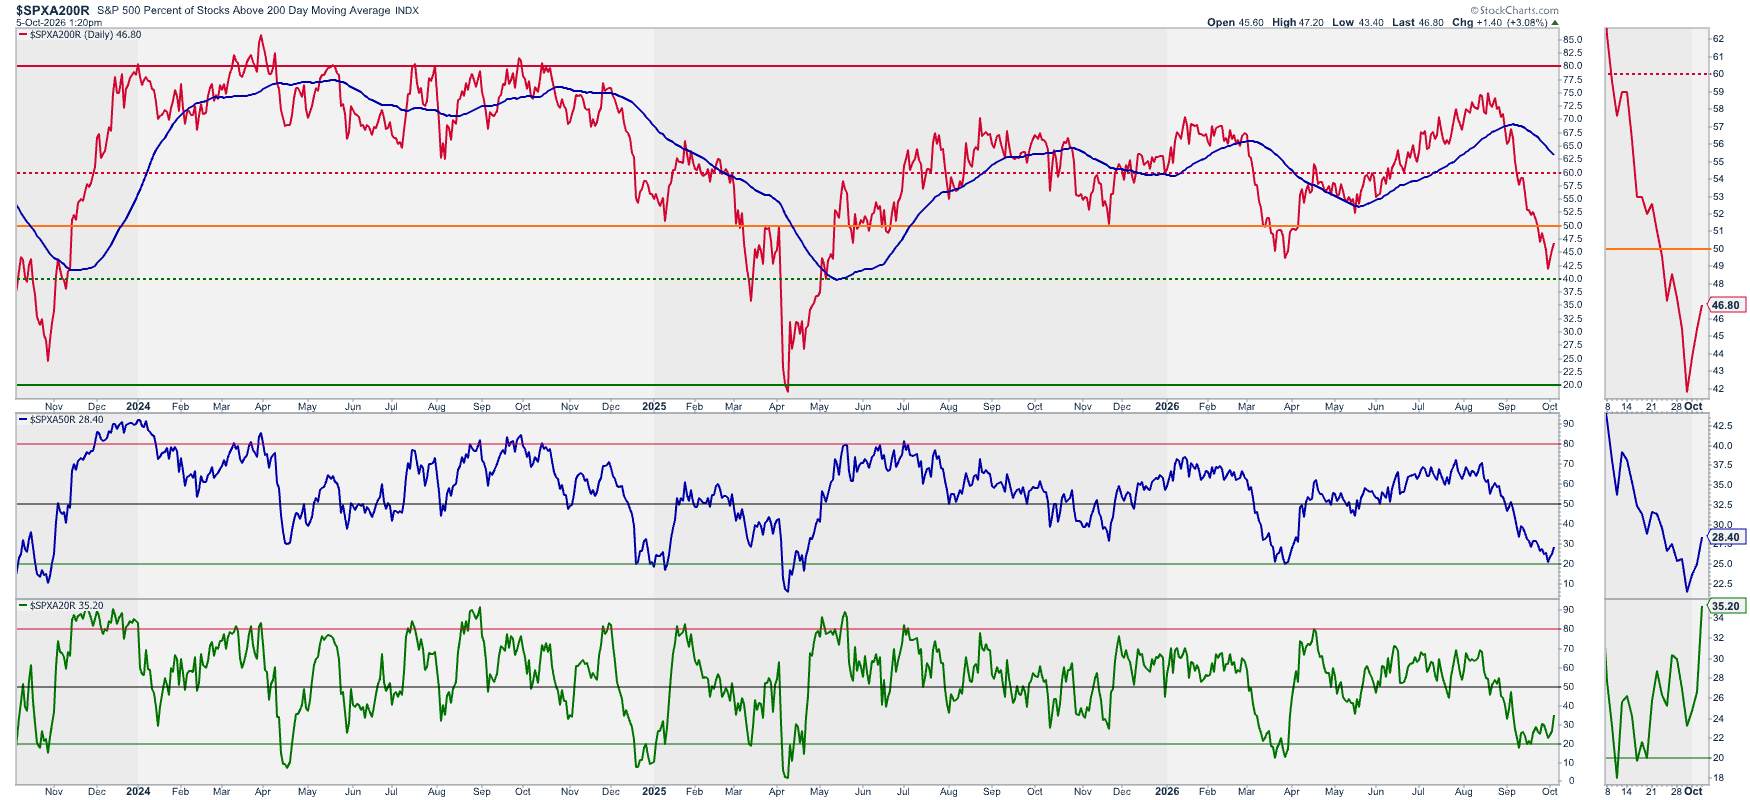
Above 200 Daily SMA
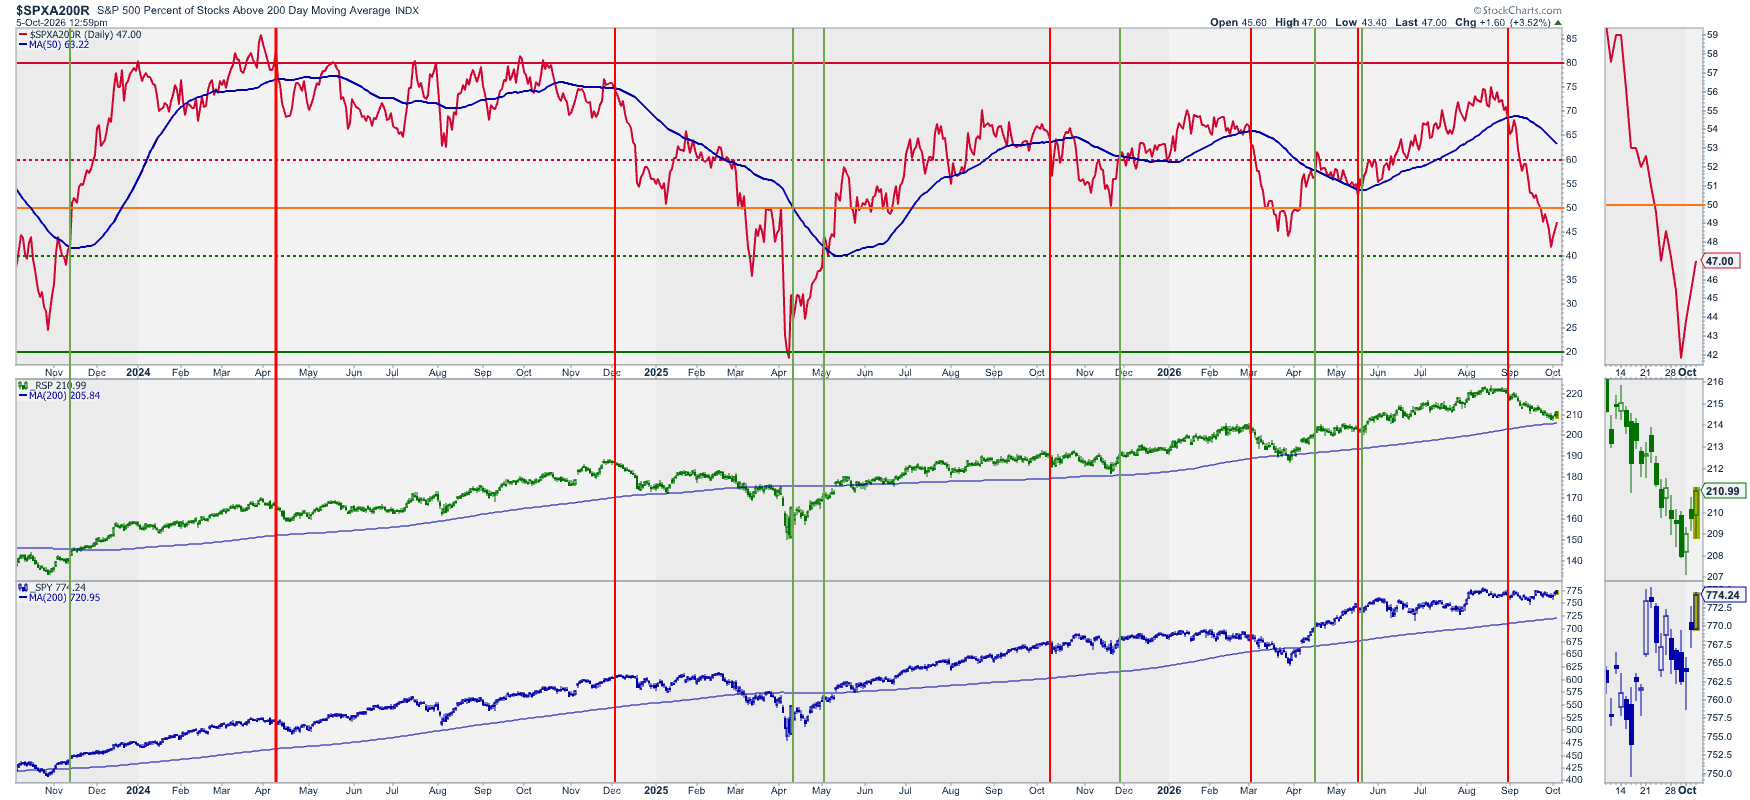
Above 20, 50, and 200 Daily SMAs vs. RSP
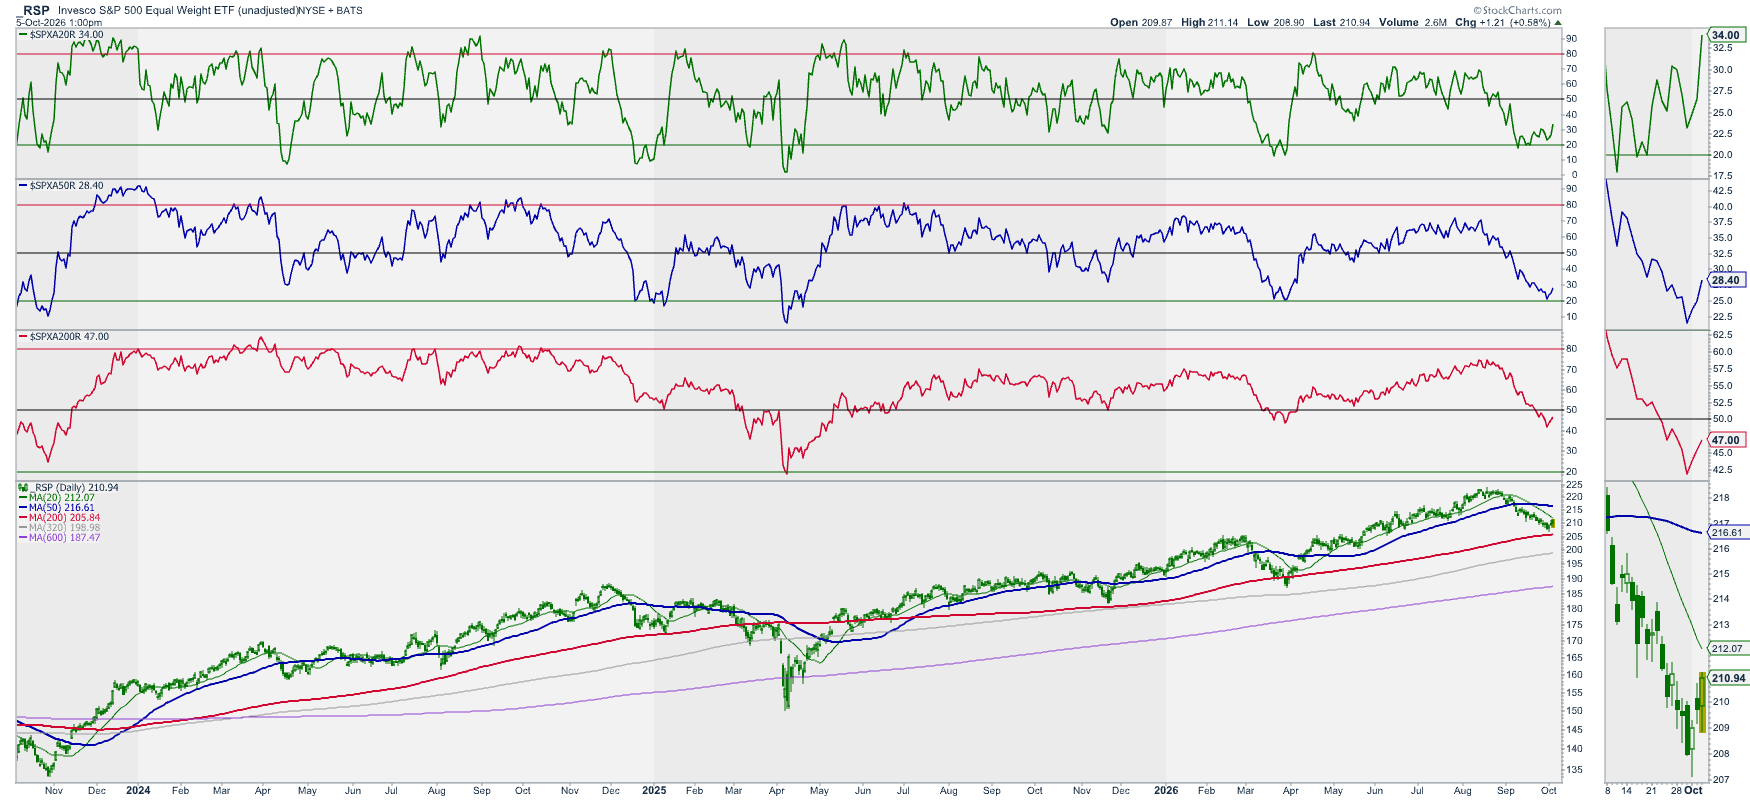
Analysis: % of stocks above their 200D SM reversed from a sub-50 level. % of stocks above their 20D and 50D signals both bounced off their 20s level. At the same time the RSP index (equal weight S&P500) found support on the daily 200D SMA. All these signals mark the beginning of a bullish move.
ACH: 7
Volatility: Ratio Low Vol. Stocks / SPY vs. RSP & SPY
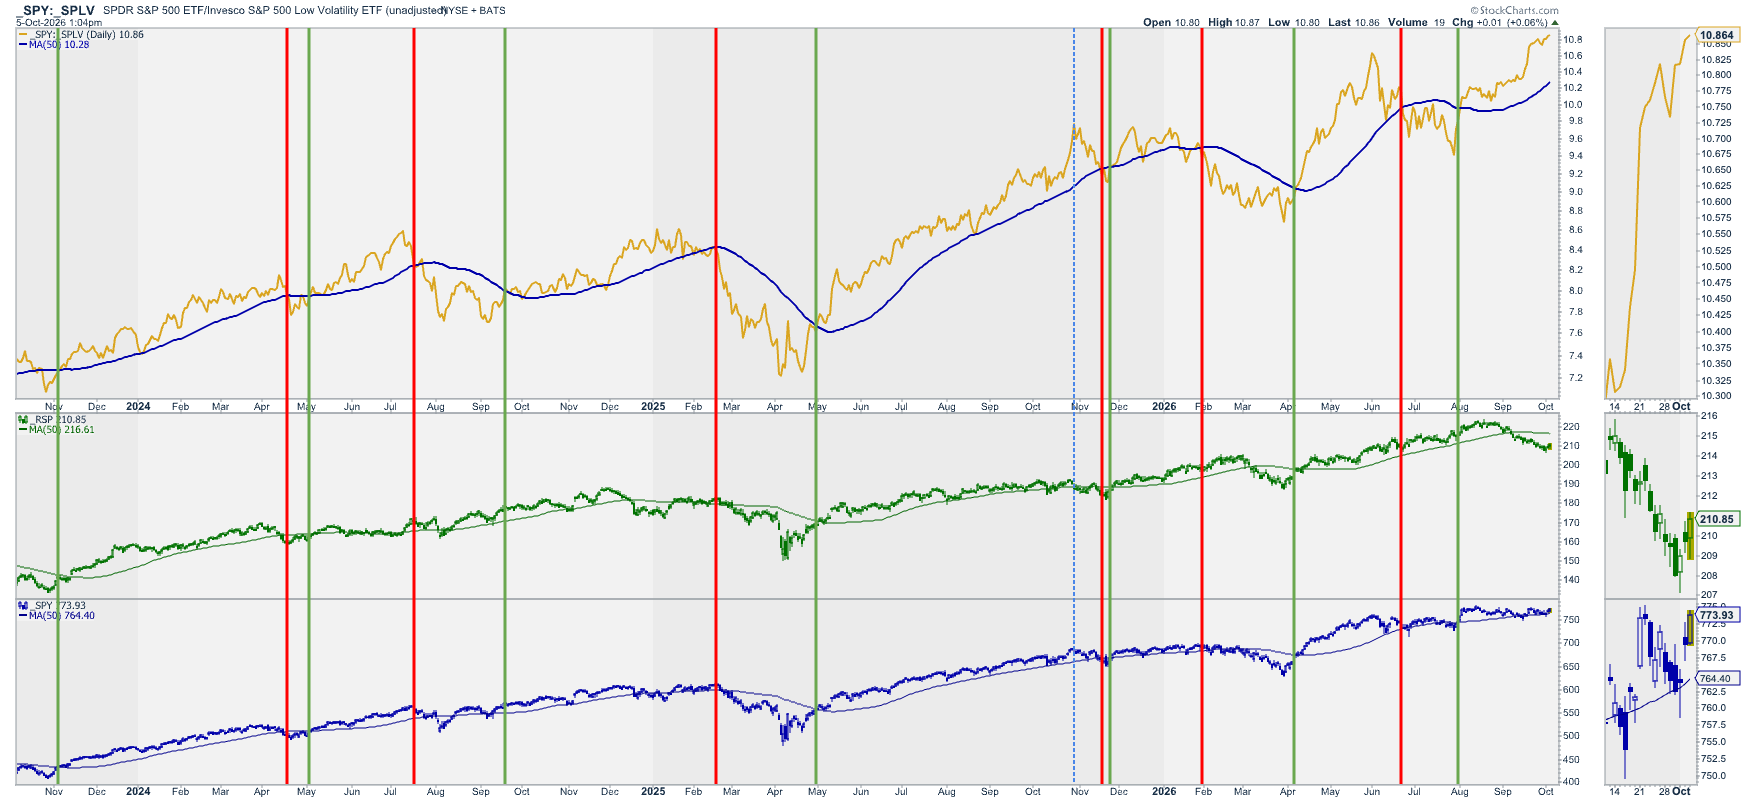
Analysis: Ratio remains above the signal line (50D SMA) and this past week has even increased its upper trend.
ACH: 10
Volatility: (Inverted) VIX vs. SPY
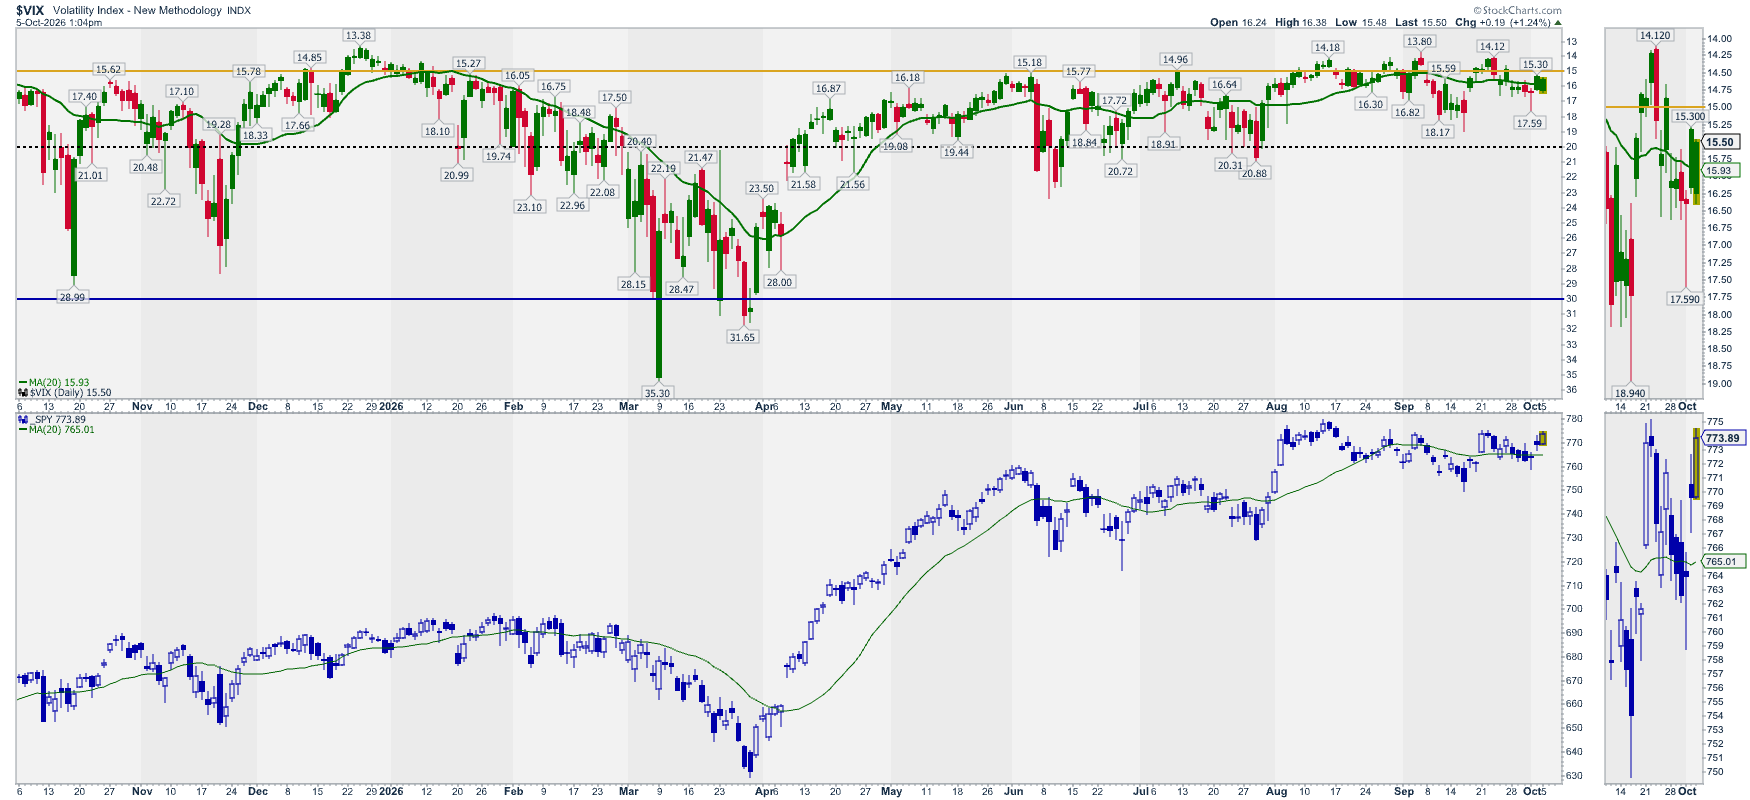
Note: This chart is mainly to detect extreme volatility situations that, once they reverse, offer great long opportunities in the market.
Analysis: Inverted VIX crossed back above the SMA signal line. Low volatility is expected.
ACH: 12
Options: (Inverted) Put/Call Ratio vs. SPY
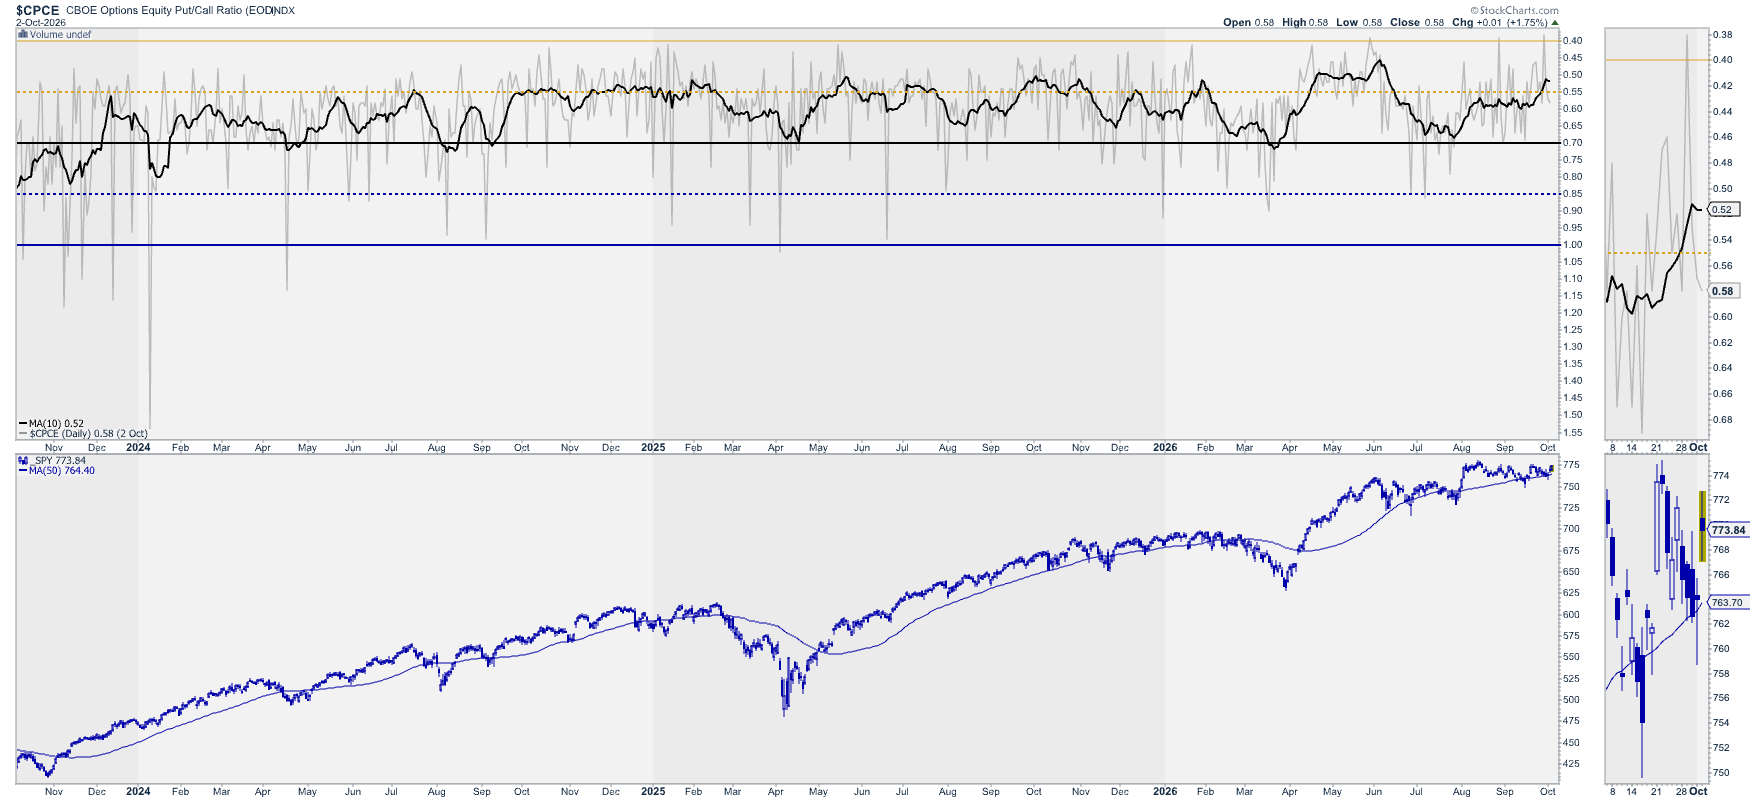
Analysis: The uptrend continues.
ACH: 10
Options: Gamma Exposure – SPY
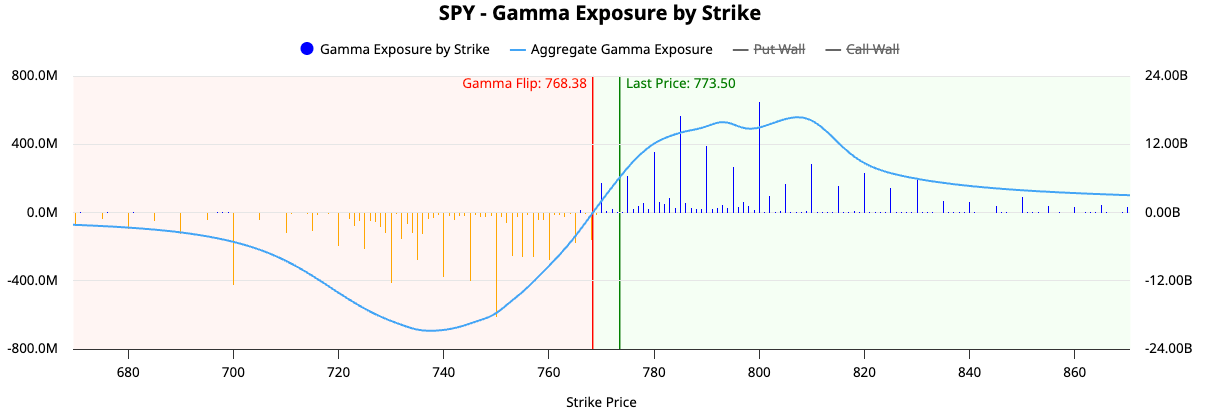
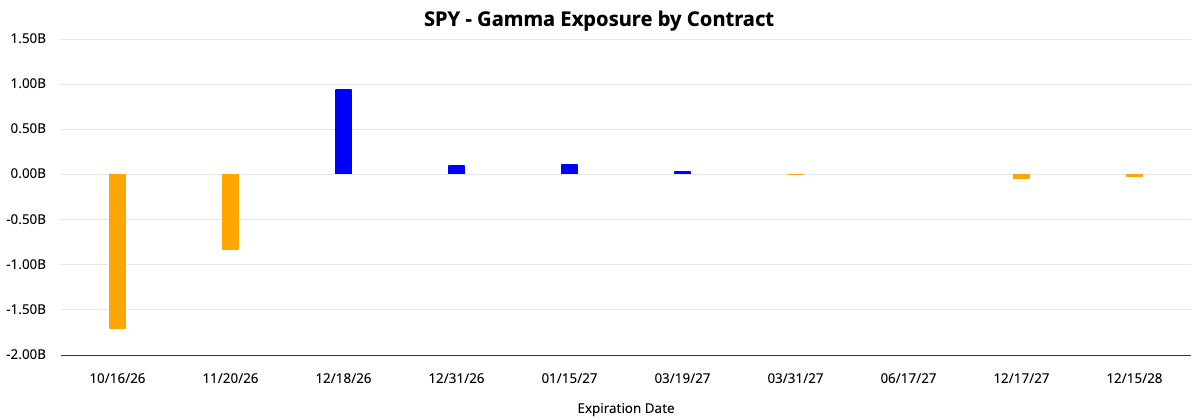
Analysis: Back to positive GEX territory. We start seeing movement even above 800 level while the lower wall has moved up to 760.
Upper wall(s): 800
Lower wall(s): 760
Sectors: Where is it happening?
Sectors Rotation
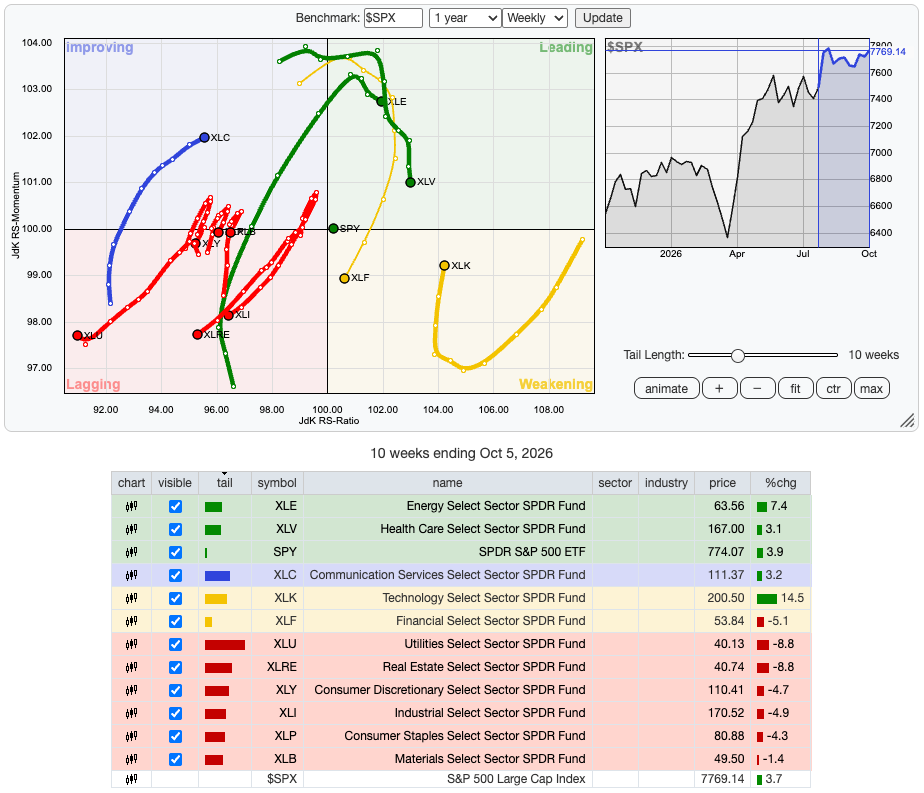
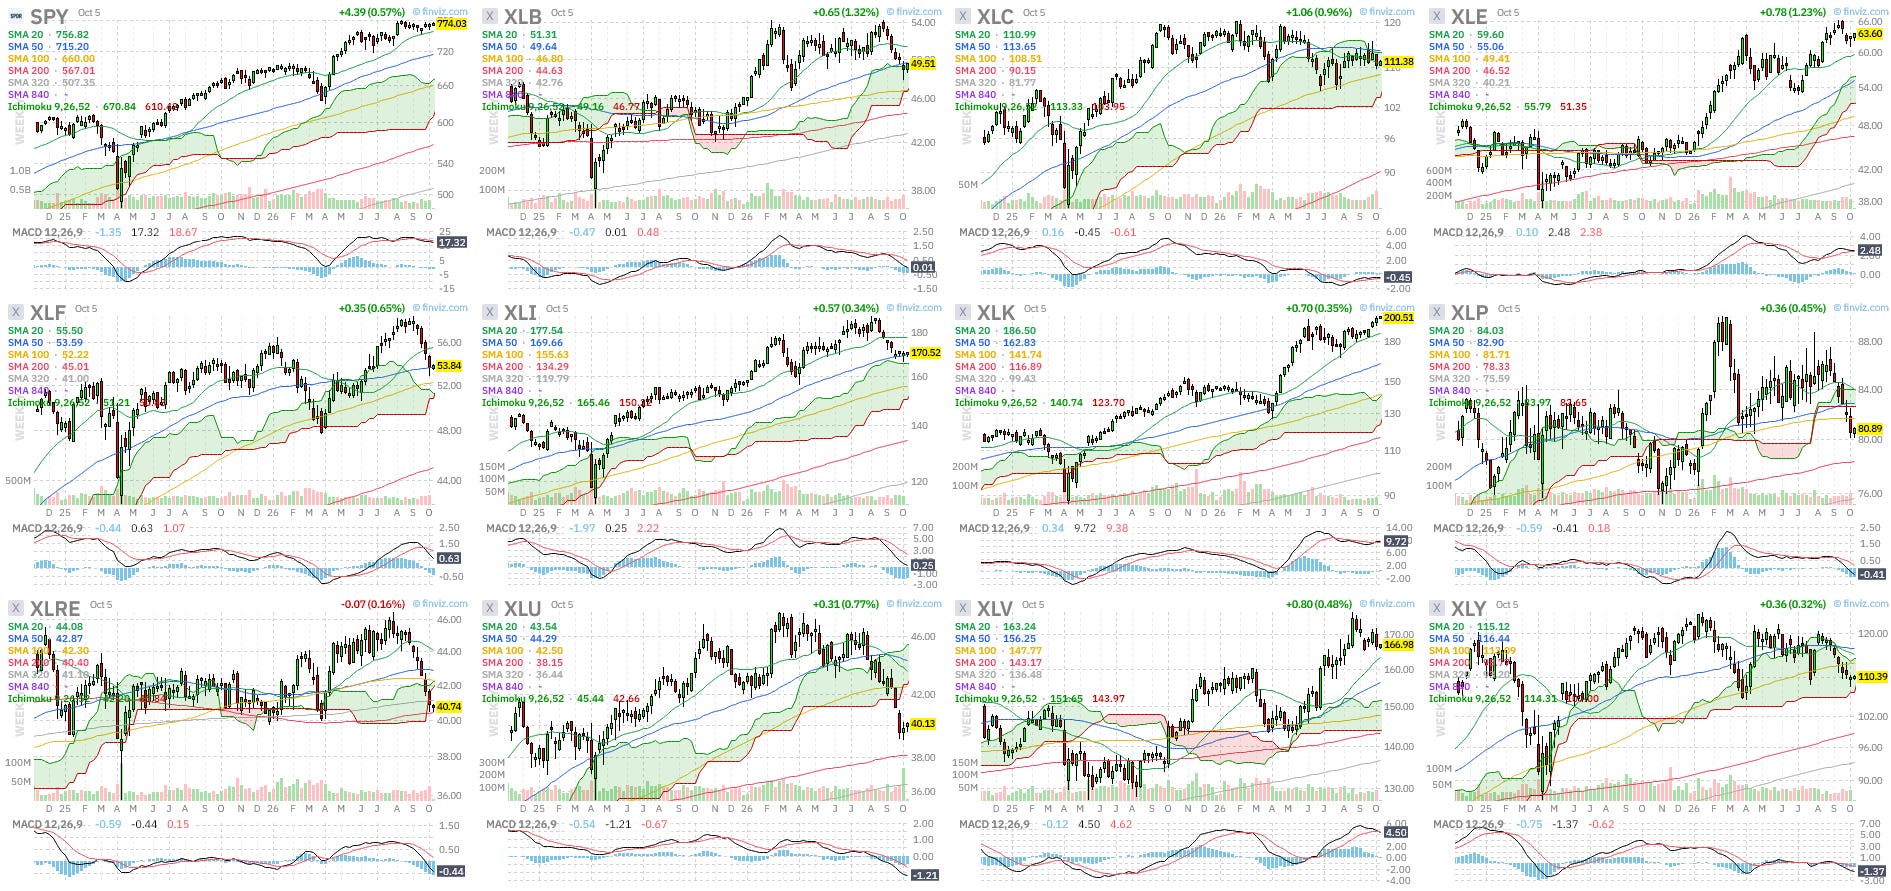
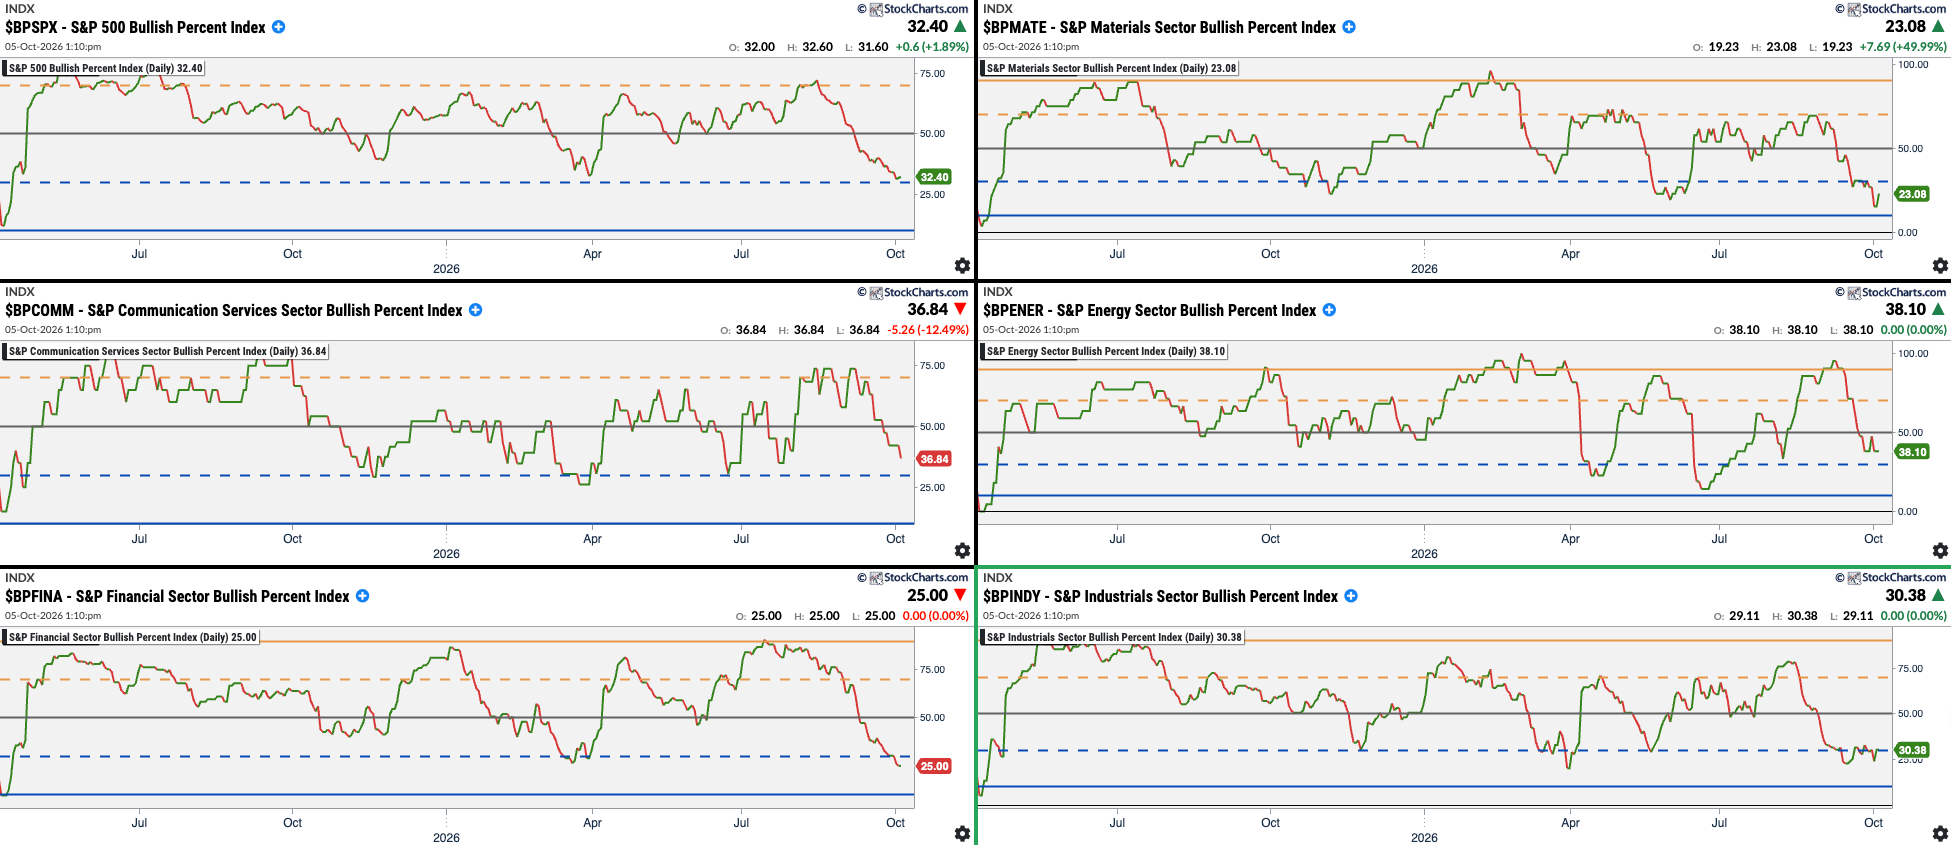
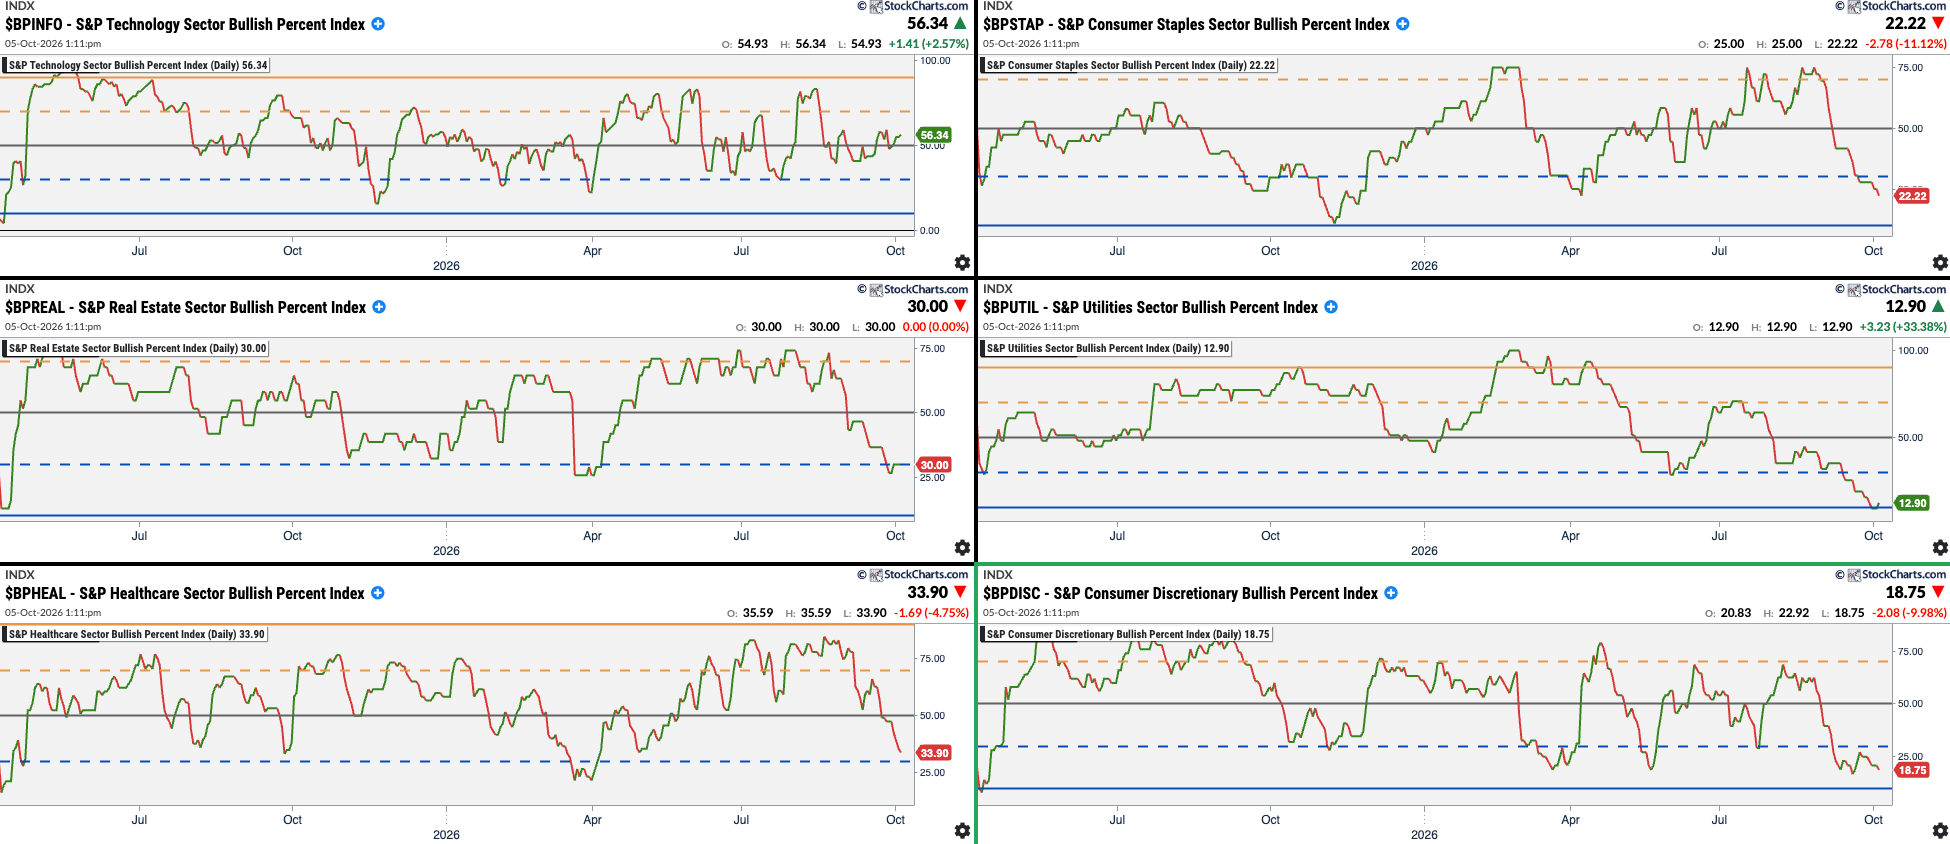
Summary:


AMAT Portfolios
Forever Portfolio

The World of Tomorrow

Summary:

Last Word
Posting late this week as I was stranded in Barcelona due to severe rain storms. One the positive side, the indicators predicted bullish markets and we got them. Nice to see that breadth is bouncing from low readings, which brings plenty of room to the upside, setting the stage for sharp rallies after the elections.
Also, have a look at the sector rotations, the leaders are positioned to lead, and once we have more confirmation that rate hikes are out of the table, financials will join the party.
So, don’t be like me this week and don’t be late… late to the bulls’ party!
Disclaimer: The content on AMAT Investing is strictly for educational and learning purposes. The author is not a licensed financial advisor and holds no formal financial education. This post does not constitute professional financial advice. All investing involves risk of loss. Always conduct your own research and consult a licensed professional before making any investment decisions.