Context: Why is it happening?
Economic Production: ISM PMI vs. SPX
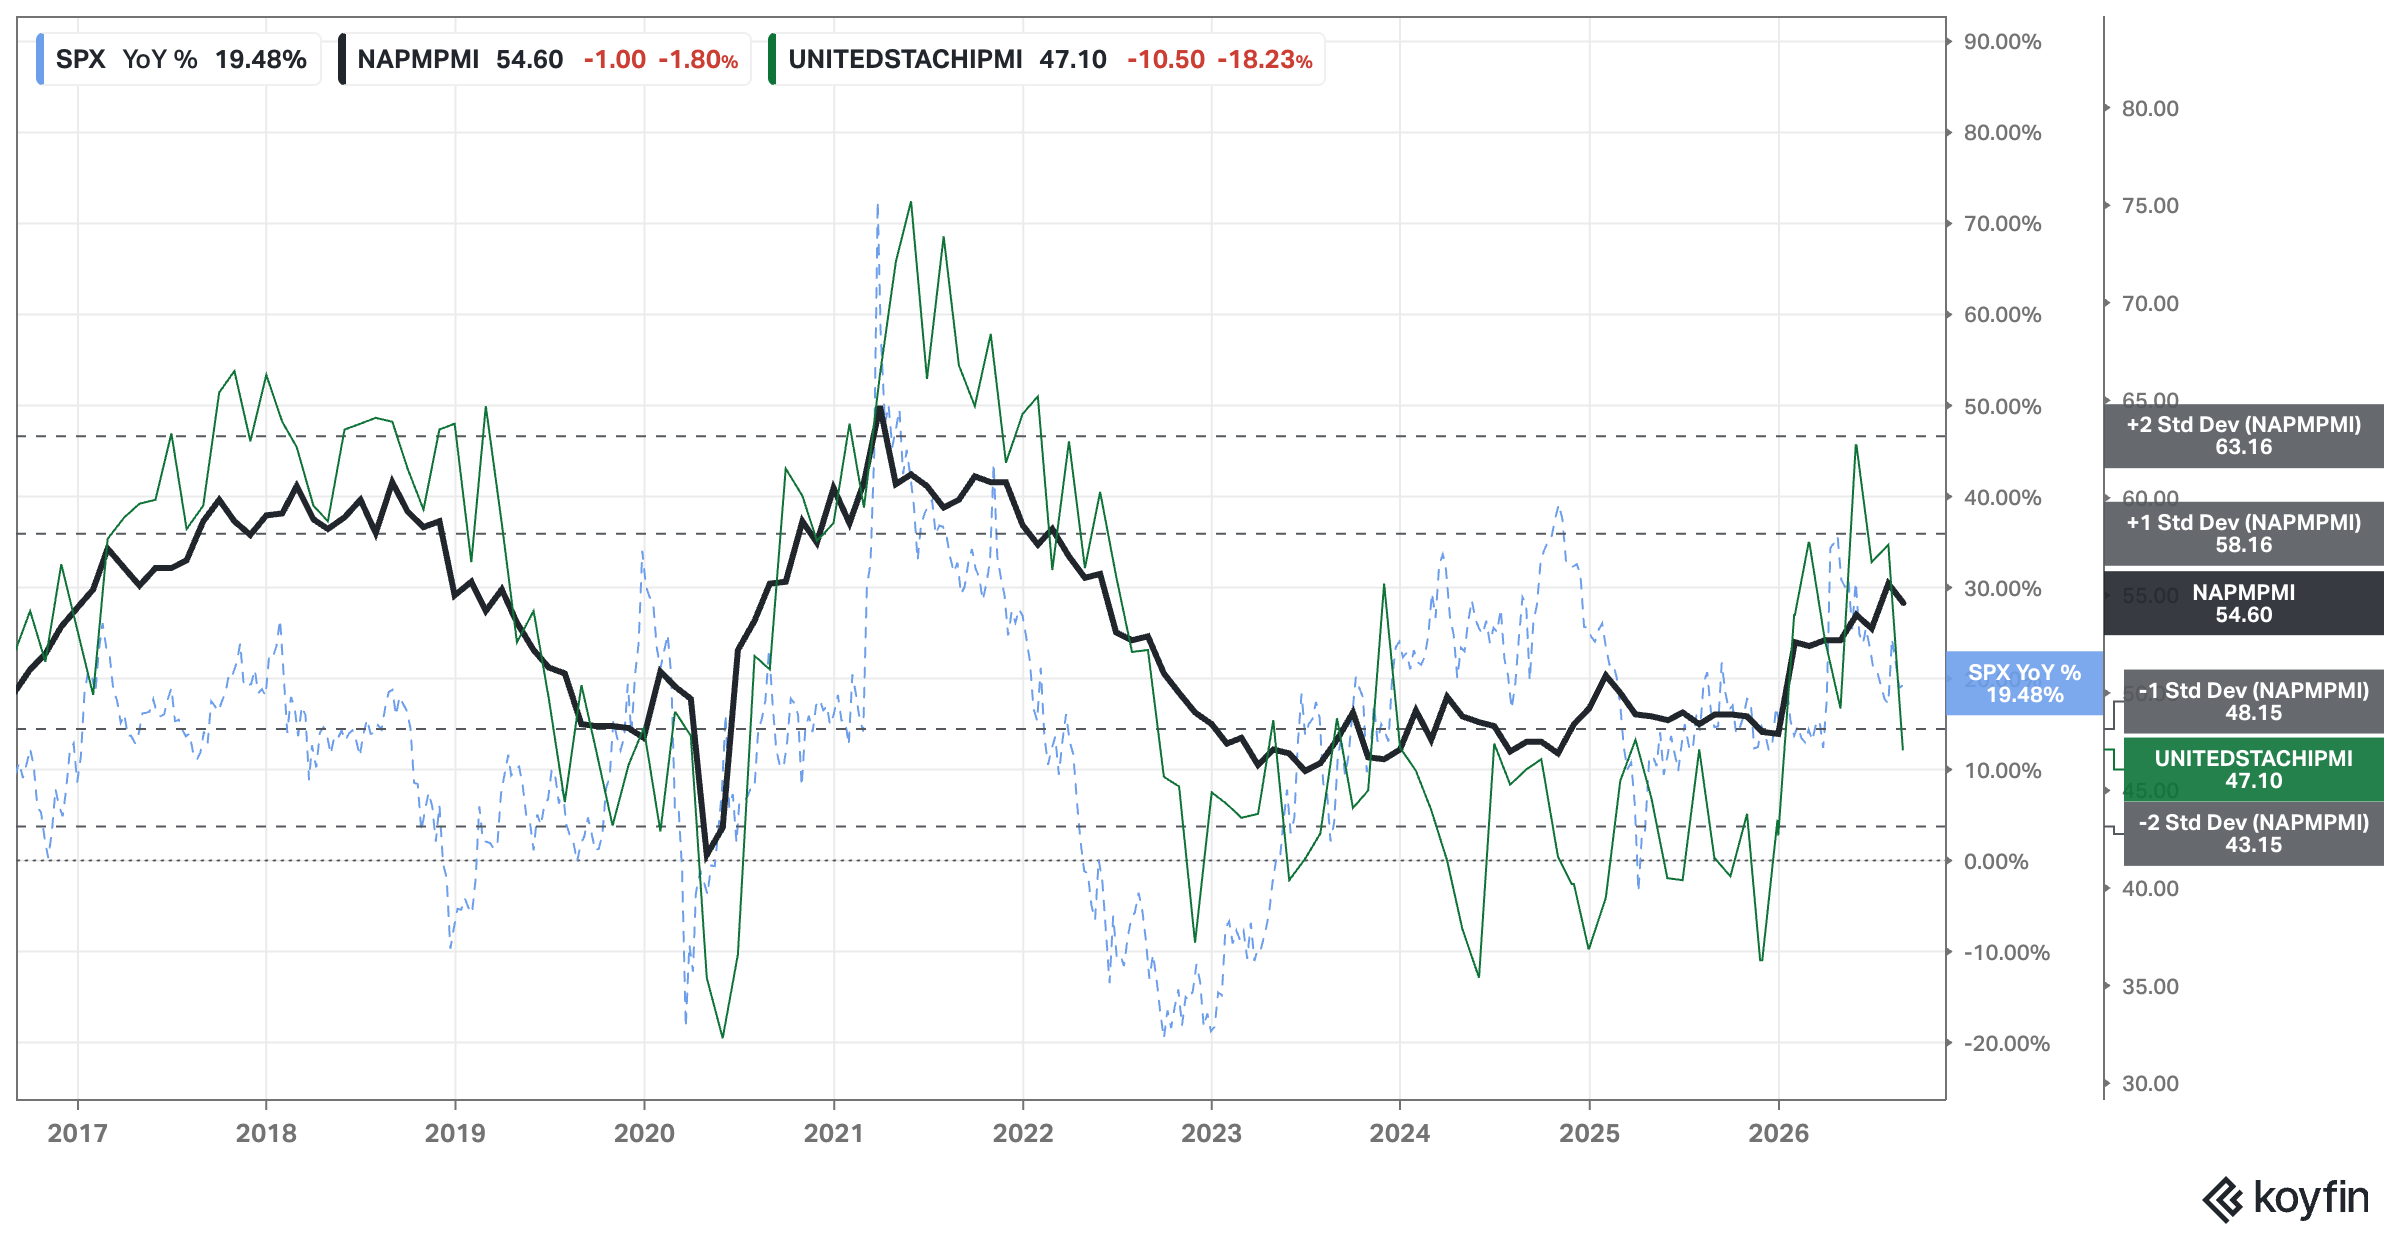
Analysis: No changes since last week.
ACH: 8
Economic Activity: Regional Banks Performance
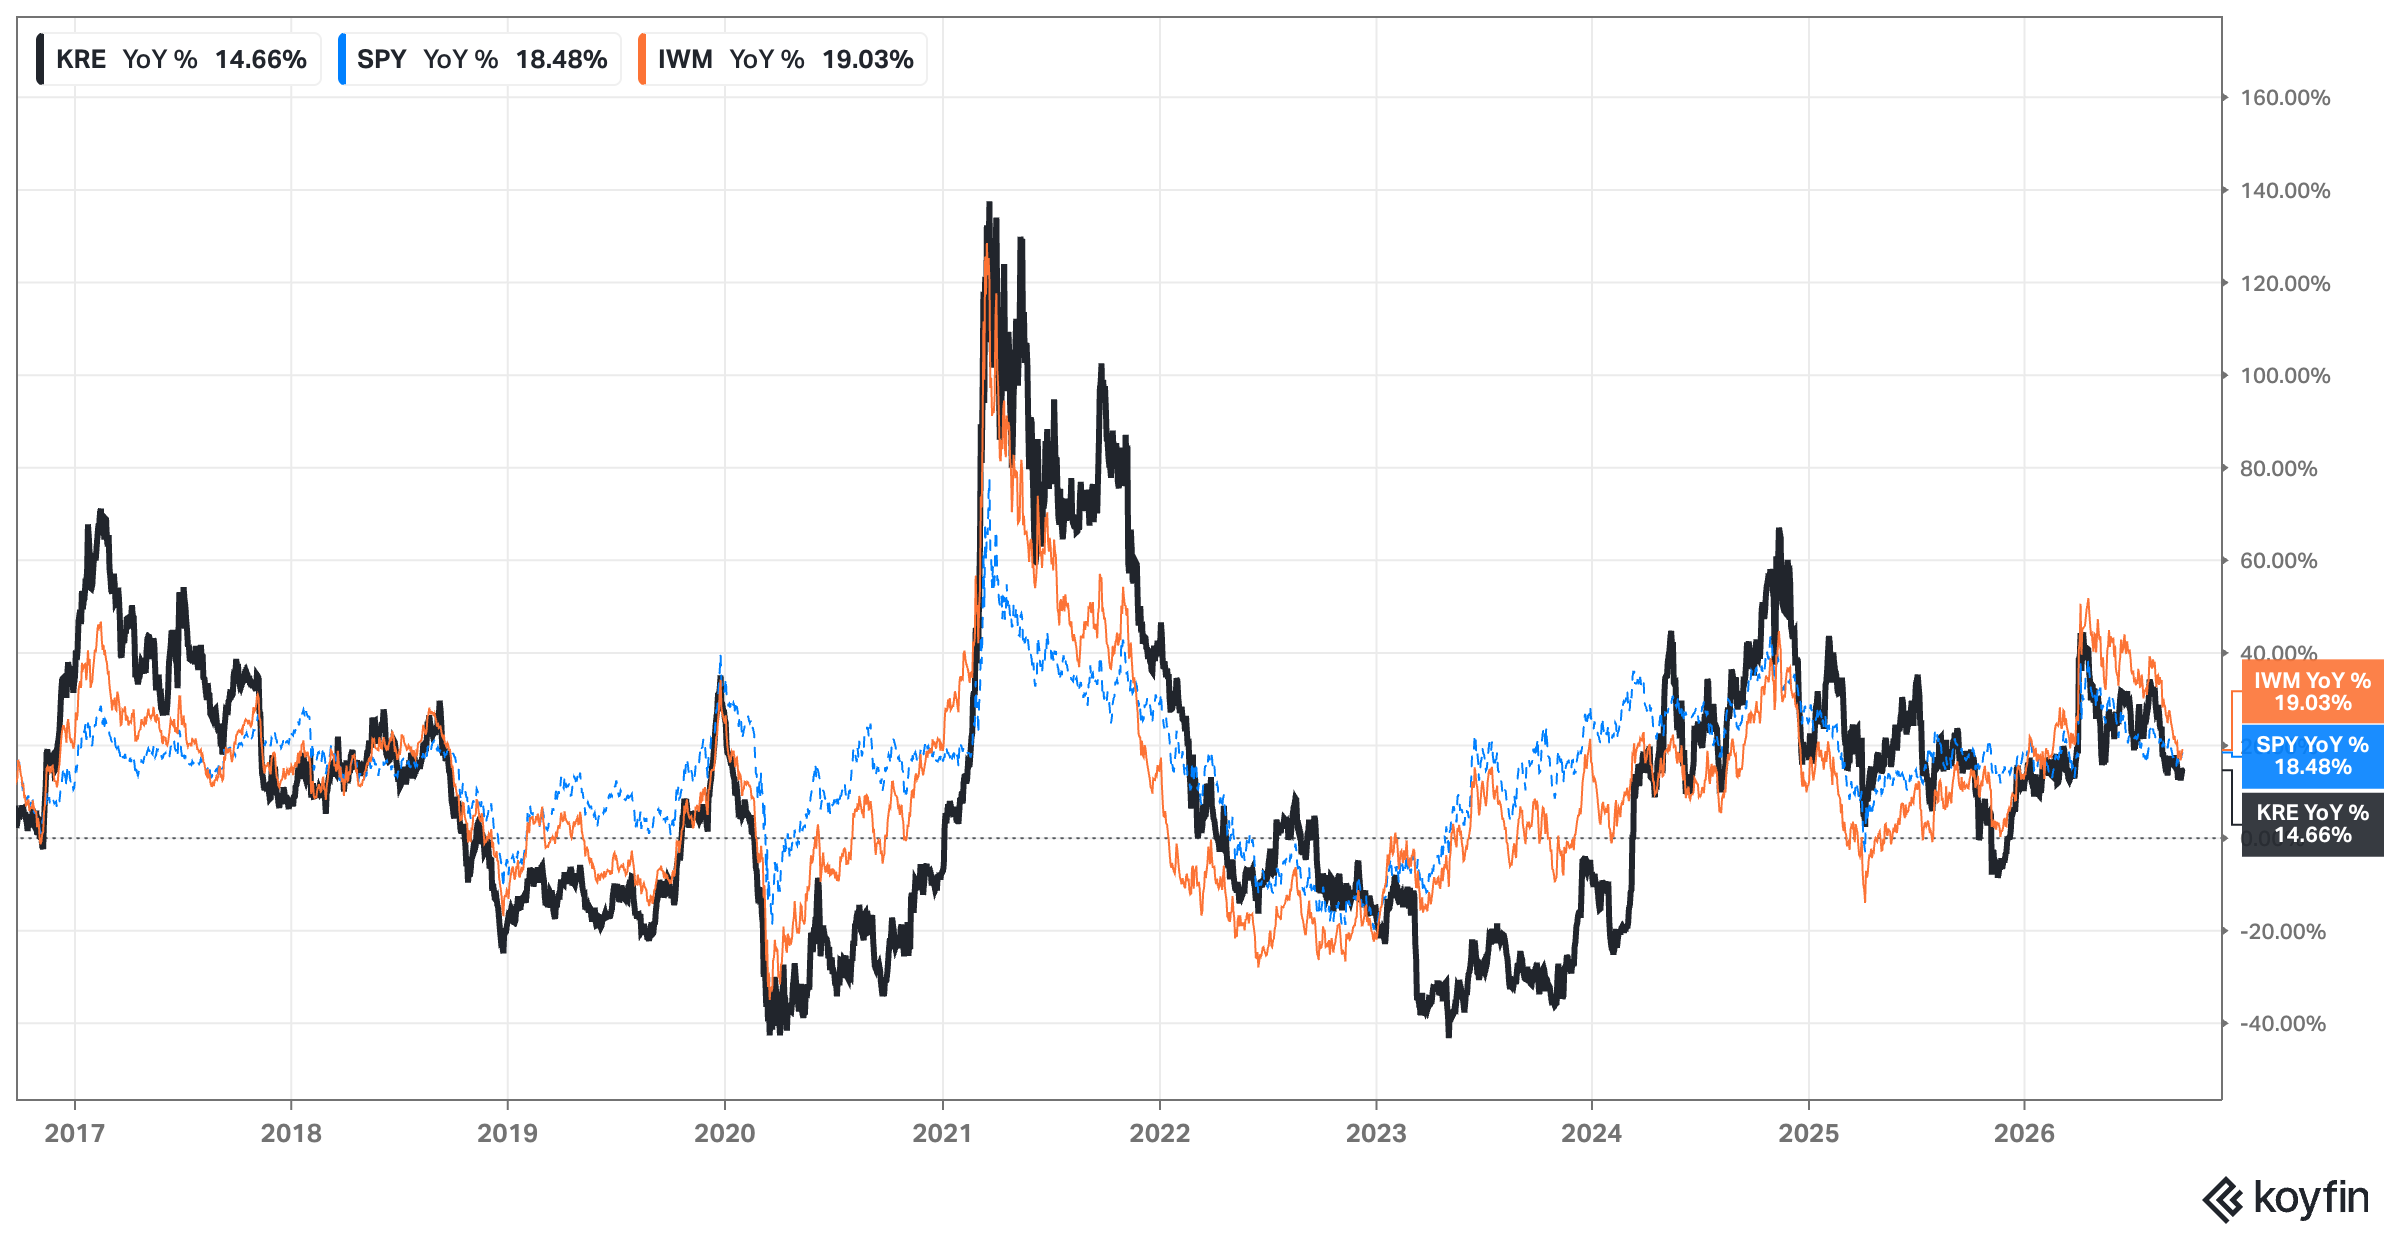
Analysis: No significant change since last week.
ACH: 3
Interest Rates: FED, 2yr, 10yr, and 30yr Rates
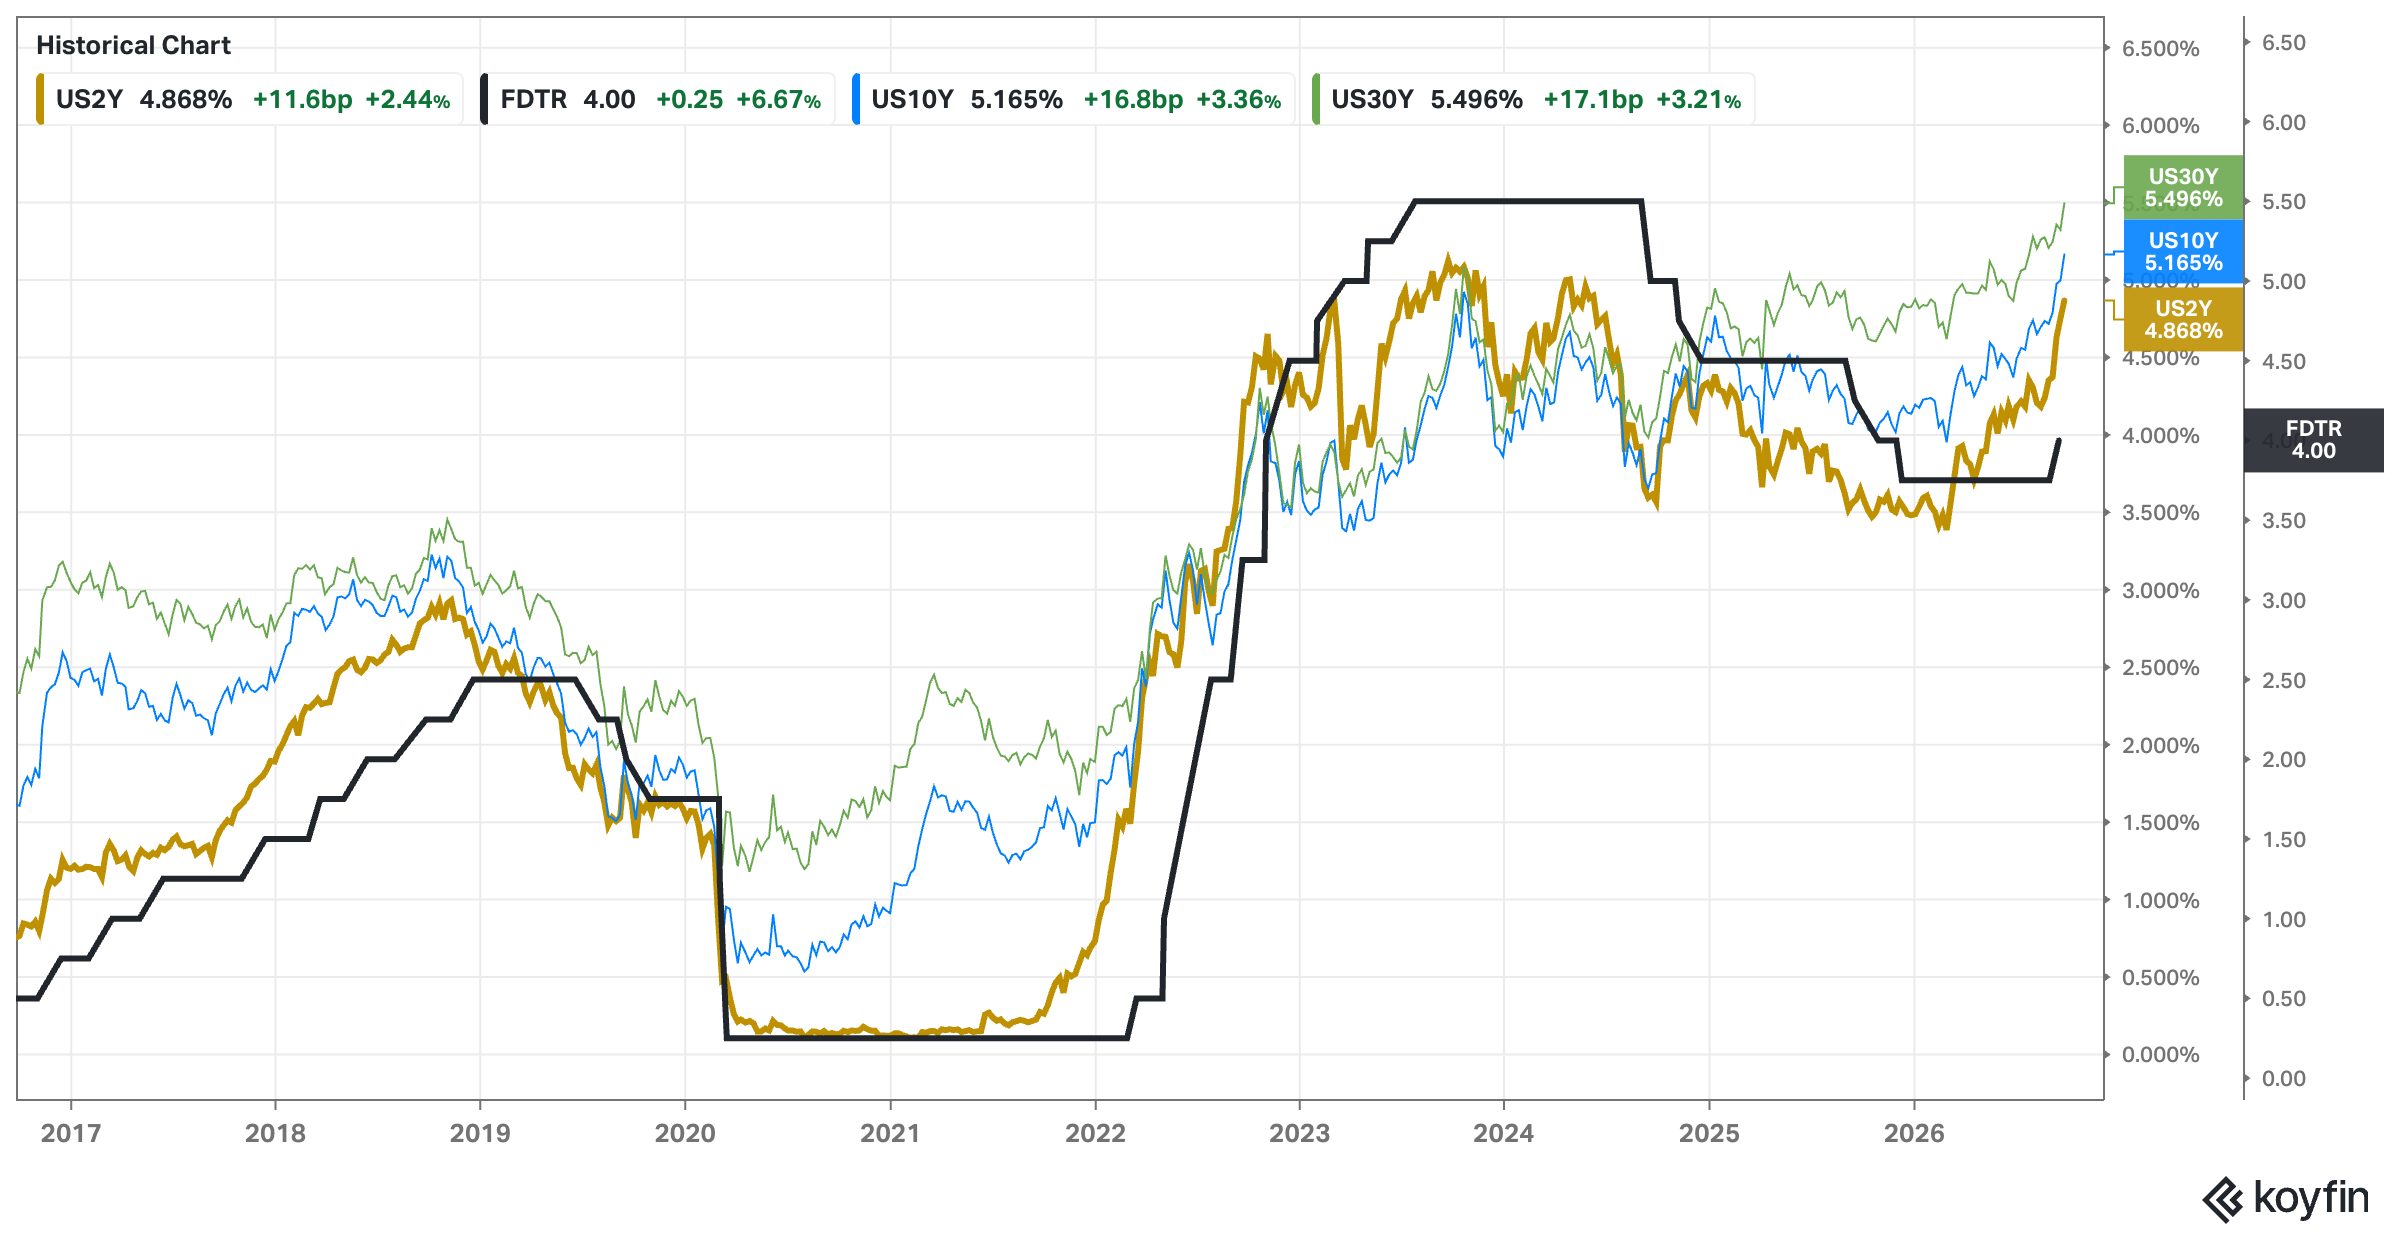
Analysis: Rates continue to increase and the market continues to ignore them. How long this will last is anyone’s guest.
ACH (inverted color): 11
Indexes: What is happening?
TA: Price Action, Trend, Momentum & Volume:
Weekly & Daily SPY, QQQ, and IWM
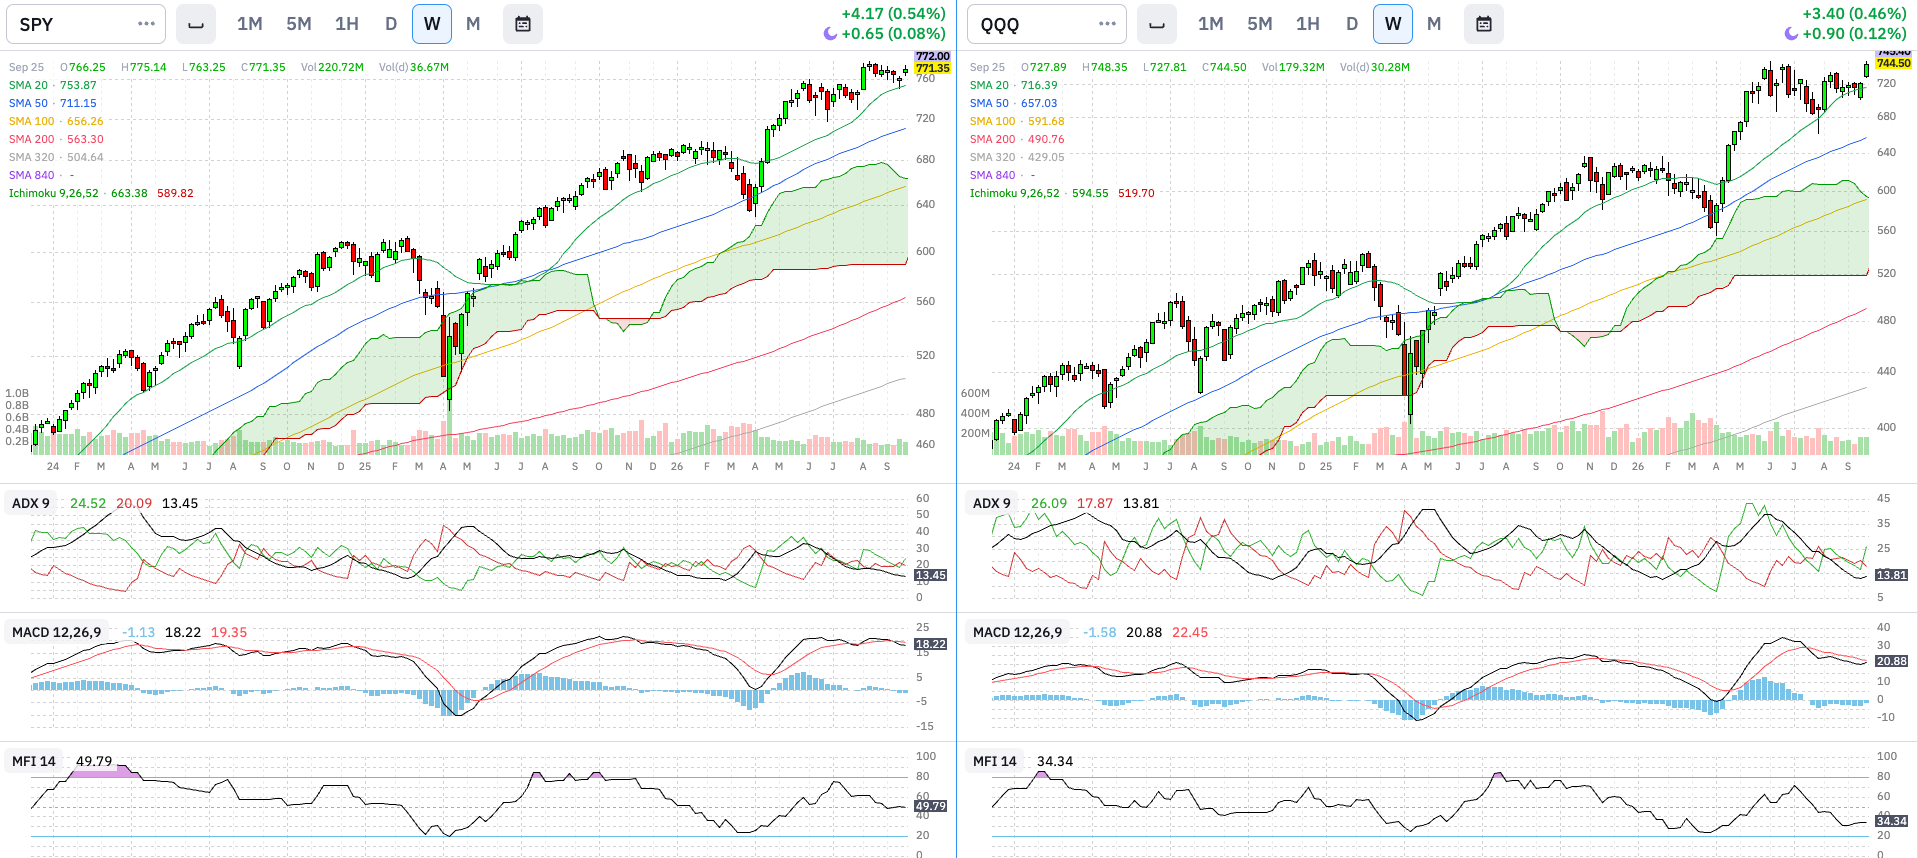
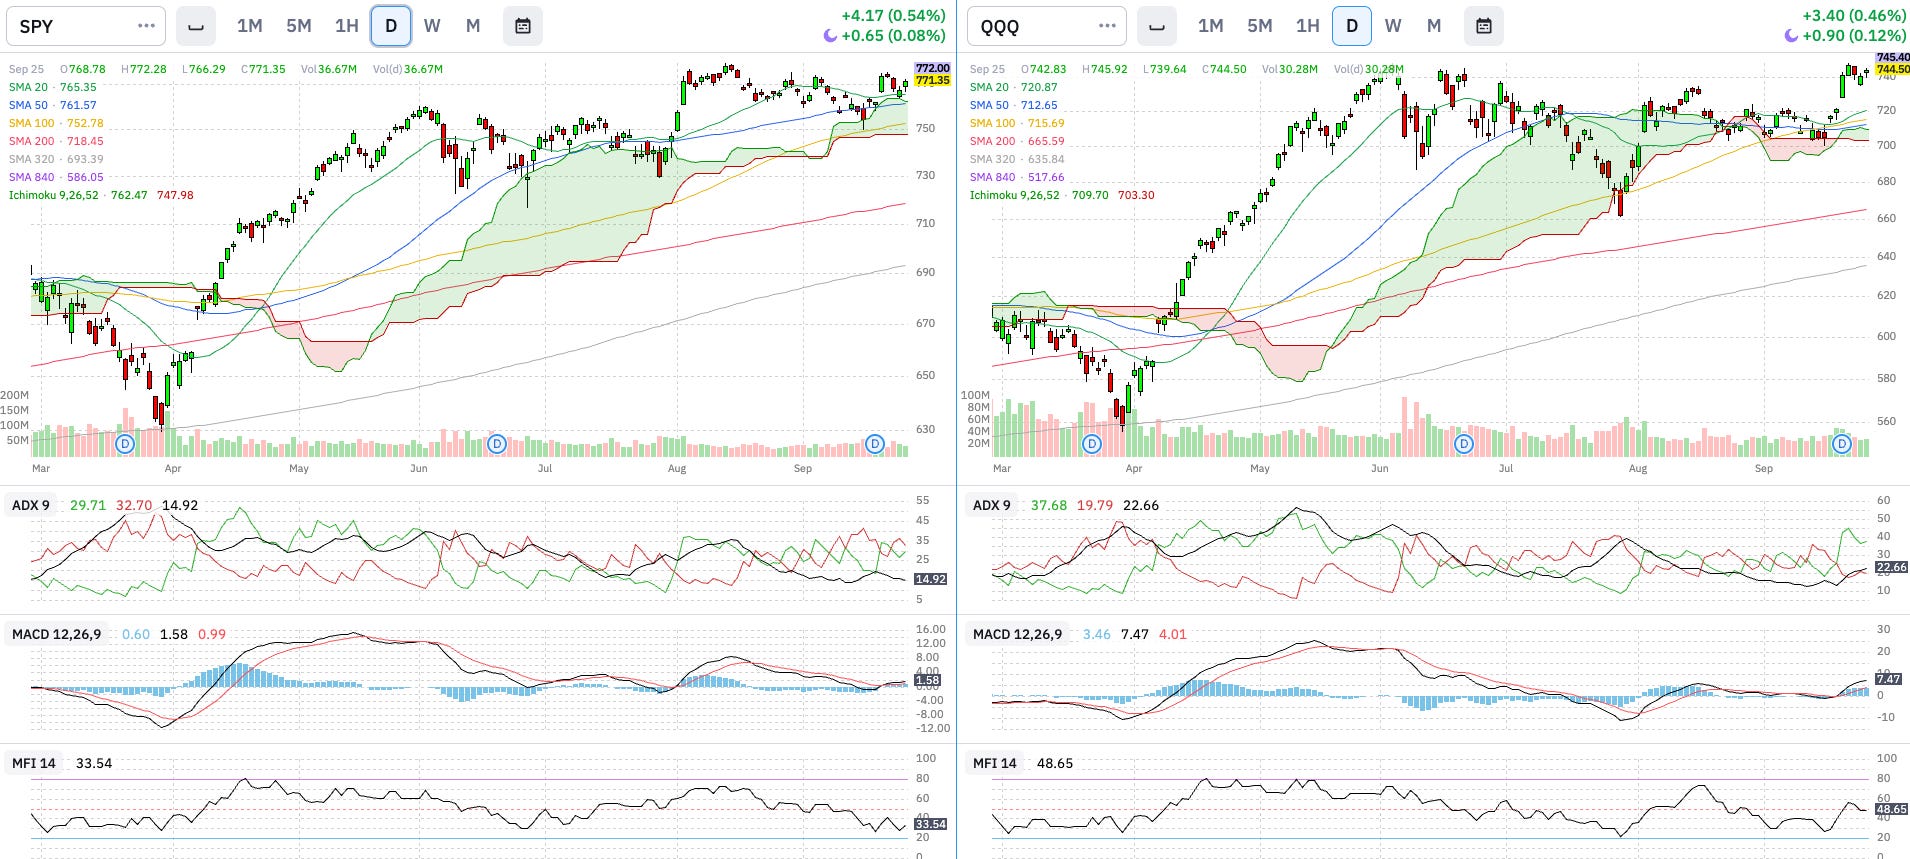
Update: I’m removing IWM. Honestly, I do not trade anything in IWM and what we call “the market” is not that influenced by small and medium companies. There are too many big fish in the pond to bother with the smaller ones. I want to keep myself focus on what matters, and IWM, for my method, does not matter. I’m updating the ACH significantly in all analysis due to the removal of IWM.
Technical Analysis:
Price (SMAs & Cloud): Weekly: SPY and QQQ bounced and stayed above their 20D SMA. QQQ is about to reach ATH. Daily: SPY keeps bouncing between the 20D SMA and ATH levels. QQQ is attempting to break above ATHs. ACH: 9
Trend (ADX): Weekly: ADX seem to start an uptrend signal in both indexes. The trend is still weak yet this may signal the beginning of a new one. Daily: SPY is trendless. QQQ has sharply reversed from a bearish to a bullish trend that is starting to get stronger. ACH: 8
Momentum (MACD): Weekly: ‘Toppy’ MACD, specially in SPY, but we know that markets can stay in toppy momentum for quite a while. Daily: SPY hovering at the 0 level. QQQ seems to start taking off. ACH: 8
Volume (MFI): Weekly: Previous weeks bearish divergences have brought MFI to neutral levels. There is room in both directions for the market to follow. Daily: SPY is in a sub 50 level and QQQ almost at 50. Both are signalling upper room to accelerate to a bullish trend. ACH: 7
Breadth: % Stocks above SMAs
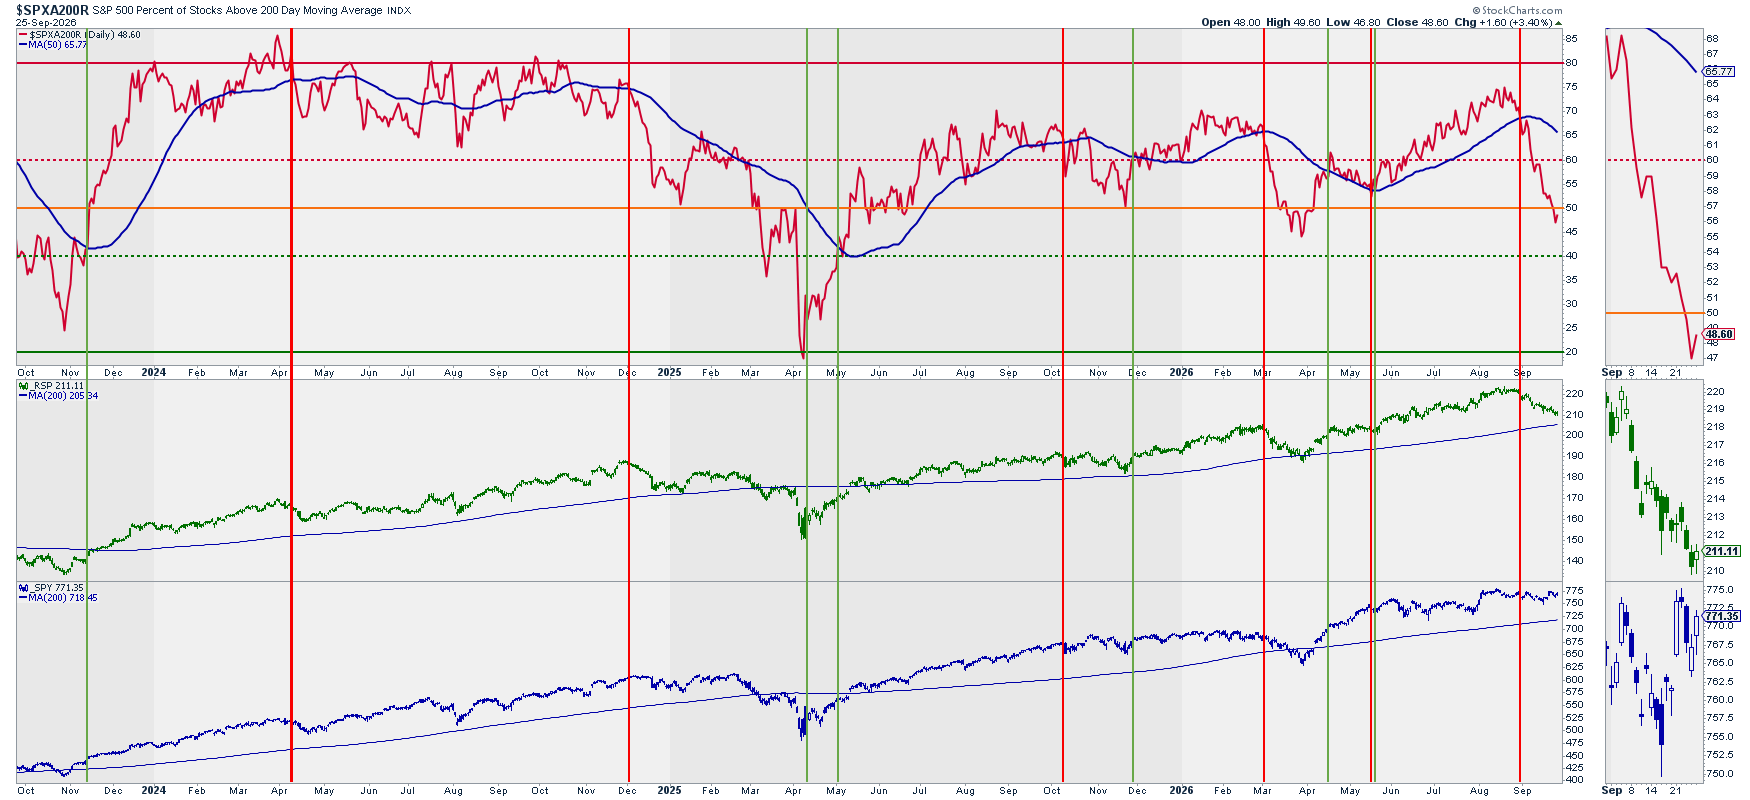
Above 200 Daily SMA
Above 20, 50, and 200 Daily SMAs vs. RSP
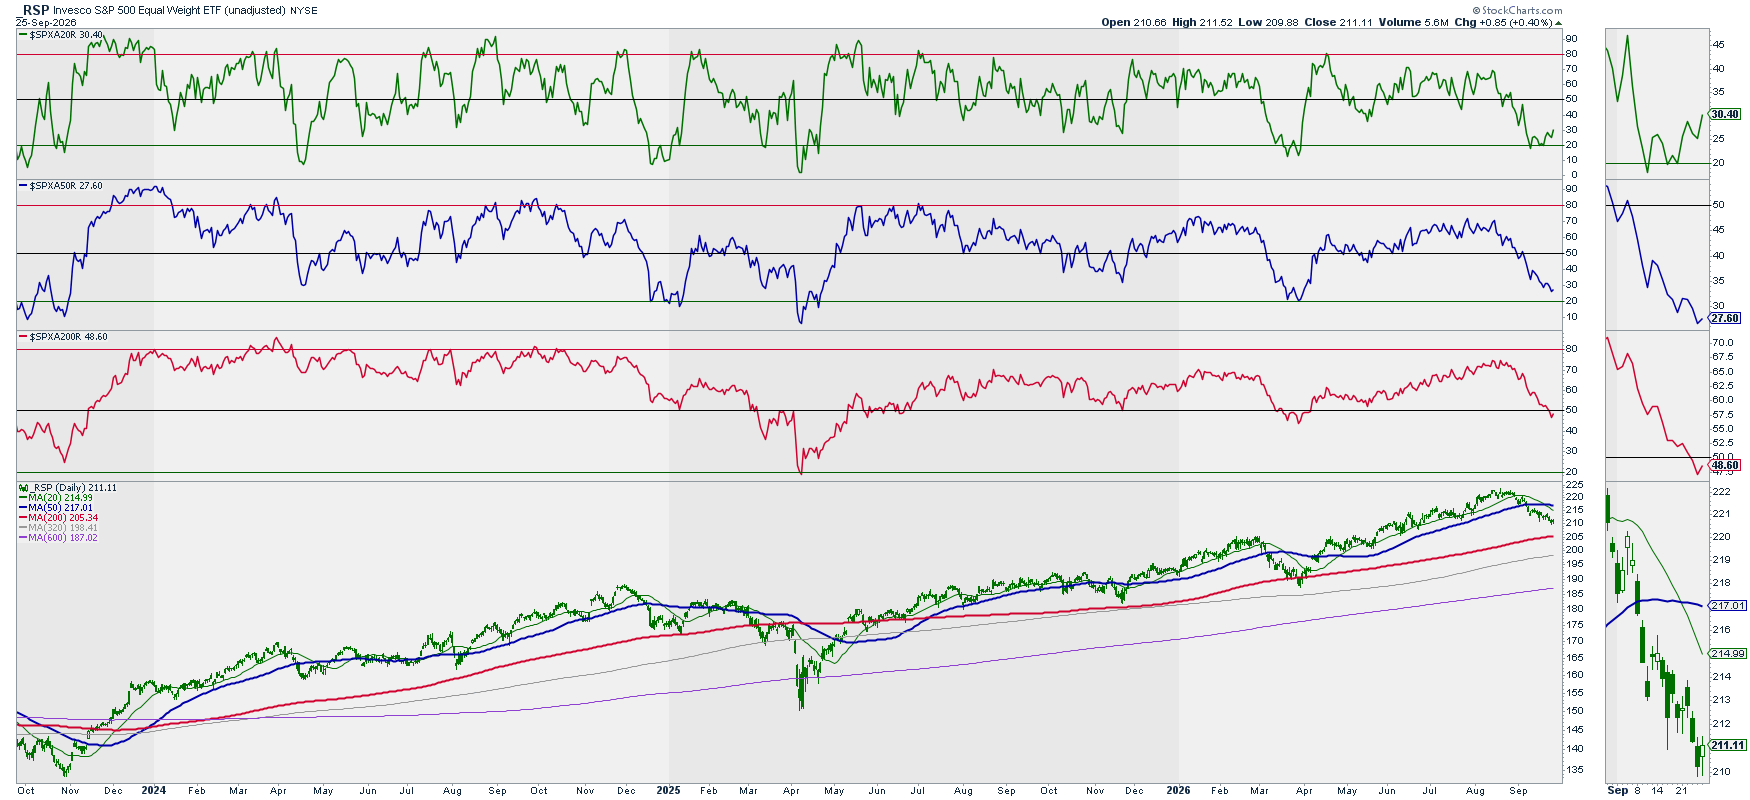
Analysis: % of stocks above their 200D SMAcrossed below the signal line. 50D %s is below the 50% middle line and approaching extreme low levels. 20D is recovering from extreme lows. Seeing also that RSP is approaching its 200D SMA, we may start seeing the end of this correction move.
ACH: 4
Volatility: Ratio Low Vol. Stocks / SPY vs. RSP & SPY
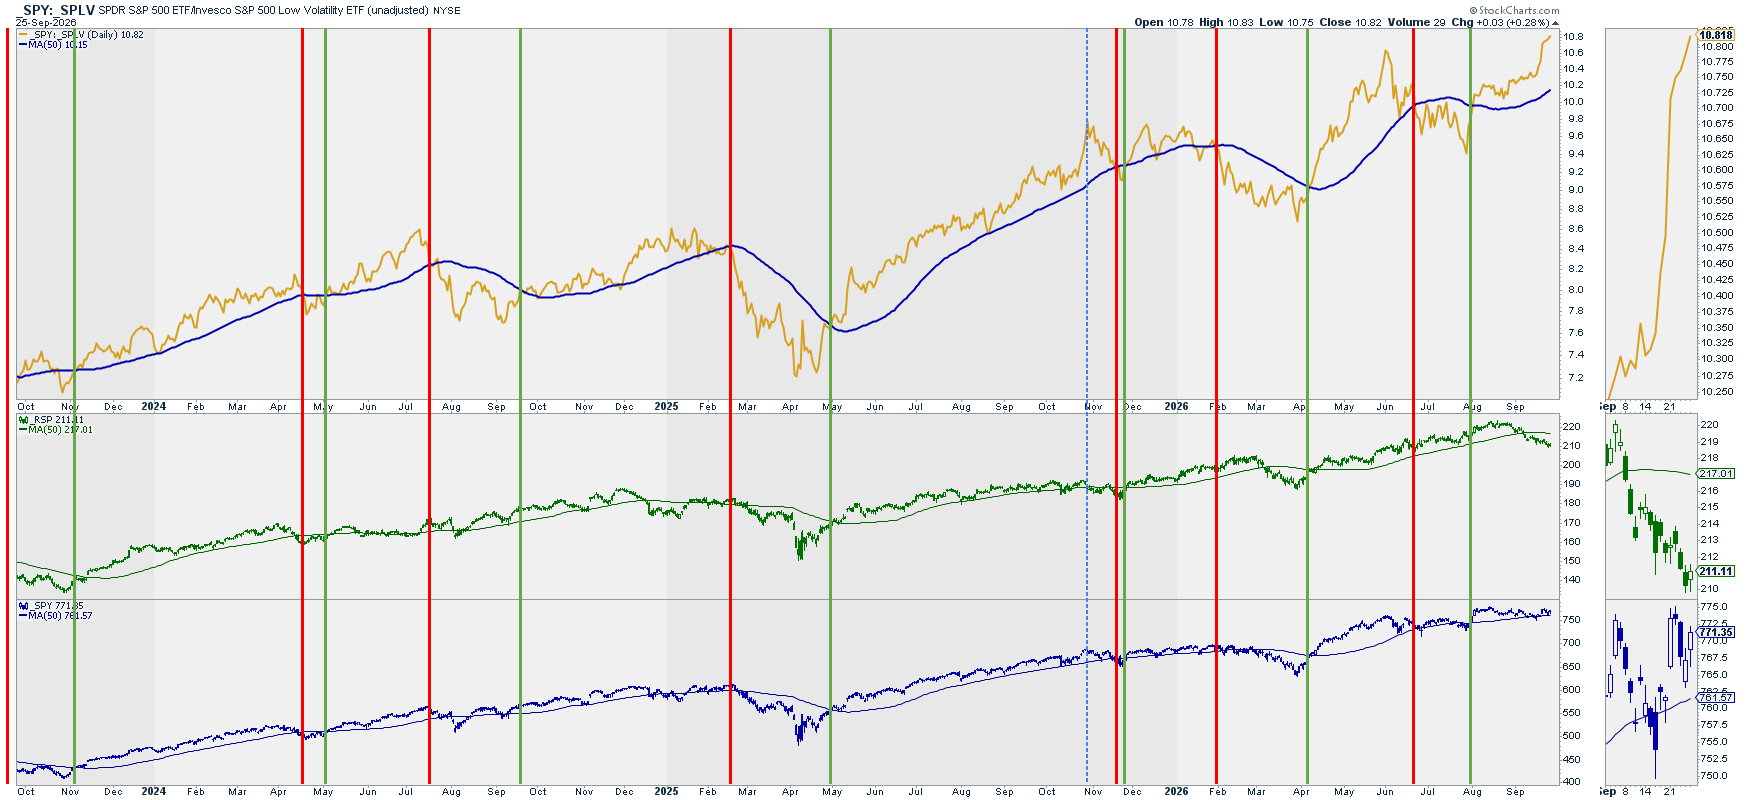
Analysis: Ratio remains above the signal line (50D SMA) and this past week has even increased its upper trend.
ACH: 10
Volatility: (Inverted) VIX vs. SPY
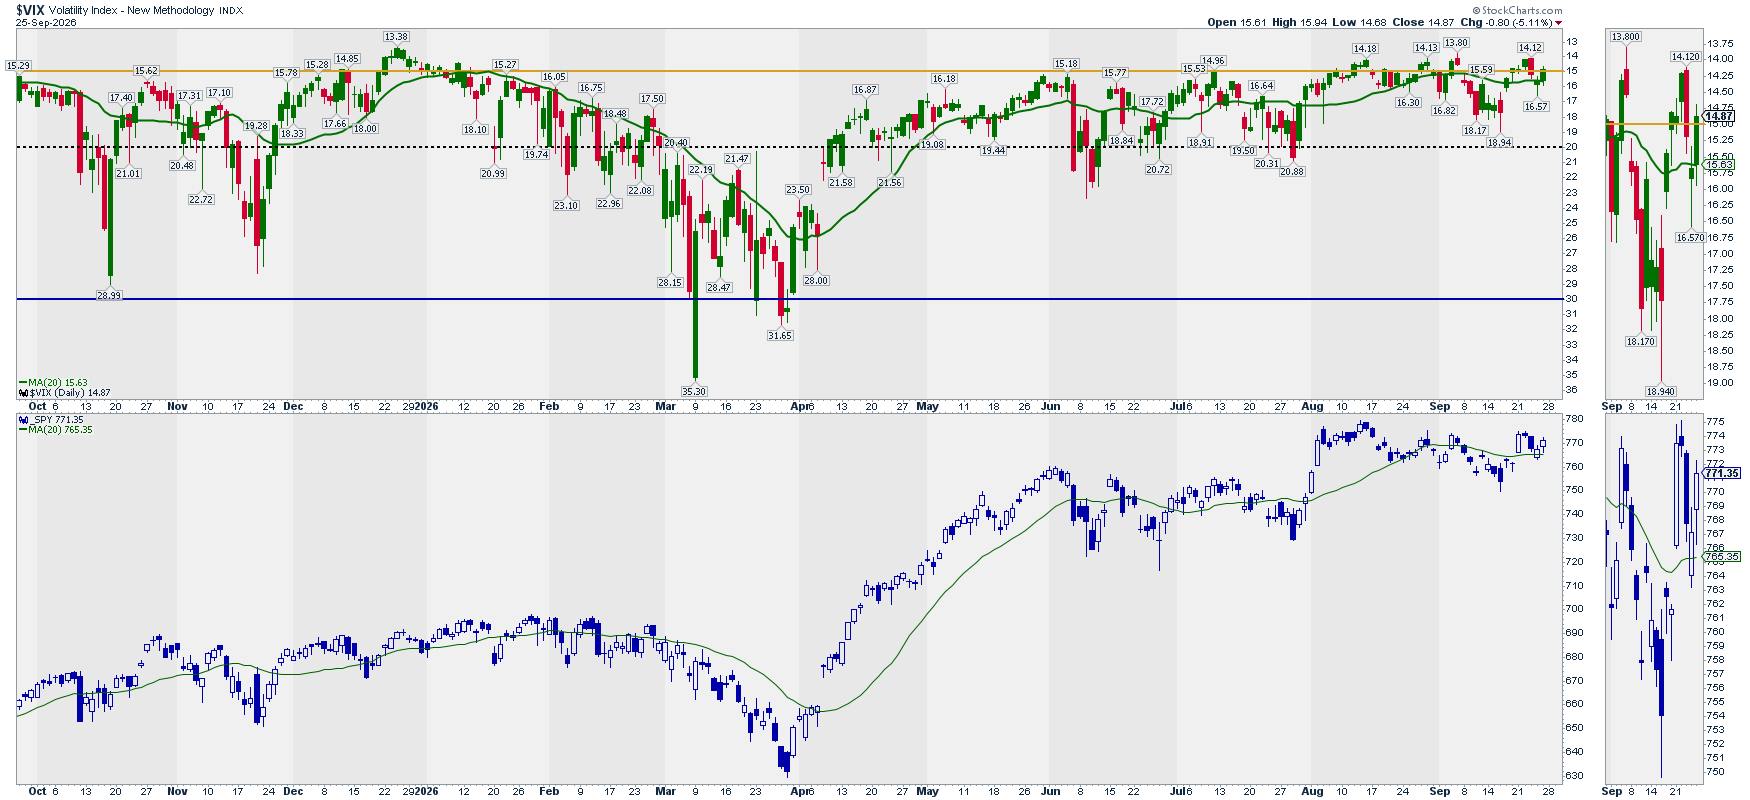
Note: This chart is mainly to detect extreme volatility situations that, once they reverse, offer great long opportunities in the market.
Analysis: Inverted VIX crossed back above the SMA signal line. Low volatility is expected.
ACH: 12
Options: (Inverted) Put/Call Ratio vs. SPY
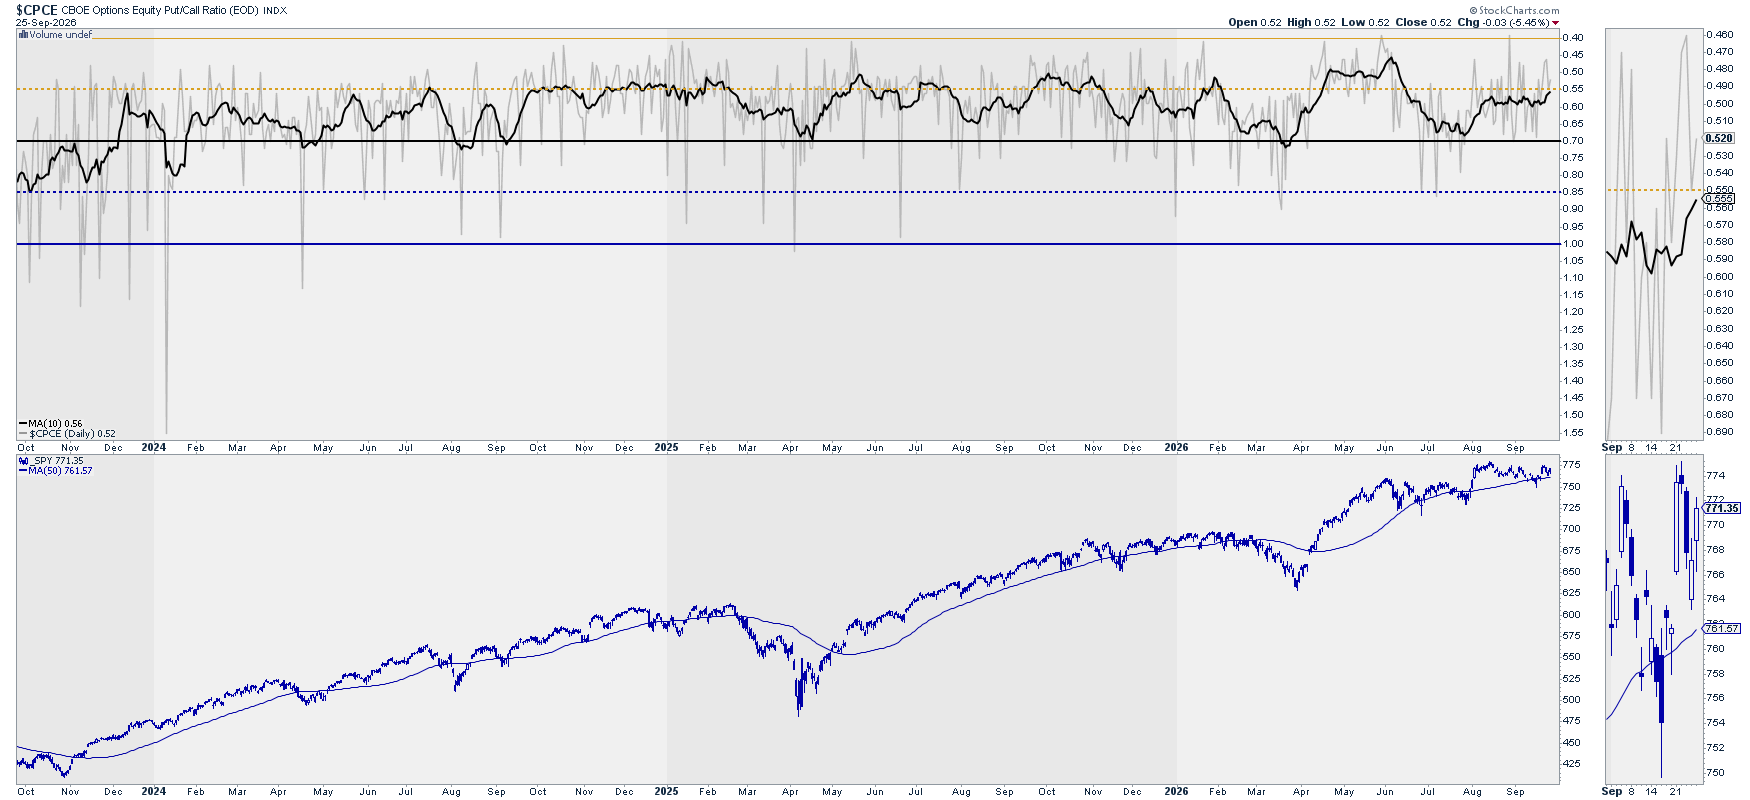
Analysis: Change to an uptrend.
ACH: 10
Options: Gamma Exposure – SPY
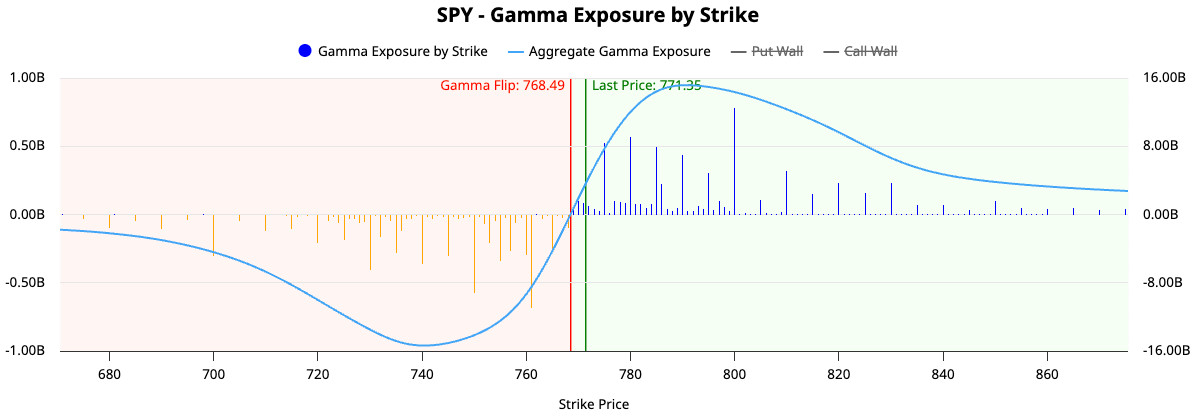
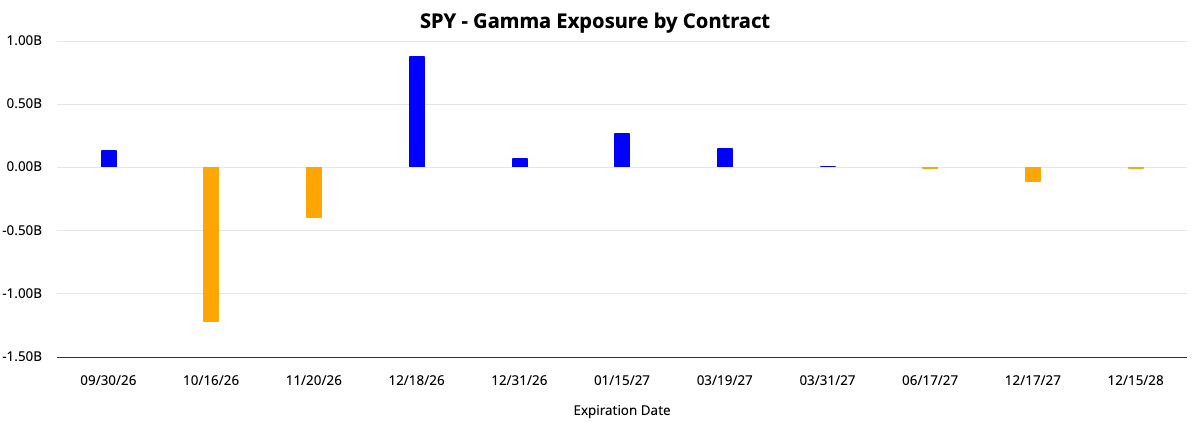
Analysis: Back to positive GEX territory. We start seeing movement even above 800 level while the lower wall has moved up to 760.
Upper wall(s): 800
Lower wall(s): 760
Sectors: Where is it happening?
Sectors Rotation
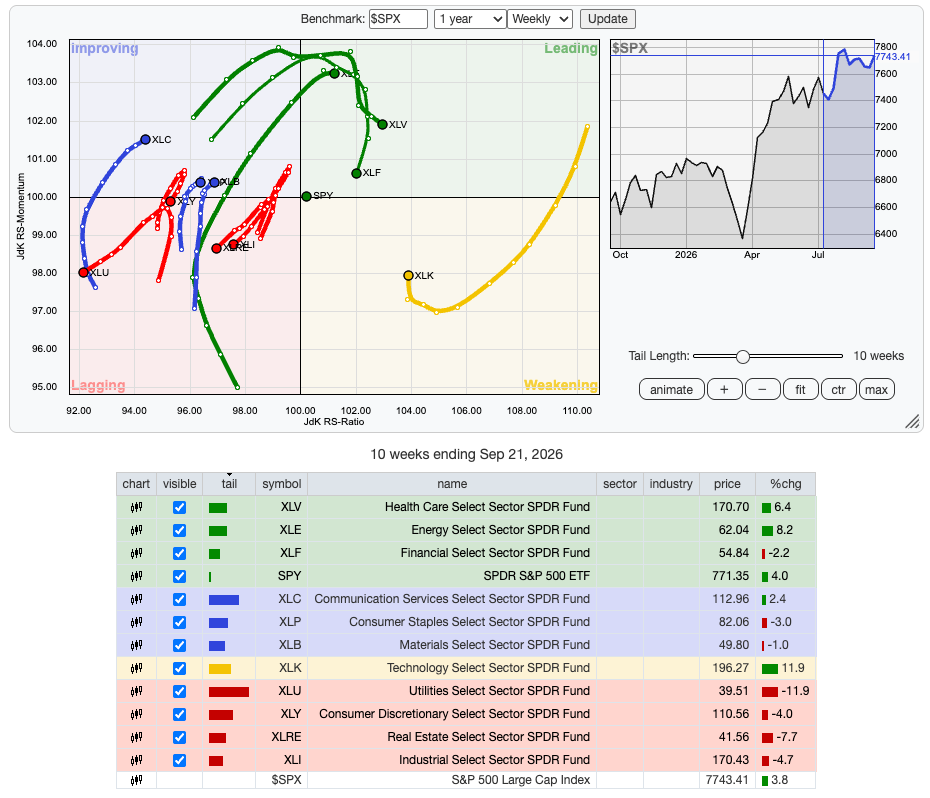
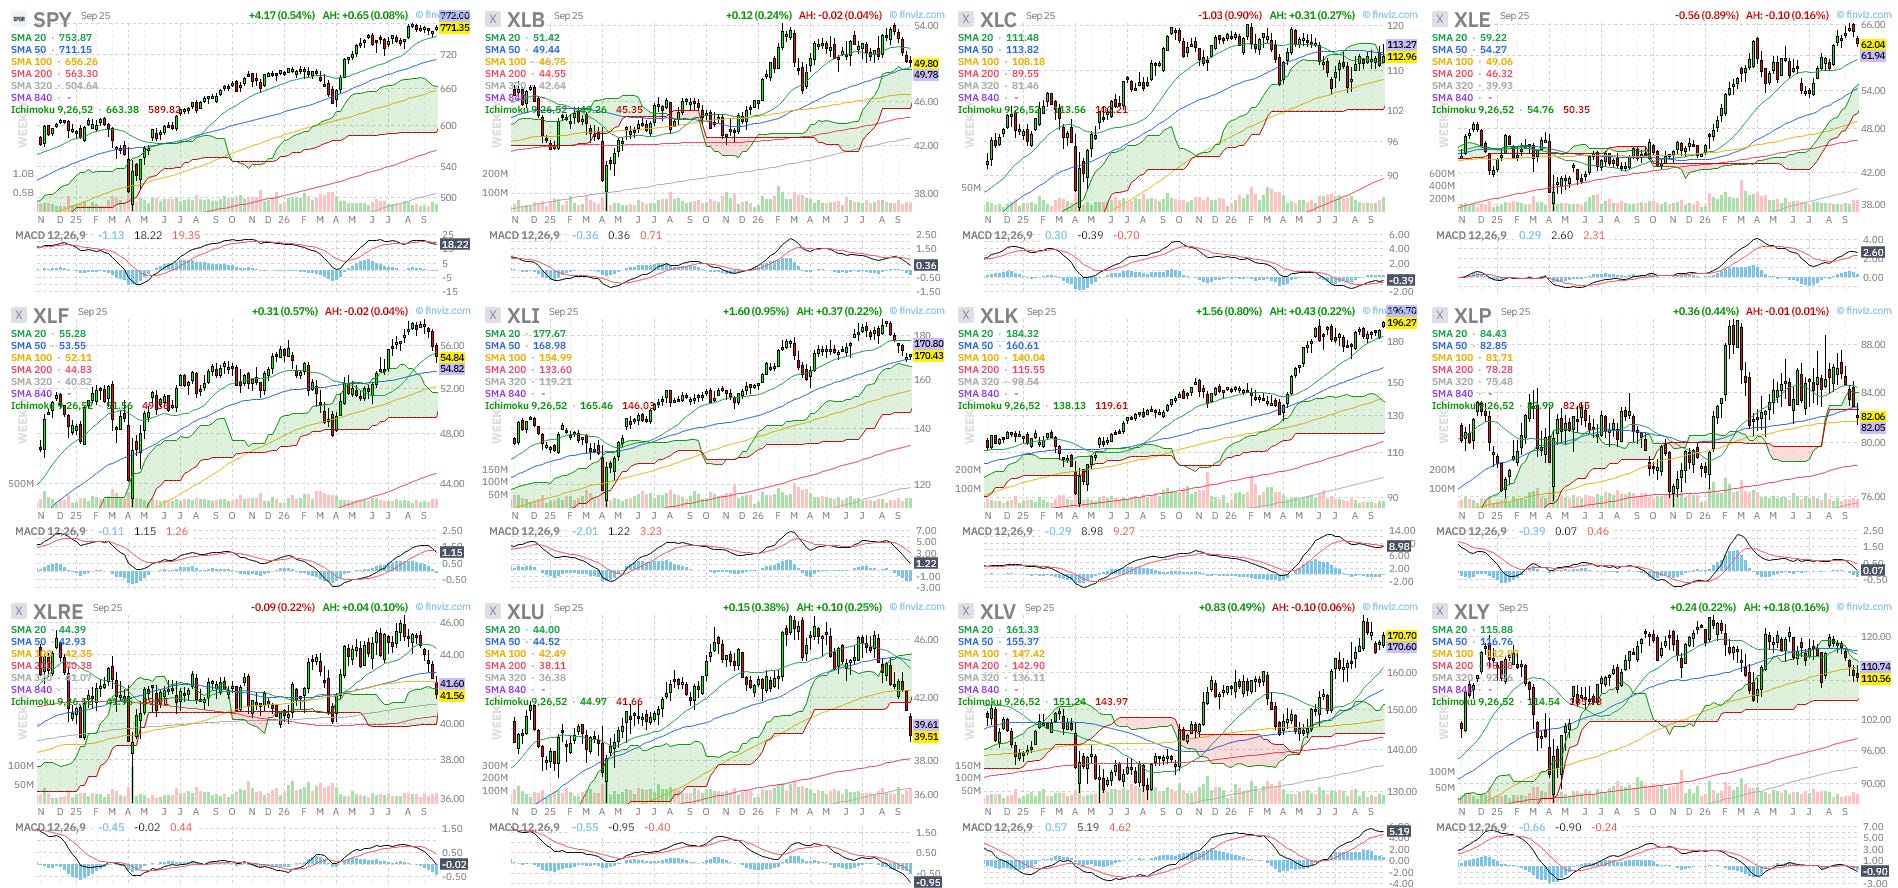
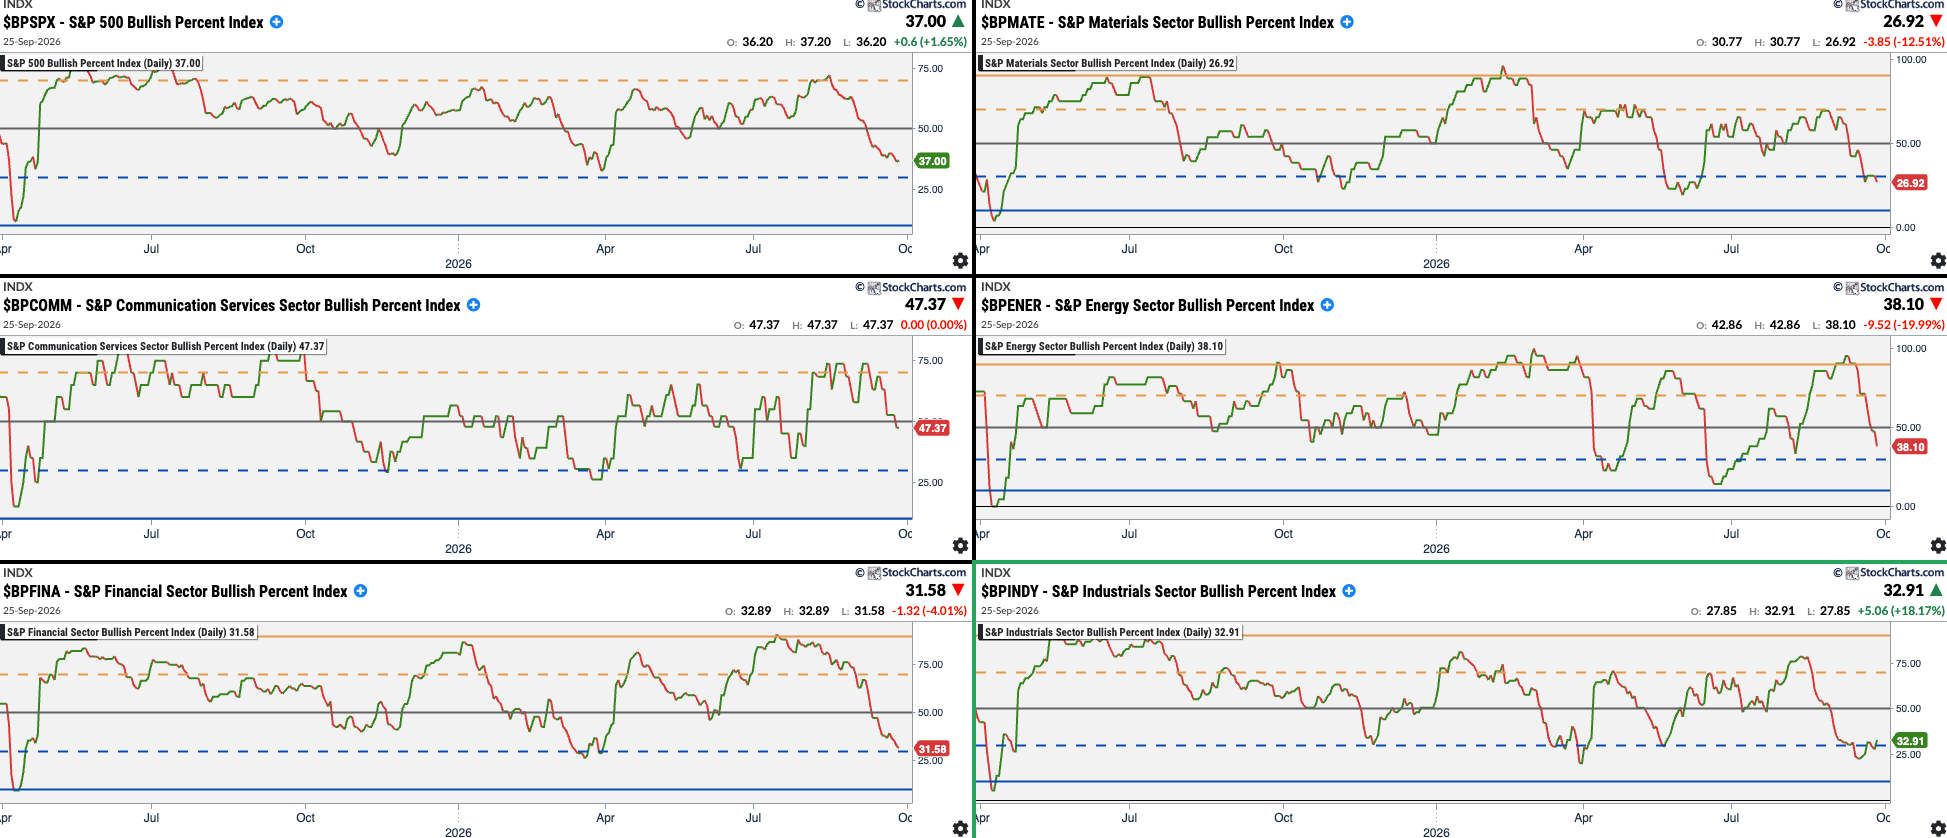
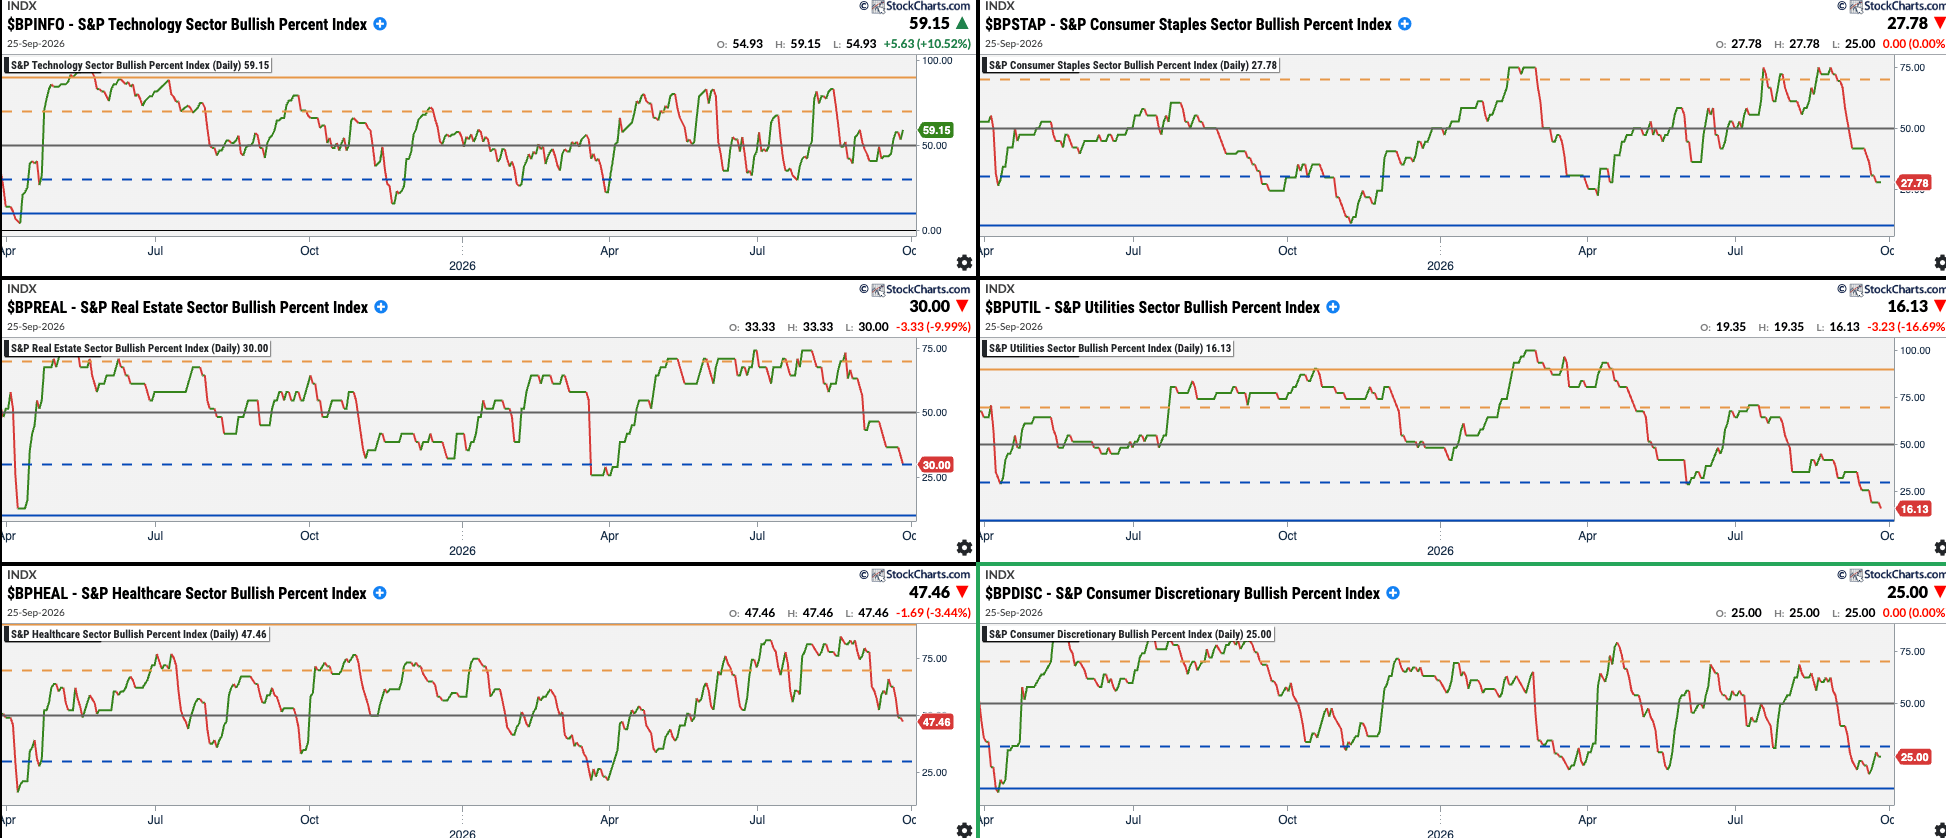
Summary:

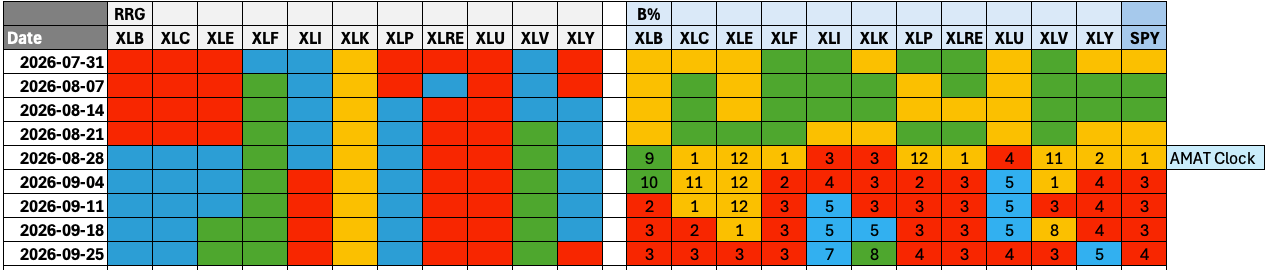
AMAT Portfolios
Forever Portfolio

The World of Tomorrow


Last Word
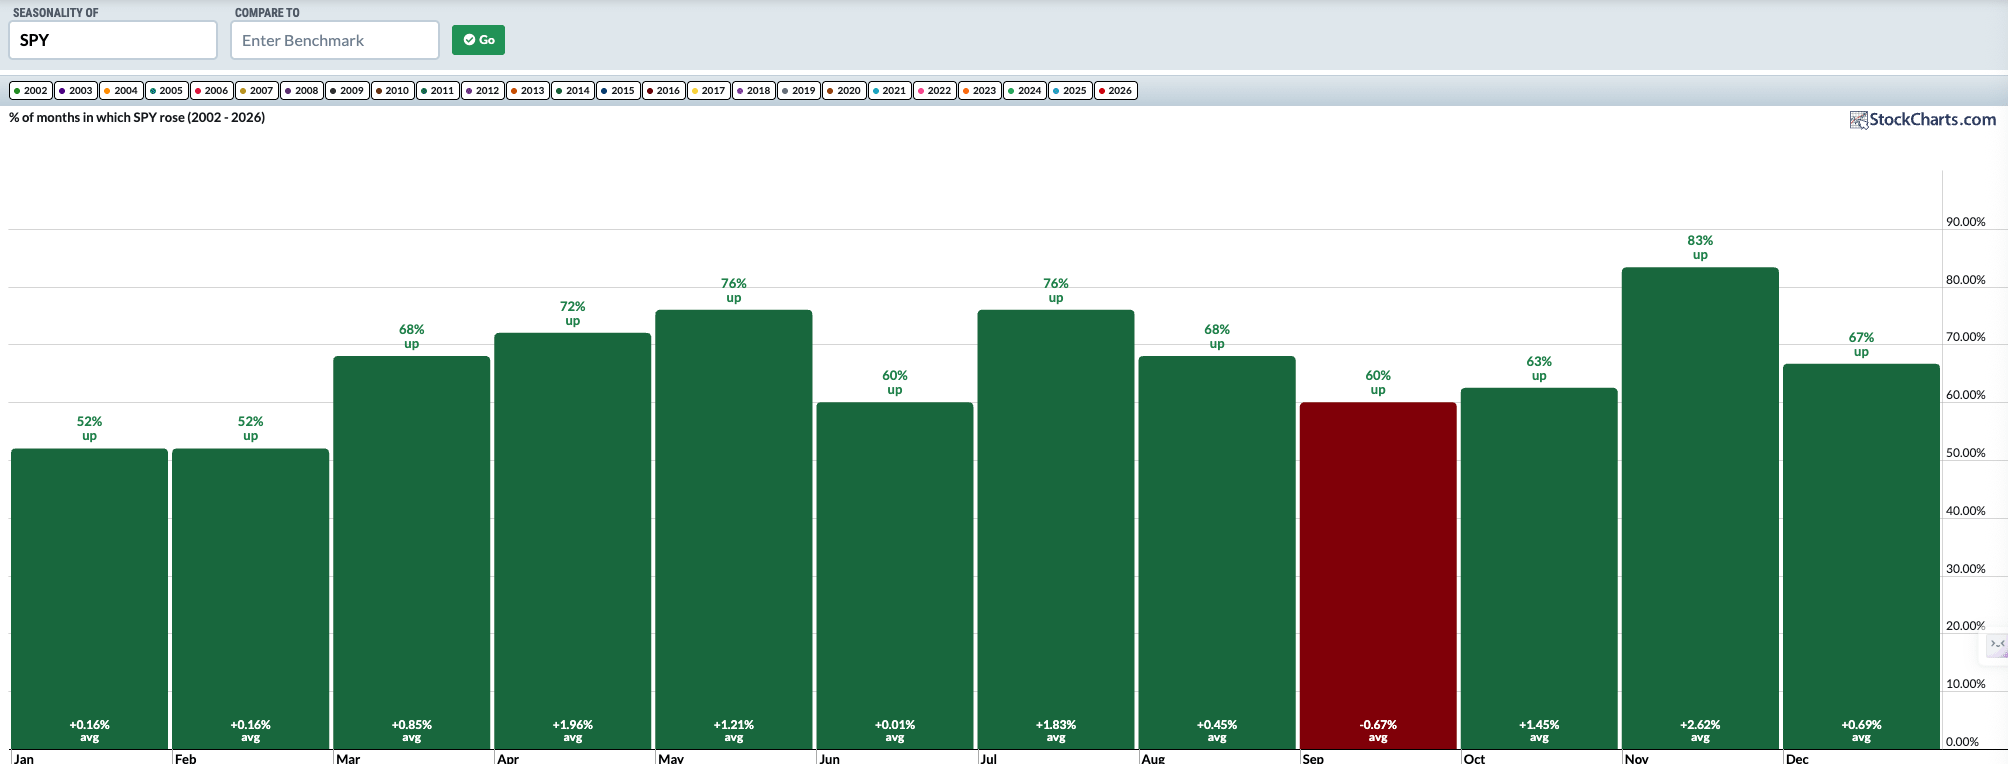
Above is the seasonality chart for the last 25 years. We are about to start the best historically-based months, from October to May. You know that saying of ‘sell in May and go away’. But when do you come back buying? In October!
Breadth is in a nice place as well:
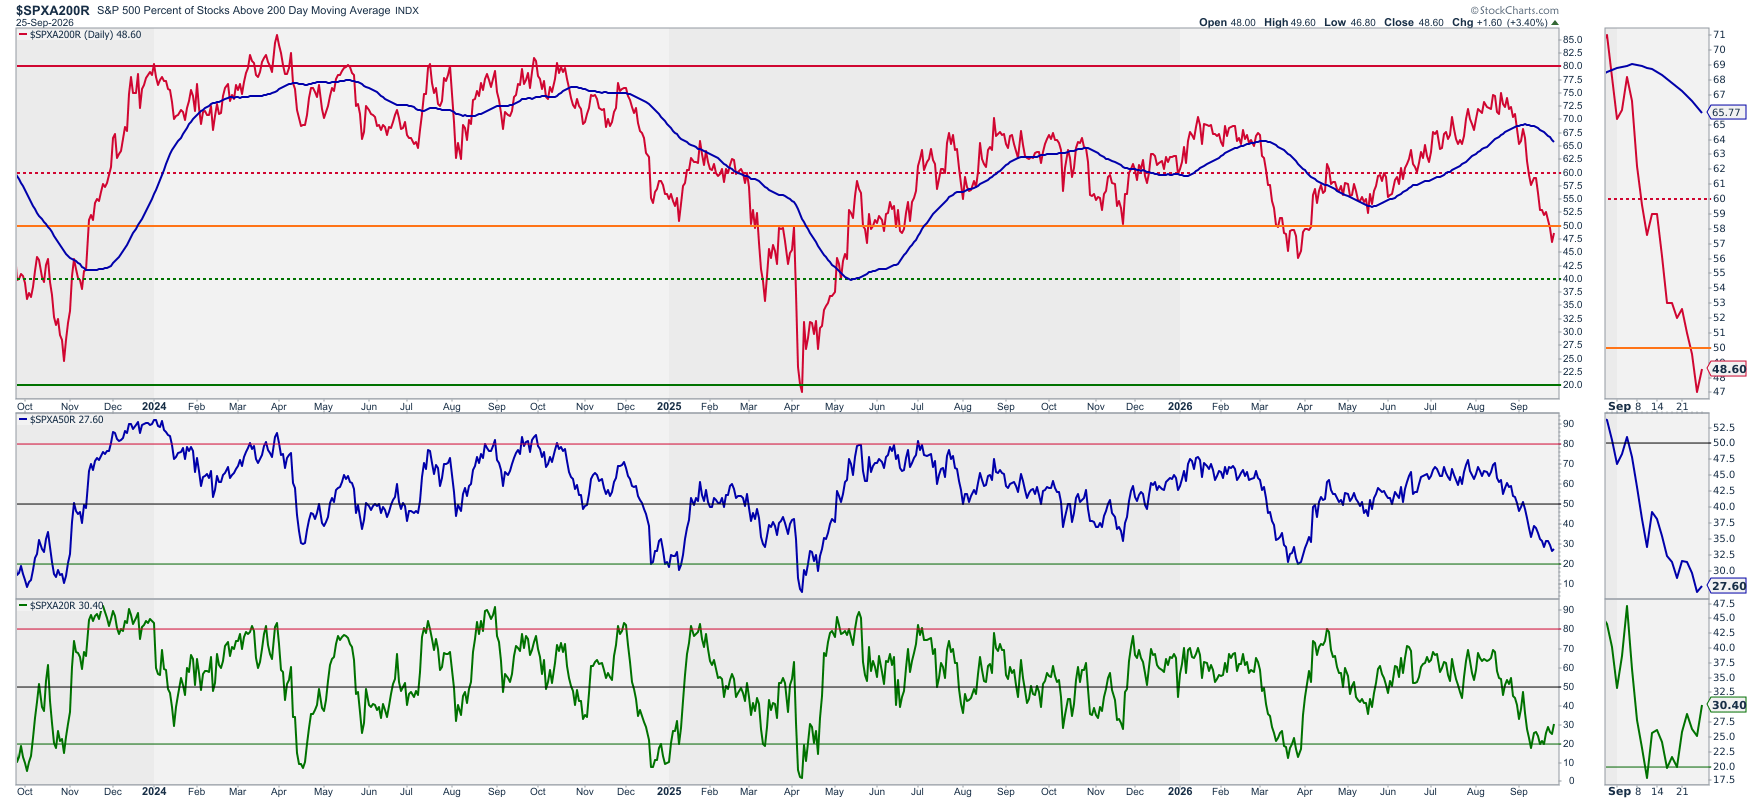
We have plenty of stocks under their 200D (red), 50D (blue) and 20D (green) SMAs. In the Percentage of stocks below their 20D SMA chart (green) we can see already some bouncing action. The chart above is telling us that stocks have been through a correction period and we shall have plenty of room to run to the upside.
When you have history and breadth aligned for the best months in the market, only a black swan type of event could derail us. Which probabilities would you like to play? 25 years of tailwinds or a rare event? For me… let me fly!
Disclaimer: The content on AMAT Investing is strictly for educational and learning purposes. The author is not a licensed financial advisor and holds no formal financial education. This post does not constitute professional financial advice. All investing involves risk of loss. Always conduct your own research and consult a licensed professional before making any investment decisions.