Context: Why is it happening?
Economic Production: ISM PMI vs. SPX
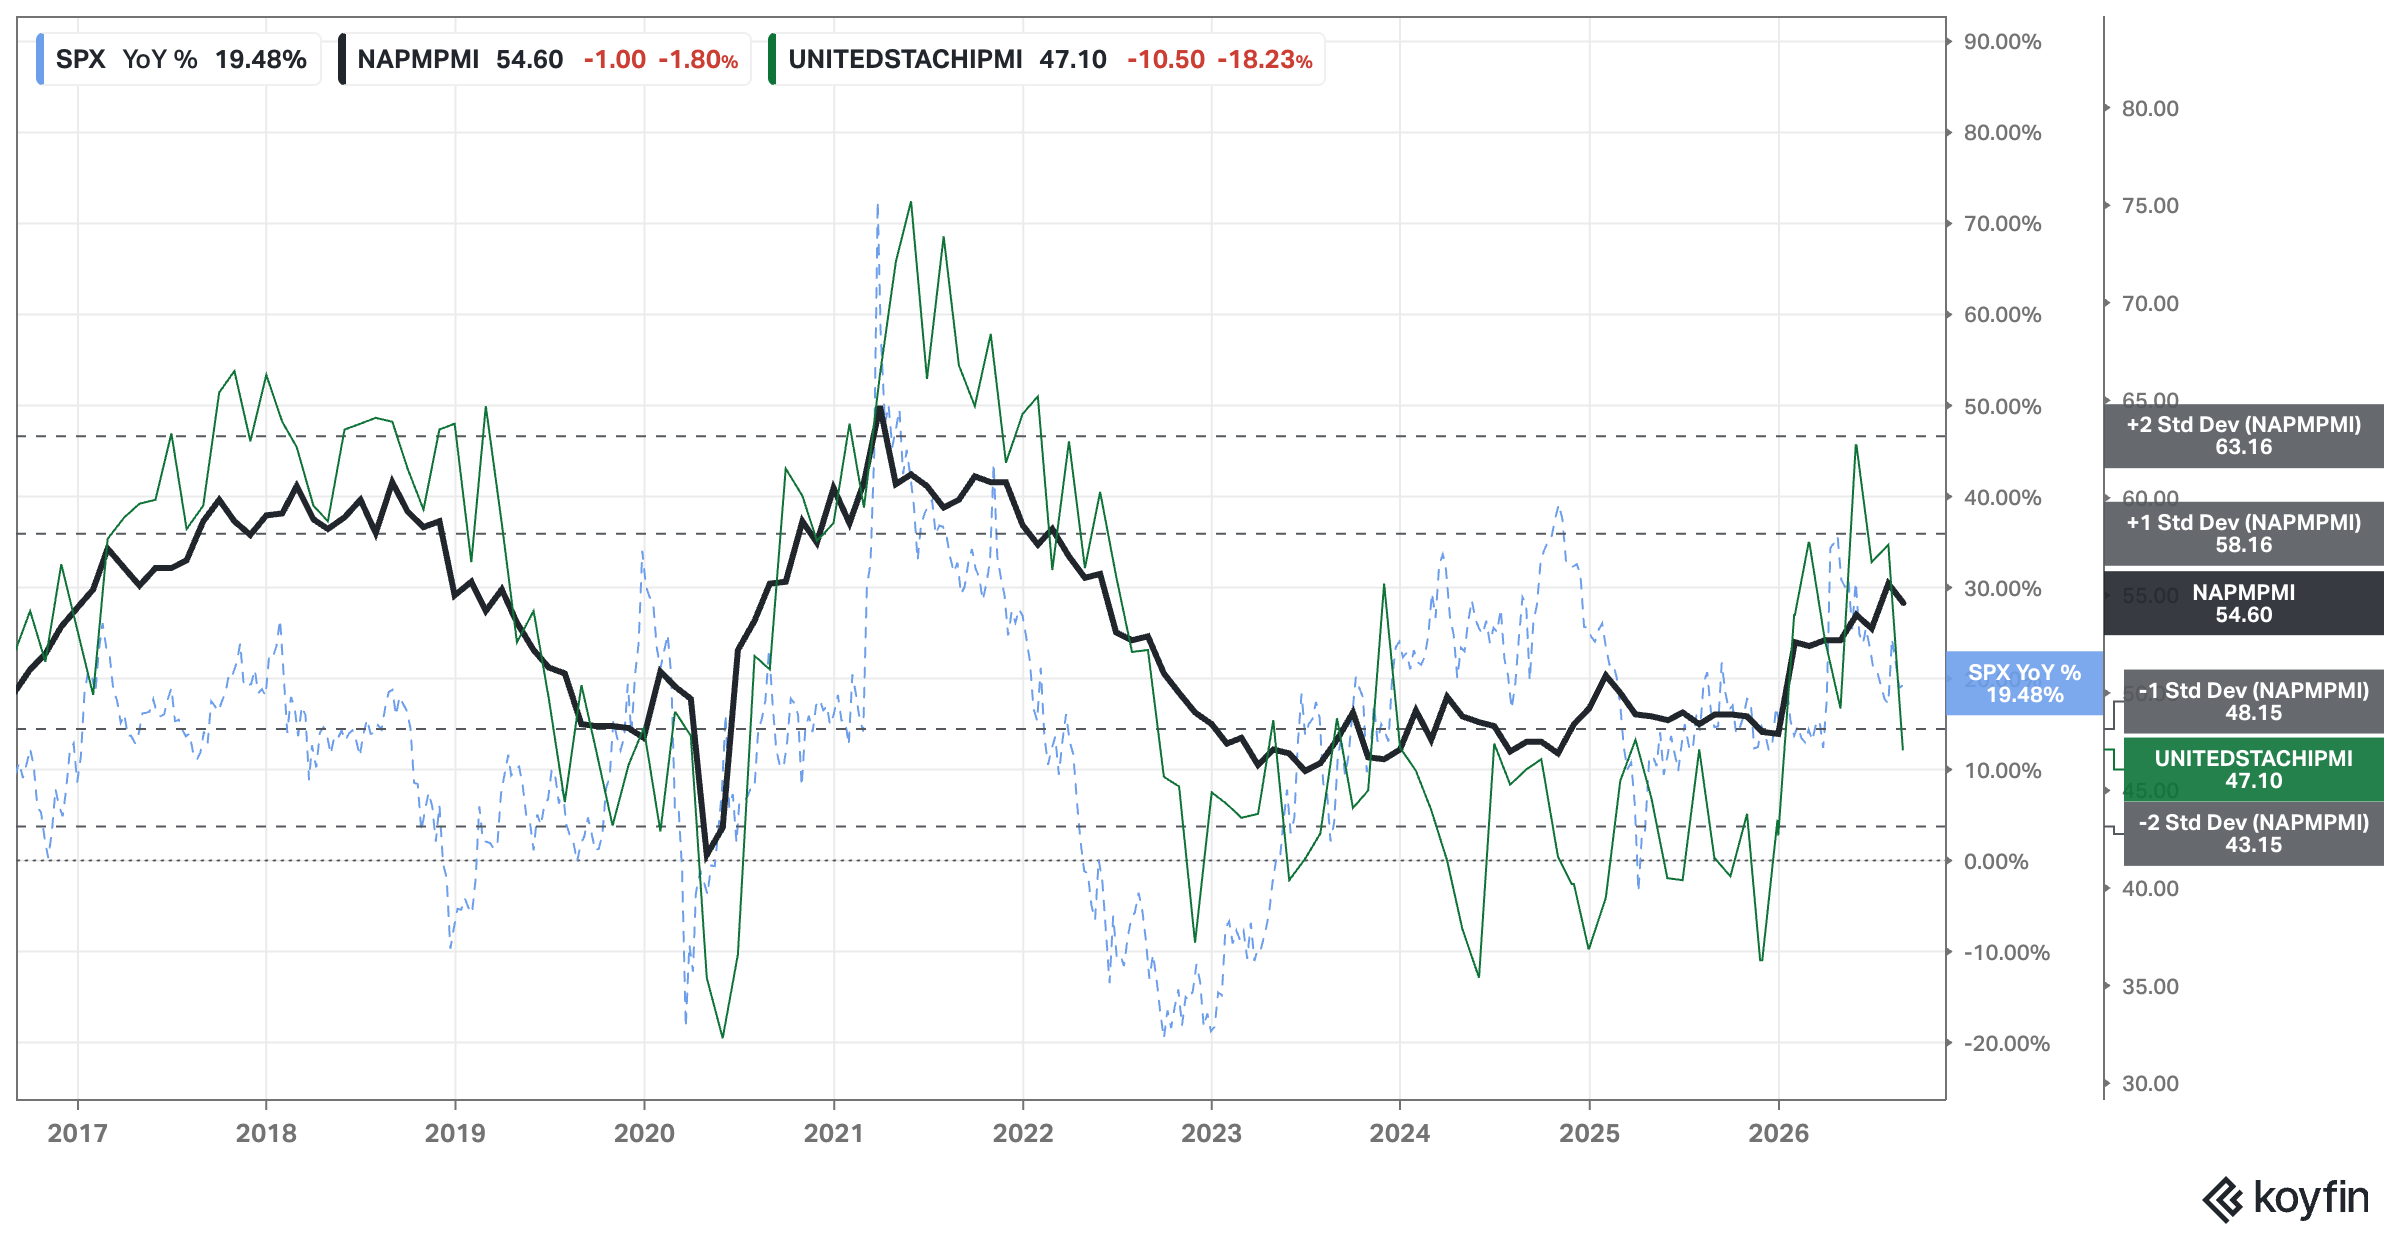
Analysis: No changes since last week.
ACH: 8
Economic Activity: Regional Banks Performance
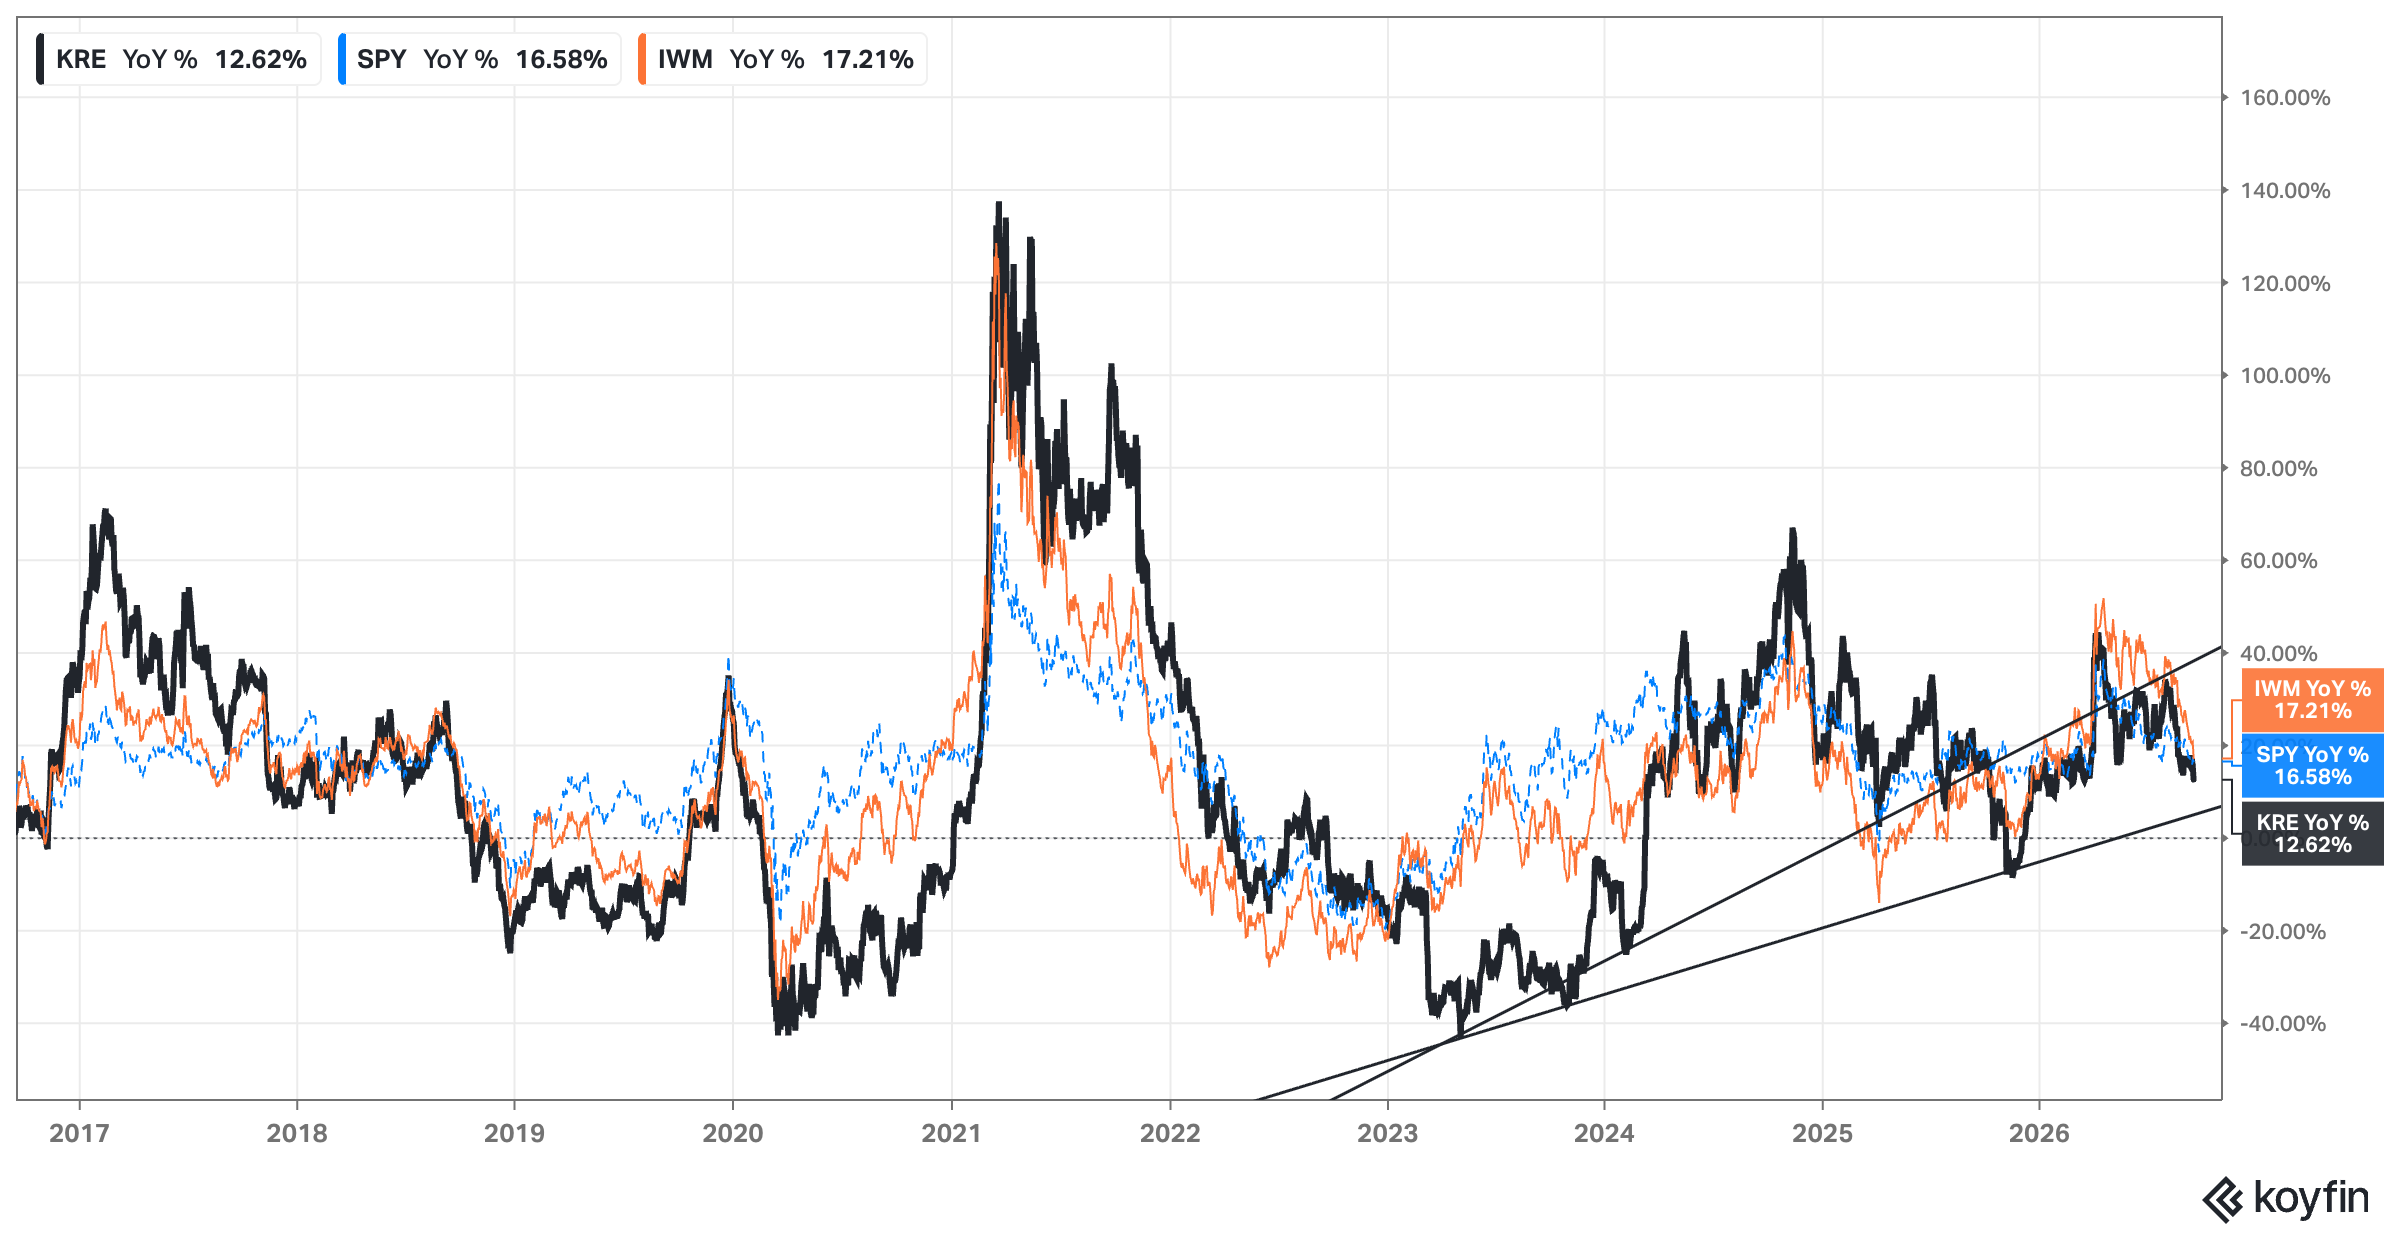
Analysis: Depending on the trendline that we consider, KRE may be still on an uptrend, and just going through a small correction (ACH 7), or it has failed to break above previous resistance and is starting a downtrend (ACH 2).
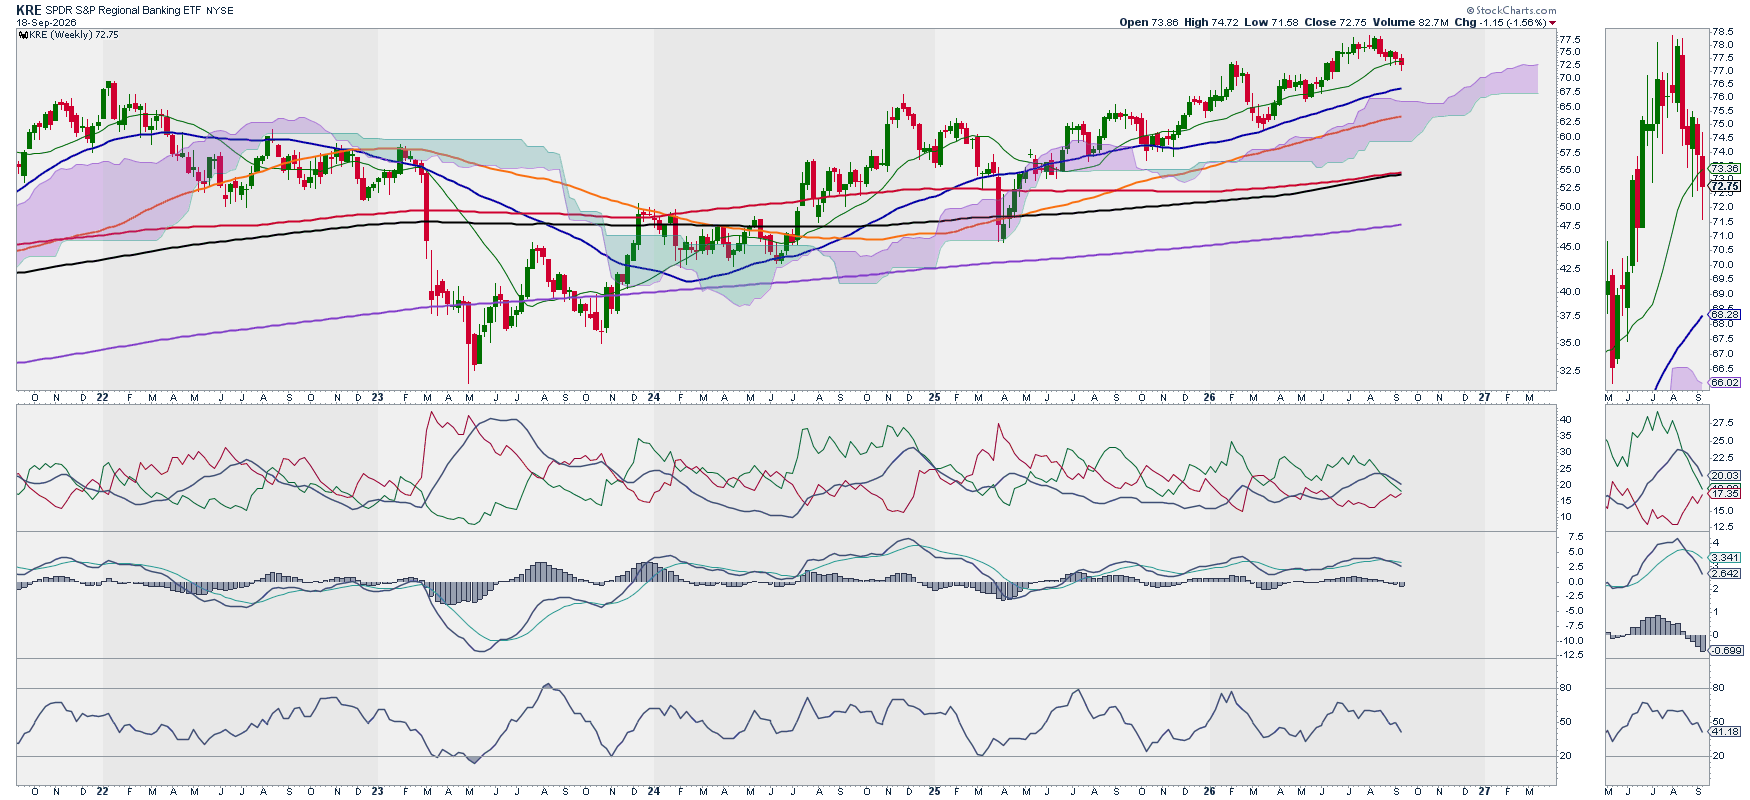
The above chart’s scale is %YoY. If we look at a price chart…
5 years weekly:
1 year daily:
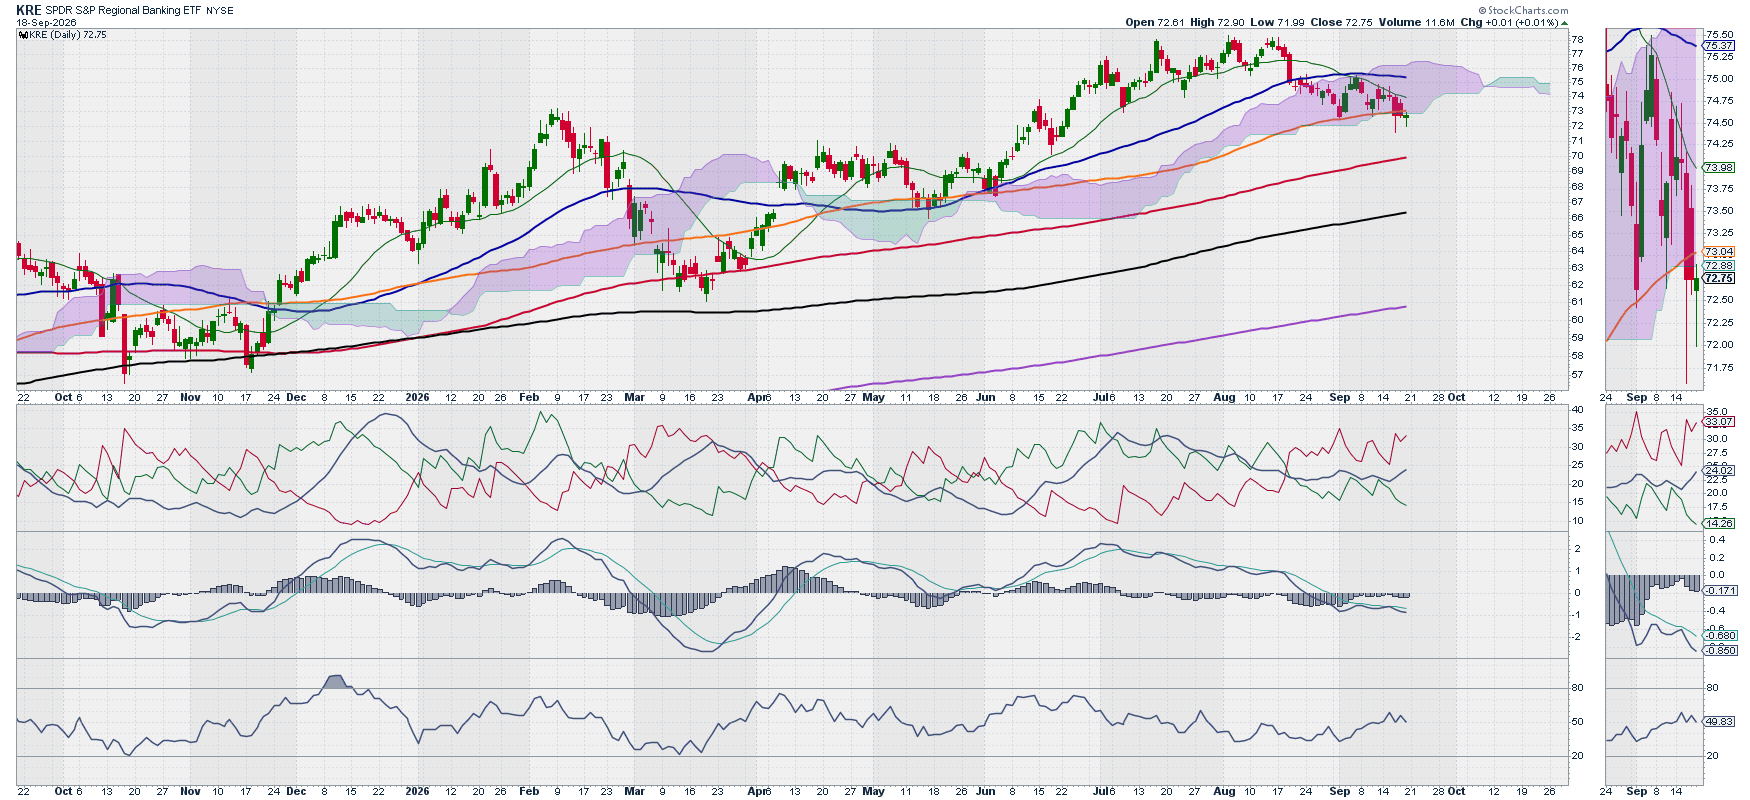
In the weekly chart we see an equivalent situation to the YoY% chart. A clear uptrend with bounces off the 50W SMA. In the daily chart, we see a declining trend, that most probably will bounce off the 200D SMA.
As I like to set the AMAT Clock Hour to the daily timeframe more than any other. I will change from a 7 hour to a 3 hour reading.
ACH: 3
Interest Rates: FED, 2yr, 10yr, and 30yr Rates
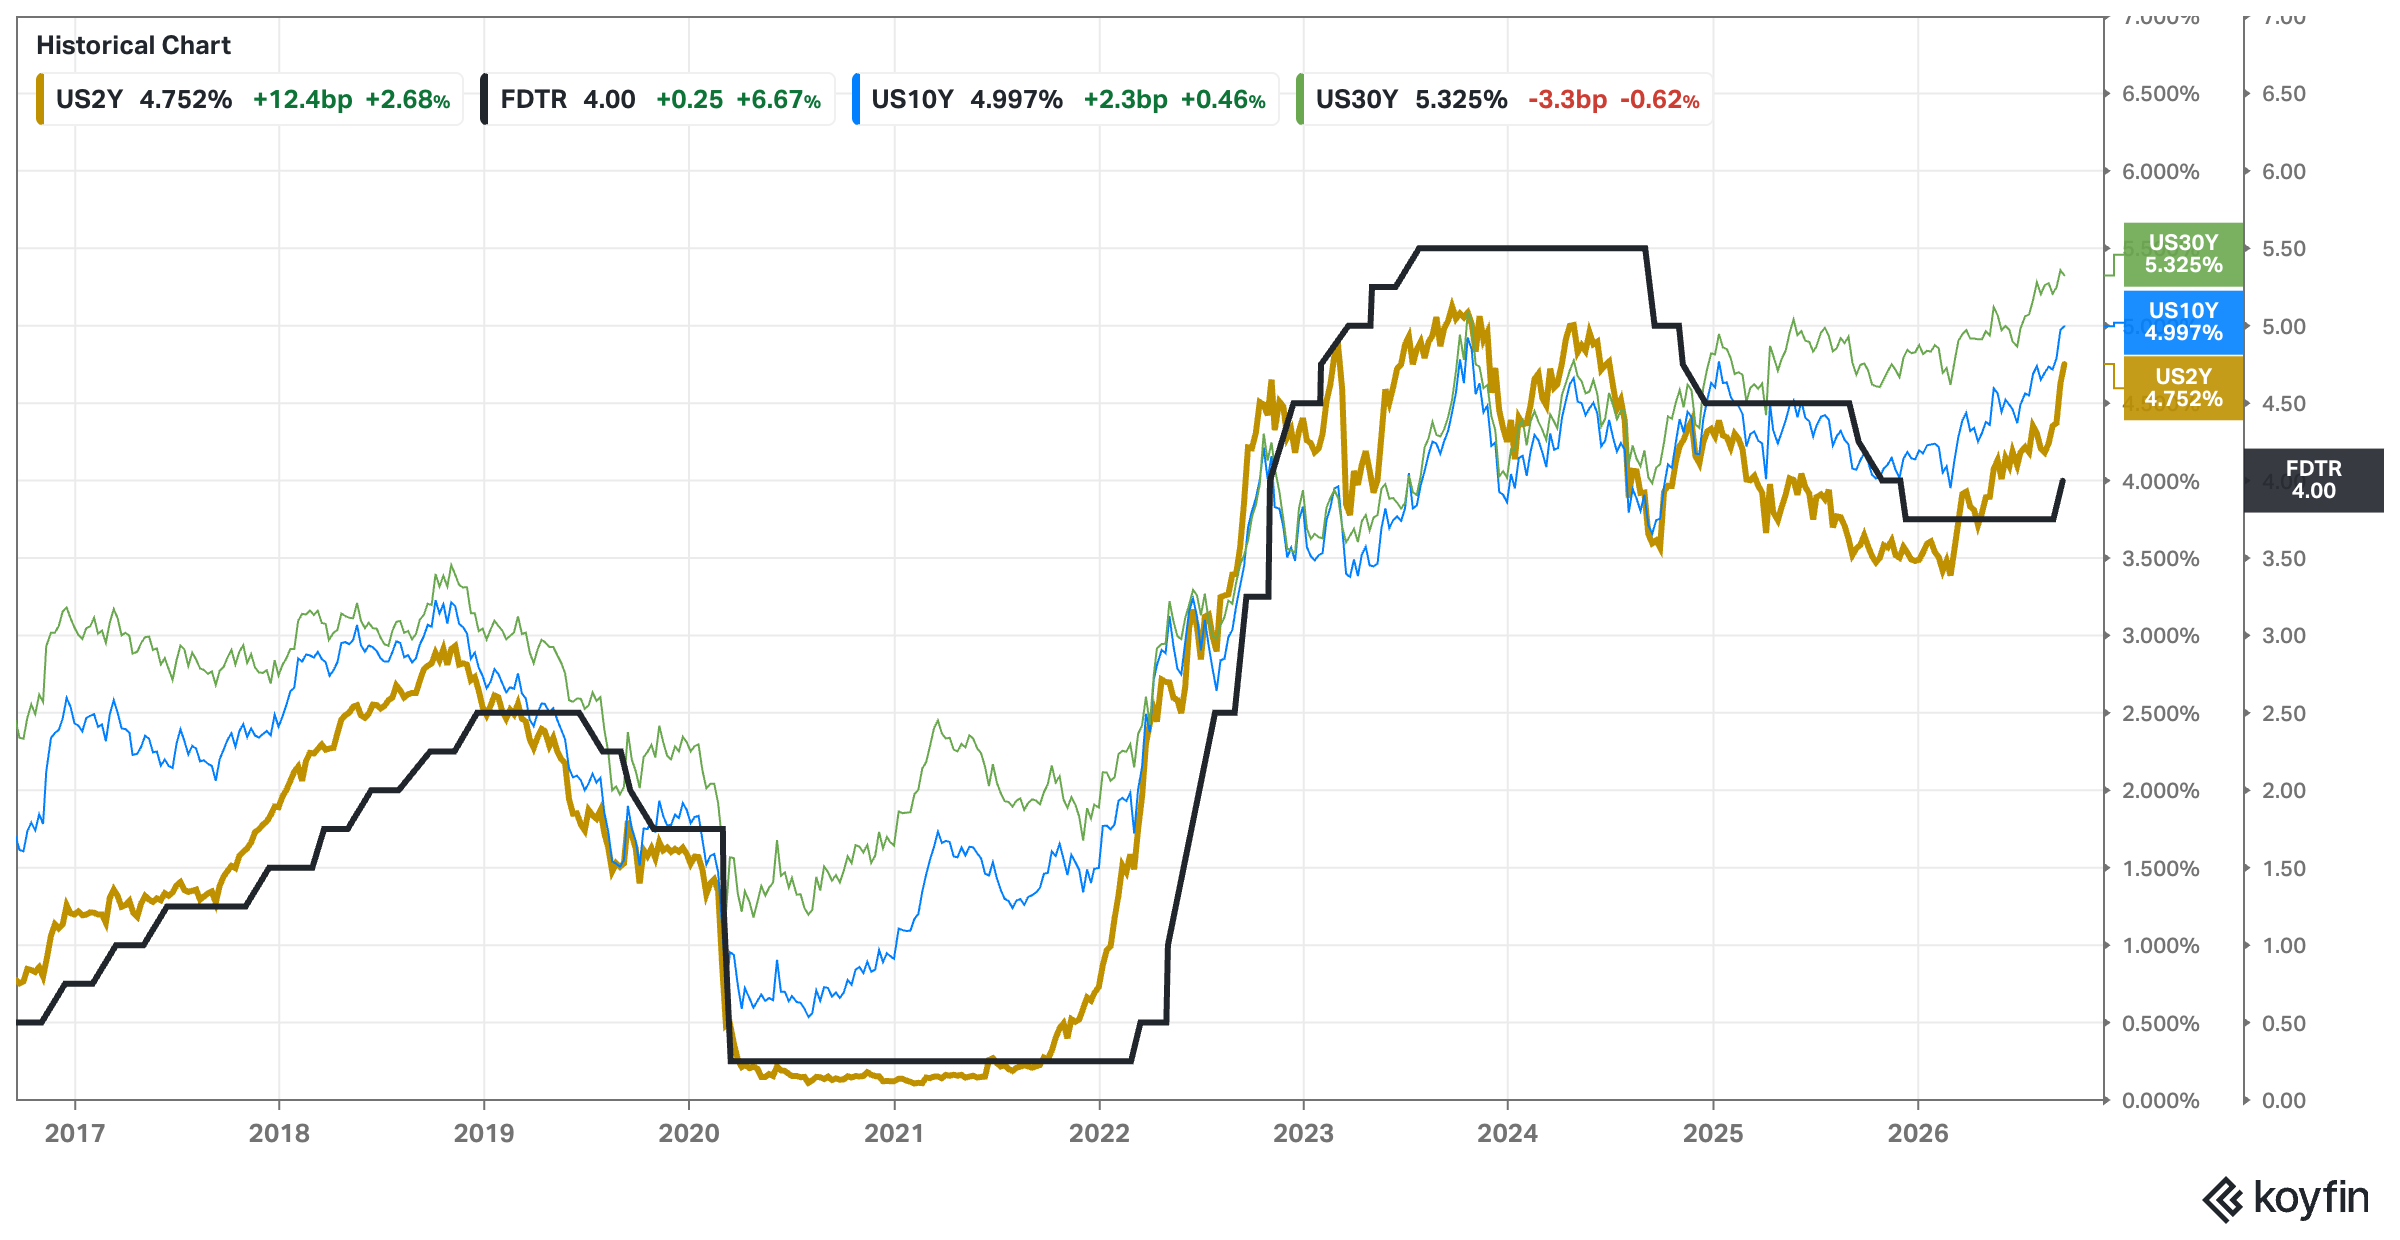
Analysis: FED hiked rates by 25 basis points to 4%. Short and long term rates responded accordingly. Yet historically speaking rates around 5% are quite normal:
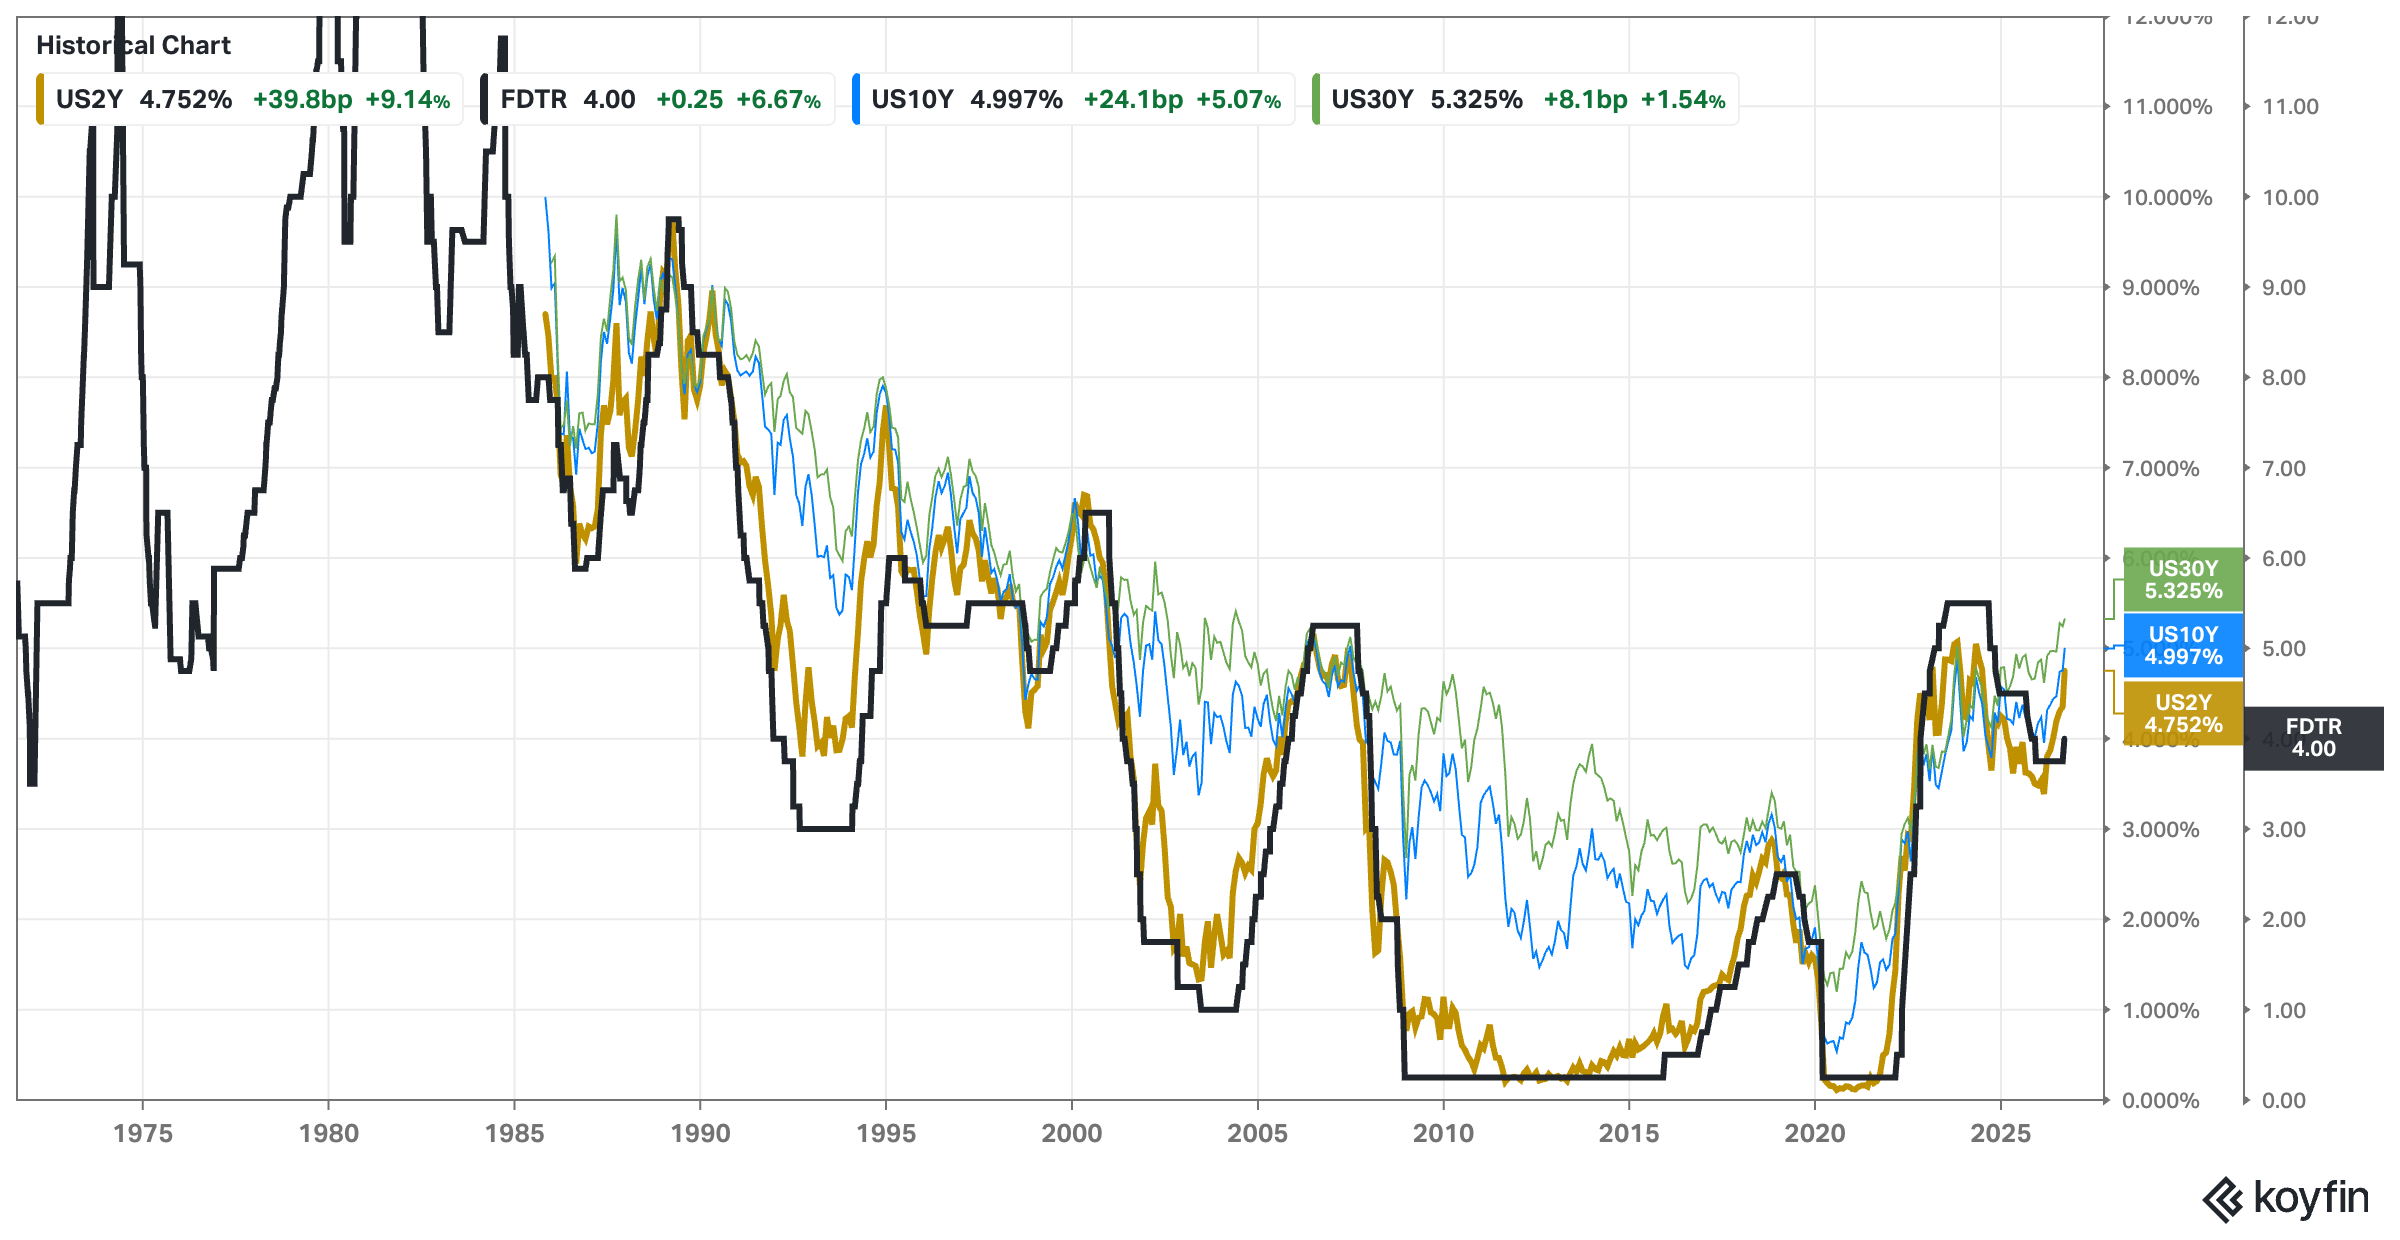
Maybe the issue is not on the rate but on the spending trend the US (and the majority of all others) is in.
If, in the coming months, we see some sort of inflation cooling, specially due to the new PCE calculation, and government spending restraint, maybe due to a gridlock between Republicans and Democrats in the US Congress after the elections, we could see rates going lower and a good moment to load up to TLT:
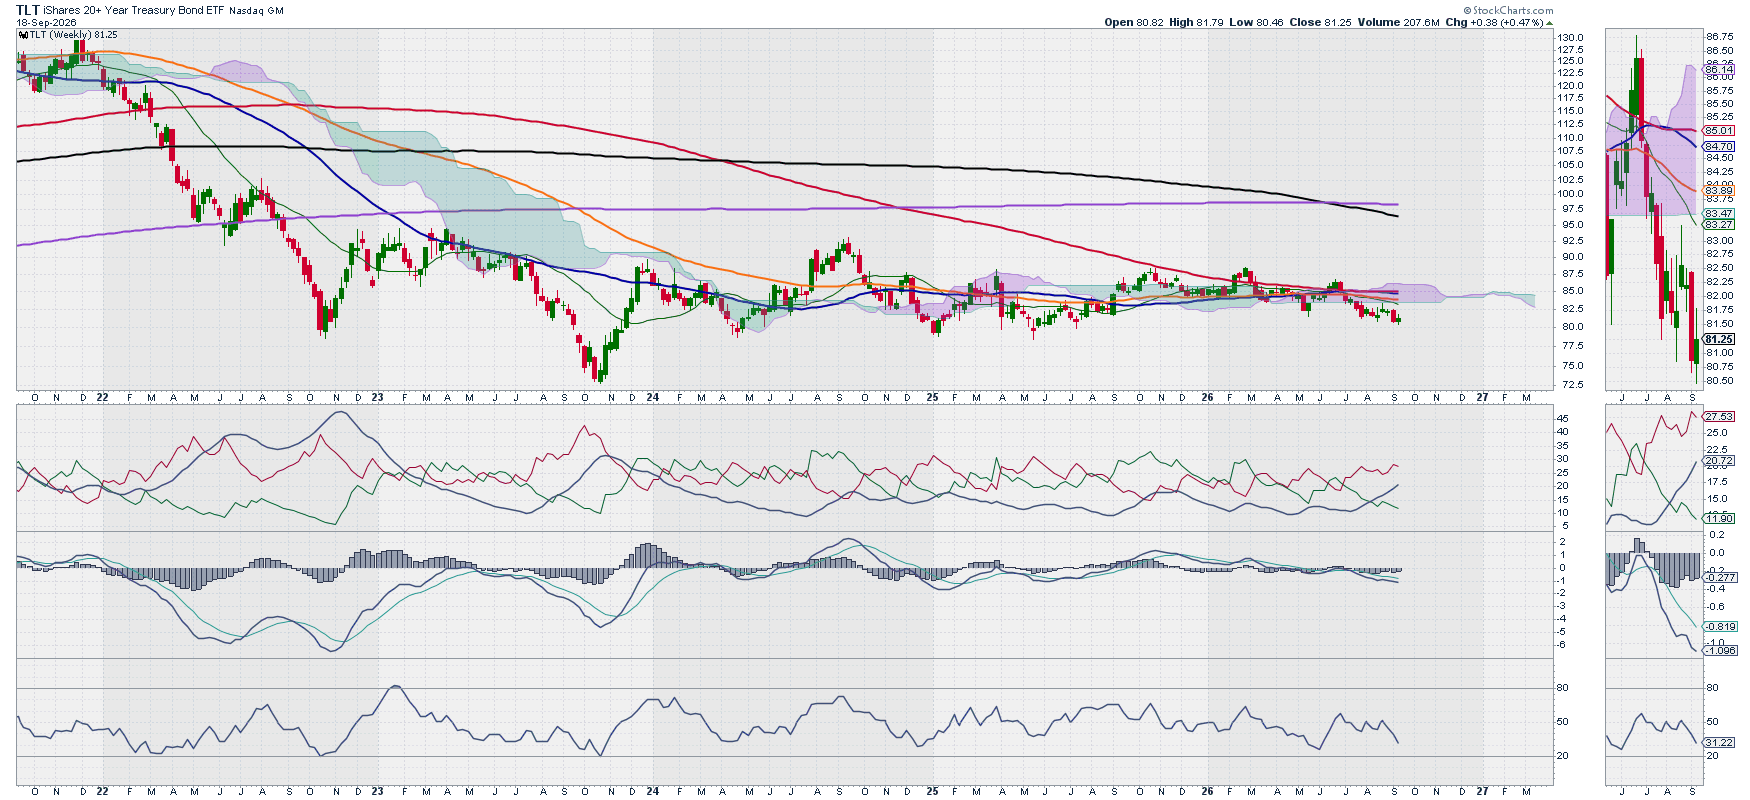
ACH (inverted color): 11
Indexes: What is happening?
TA: Price Action, Trend, Momentum & Volume:
Weekly & Daily SPY, QQQ, and IWM
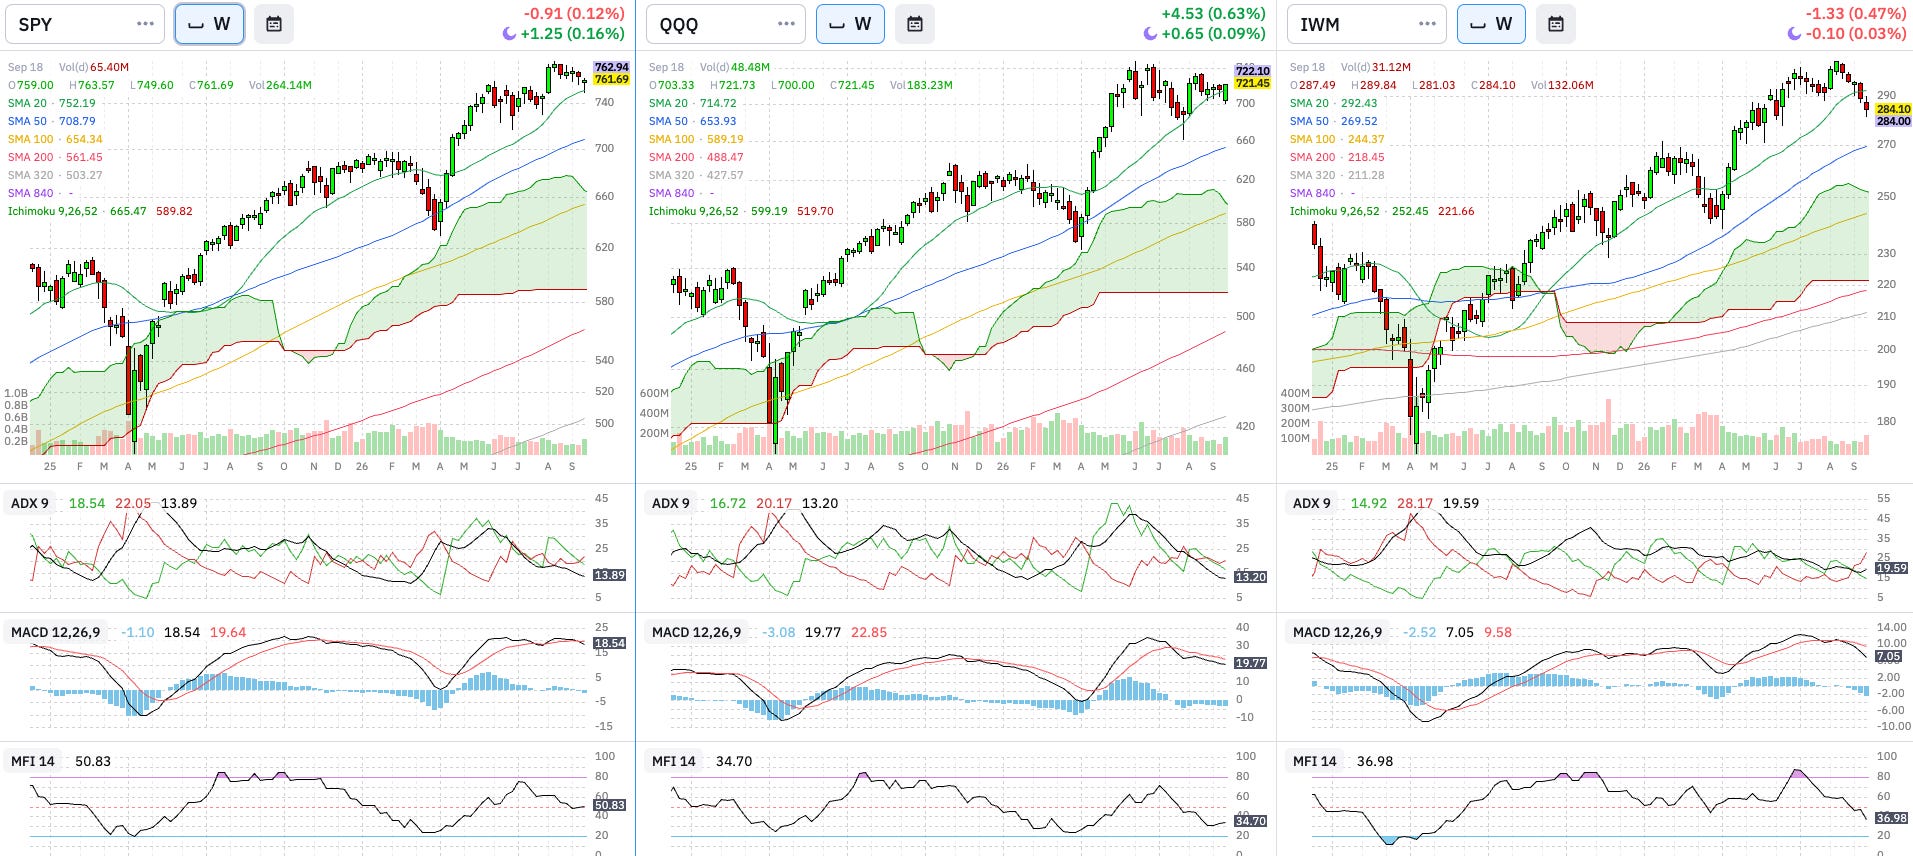
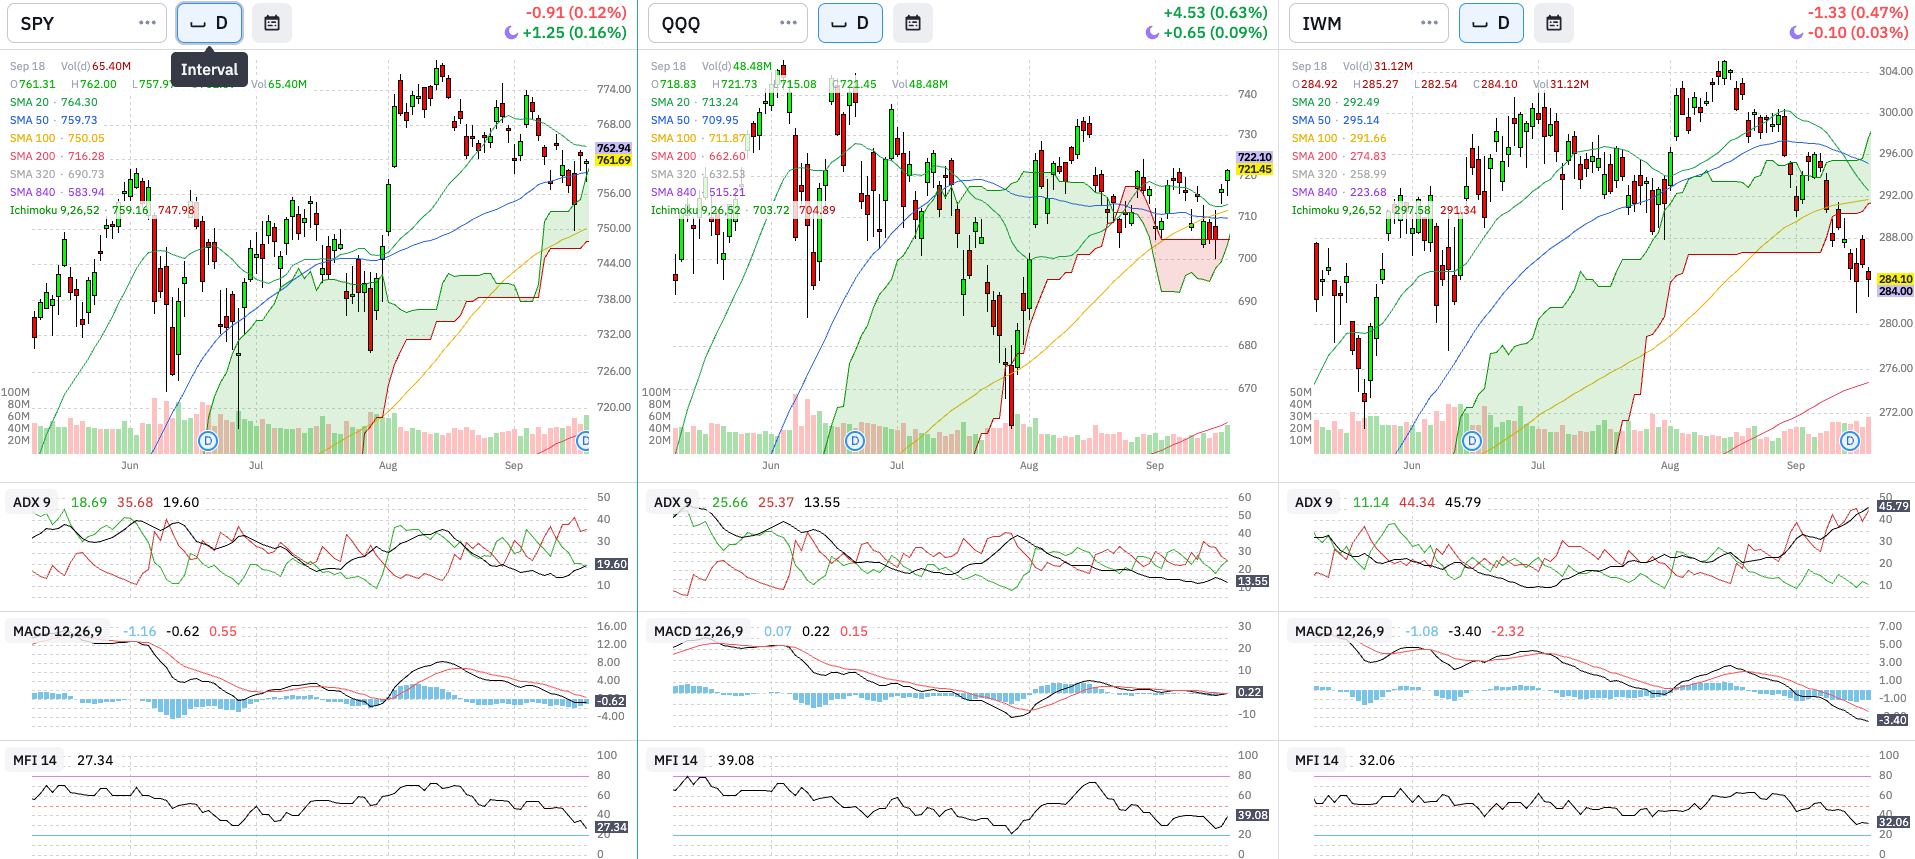
Technical Analysis:
Price (SMAs & Cloud): Weekly: SPY found support on its 20W SMA, QQQ crossed below and bounced to close above it, and IWM broke below it last week and this week remained below it. Daily: SPY keeps bouncing between 20D and 50D SMAs. QQQ raised above the 20D SMAs. IWM is falling below the 100D SMA with the next support down to the 200D. ACH: 2
Trend (ADX): Weekly: ADX weak and trend-less for SPY and QQQ, while bearish trend starts to dominate in IWM. Daily: ADX for SPY is on a bearish territory with an increasing trend. QQQ has very weak ADX. IWM is in a strong bearish trend. ACH: 2
Momentum (MACD): Weekly: All markets are rolling over their distribution phase into a downturn. Daily: SPY and QQQ hovering at the 0 level. Will they find support here? IWM on a freefall. ACH: 3
Volume (MFI): Weekly: All indices have bearish divergences. Daily: QQQ seems to have bottomed out. SPY and IWM still have more time to go. ACH: 4
Breadth: % Stocks above SMAs
Above 200 Daily SMA
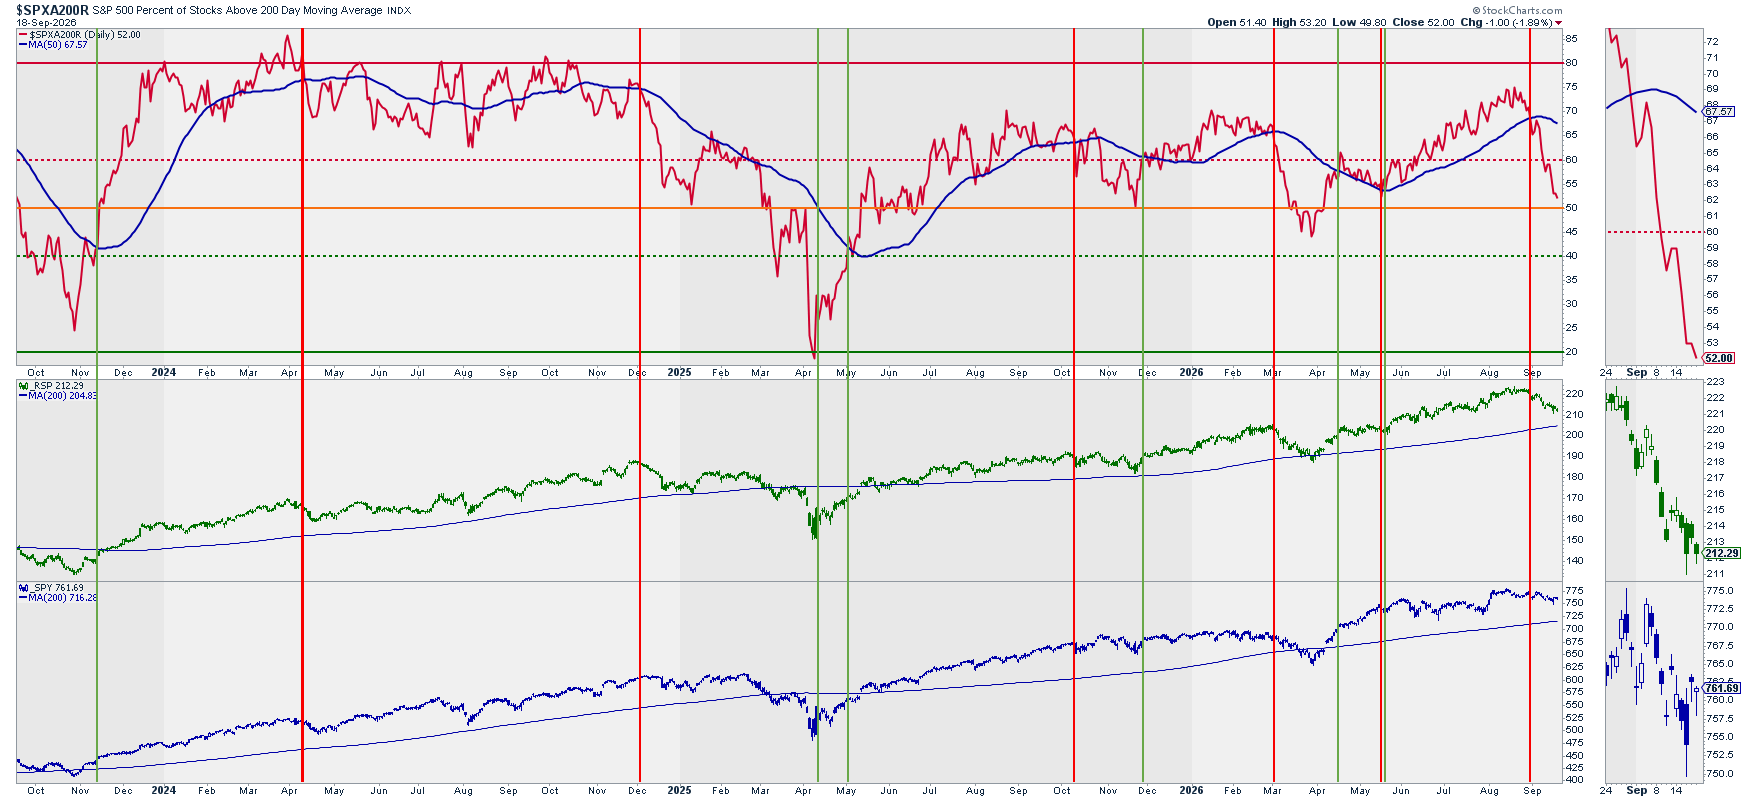
Above 20, 50, and 200 Daily SMAs vs. RSP
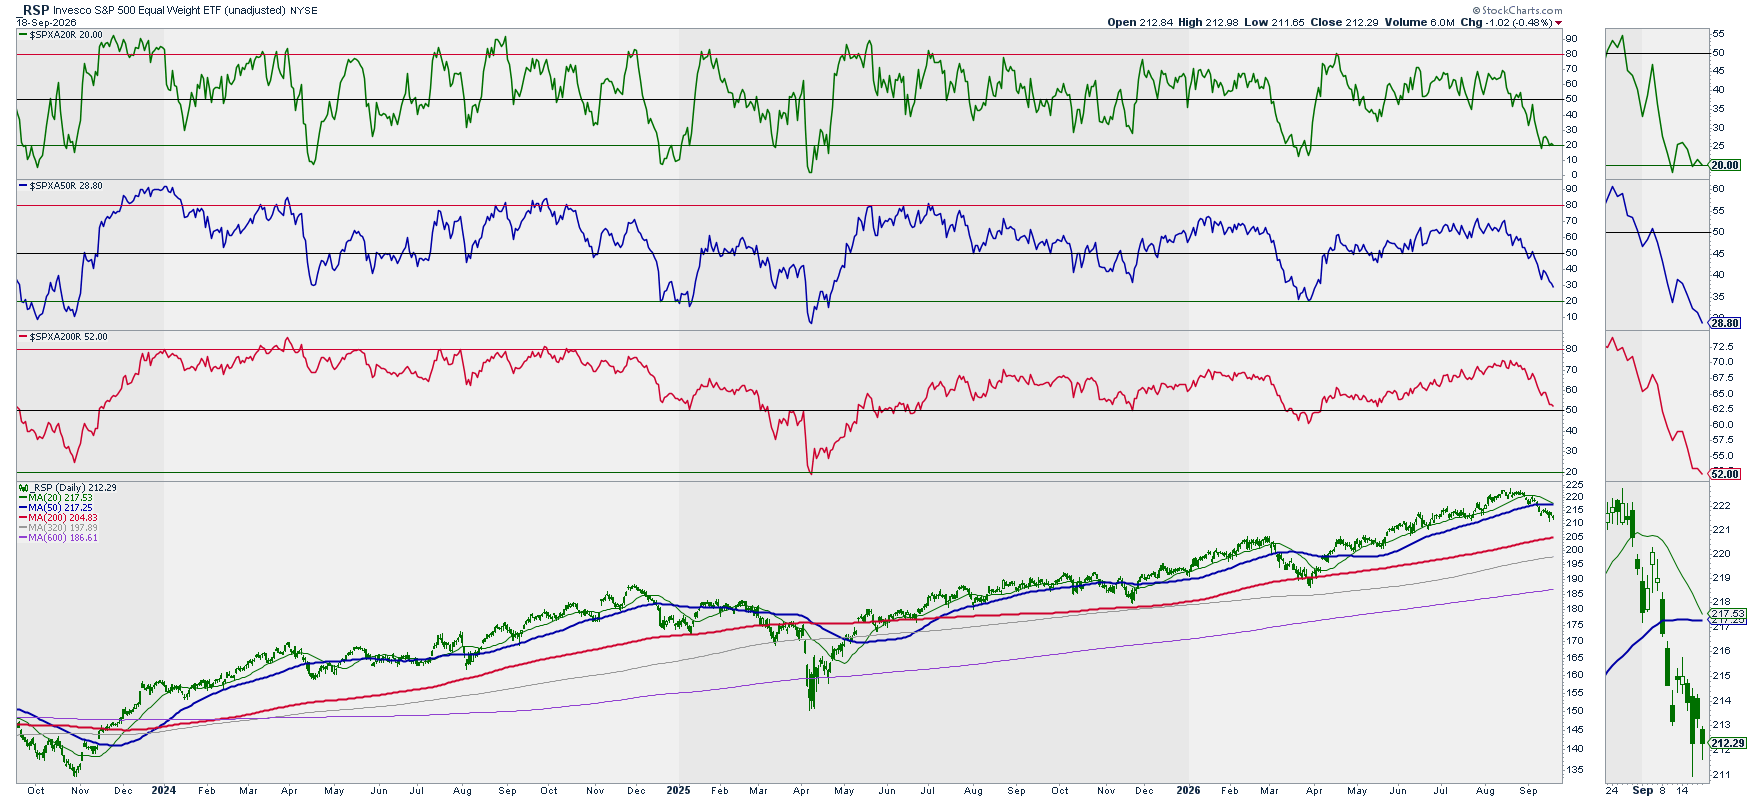
Analysis: % of stocks above their 200D SMAcrossed below the signal line. Both 20D and 50D %s are below the 50% middle line.
ACH: 3
Volatility: Ratio Low Vol. Stocks / SPY vs. RSP & SPY
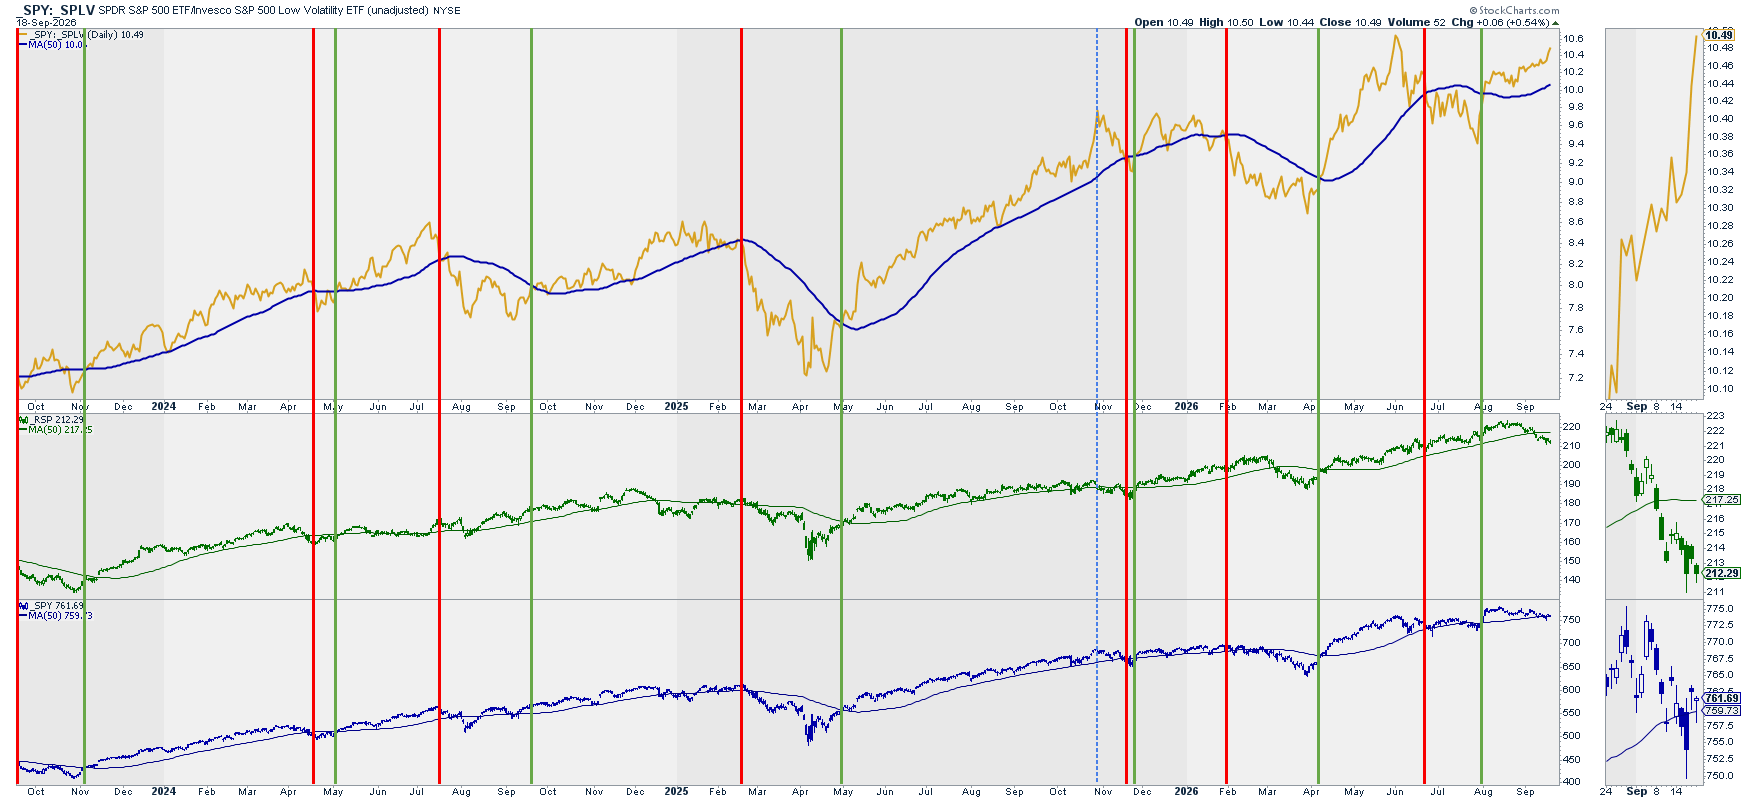
Analysis: Ratio remains above the signal line (50D SMA) and this past week has even increased its upper trend.
Note: This divergence between the volatility signal and RSP and SPY has already occurred before, for example between May and July 2024 or between December 20024 and February 2025. We can interpret with this divergence that the current bearish trend in the markets could increase in case this signal reverses its bullish trend. Until then, we shall see the current drop in the markets as shallow and short-lived.
ACH: 10
Volatility: (Inverted) VIX vs. SPY
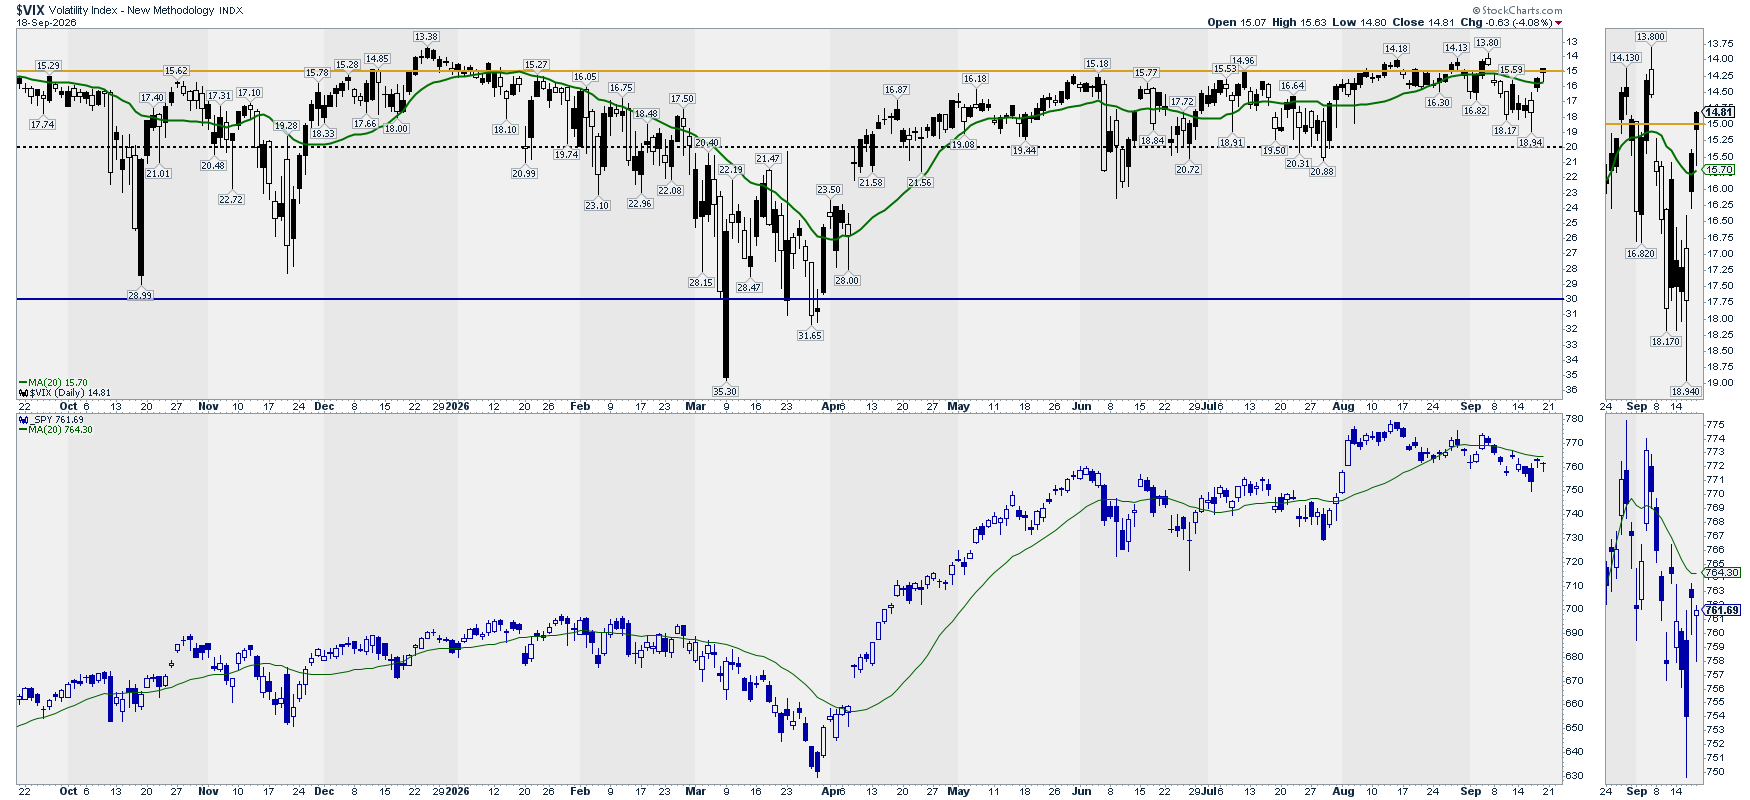
Note: This chart is mainly to detect extreme volatility situations that, once they reverse, offer great long opportunities in the market.
Analysis: Inverted VIX crossed back above the SMA signal line. Low volatility is expected.
ACH: 1
Options: (Inverted) Put/Call Ratio vs. SPY
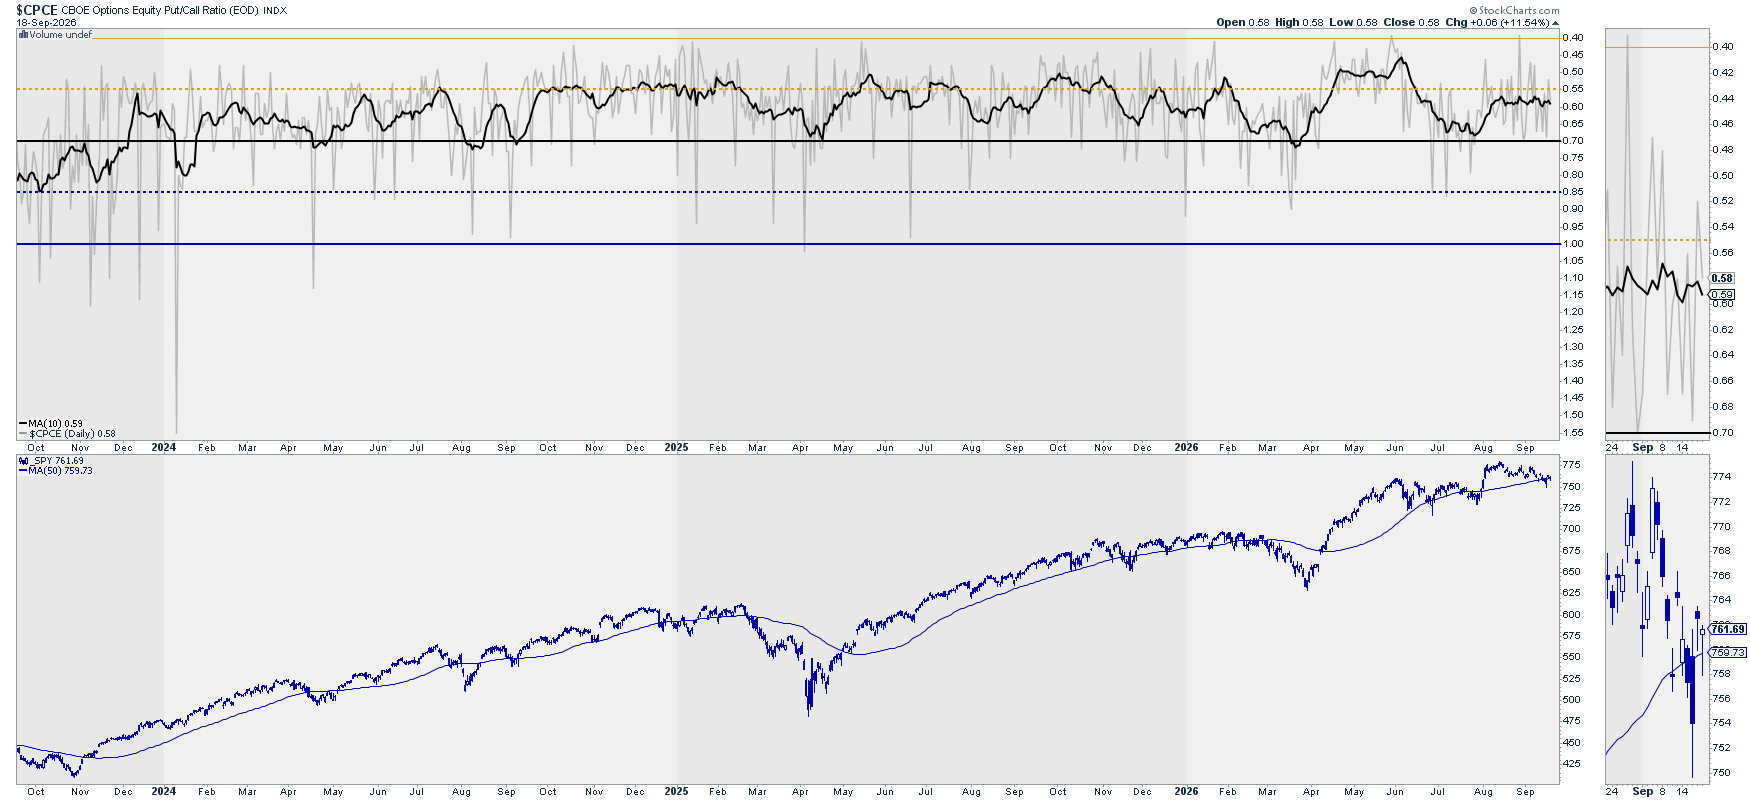
Analysis: Almost no change in P/C ratio compared to last week (and already few weeks in a row with the same situation). I’m setting ACH to 12 due to the flat structure that this signal has taken.
ACH: 12
Options: Gamma Exposure – SPY
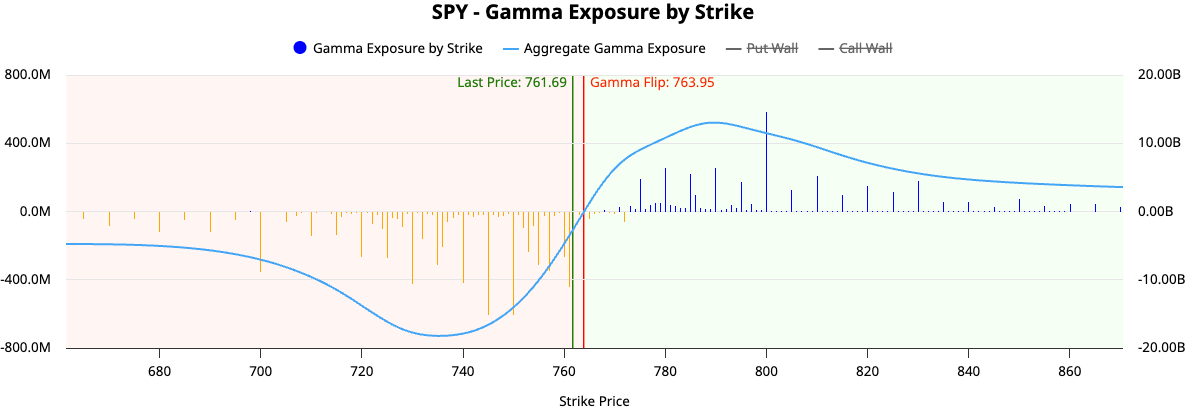
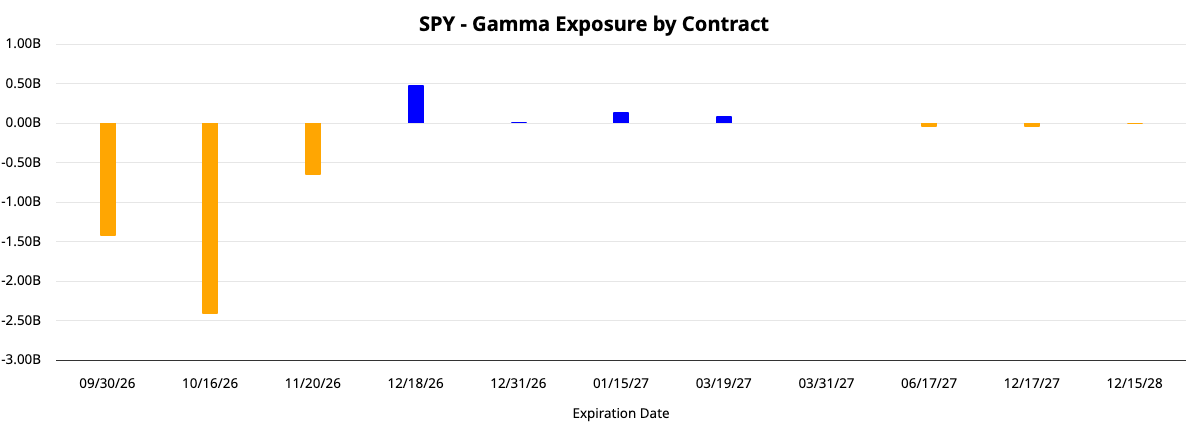
Analysis: Slightly in negative GEX territory. Upper wall moved up to 800.
Upper wall(s): 800
Lower wall(s): 750
Sectors: Where is it happening?
Sectors Rotation
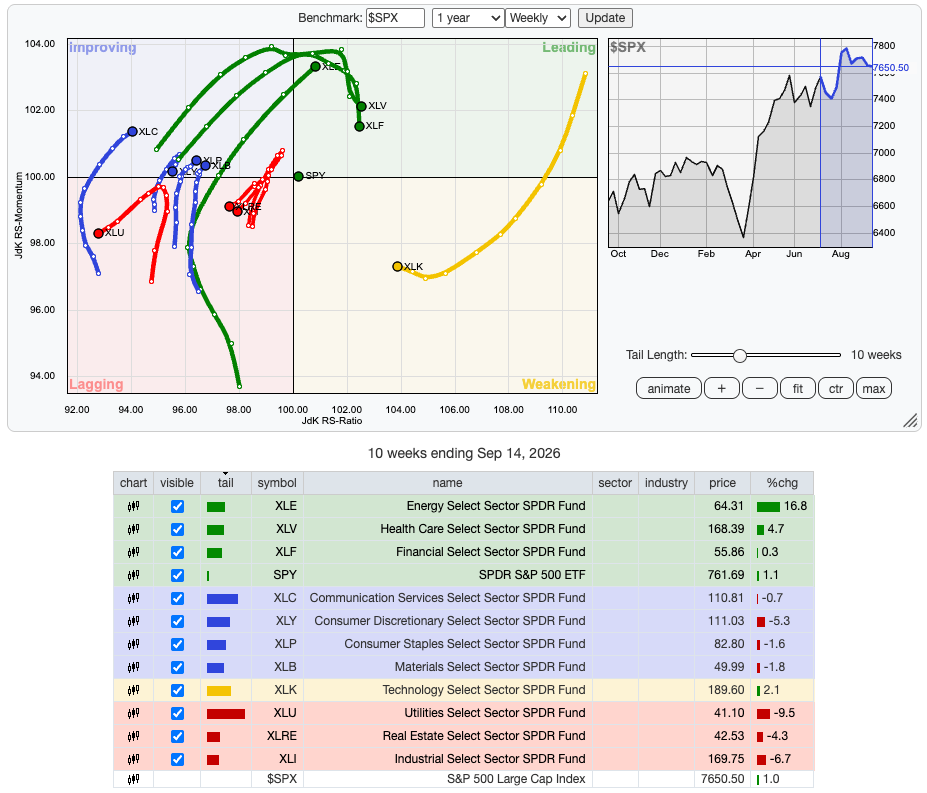
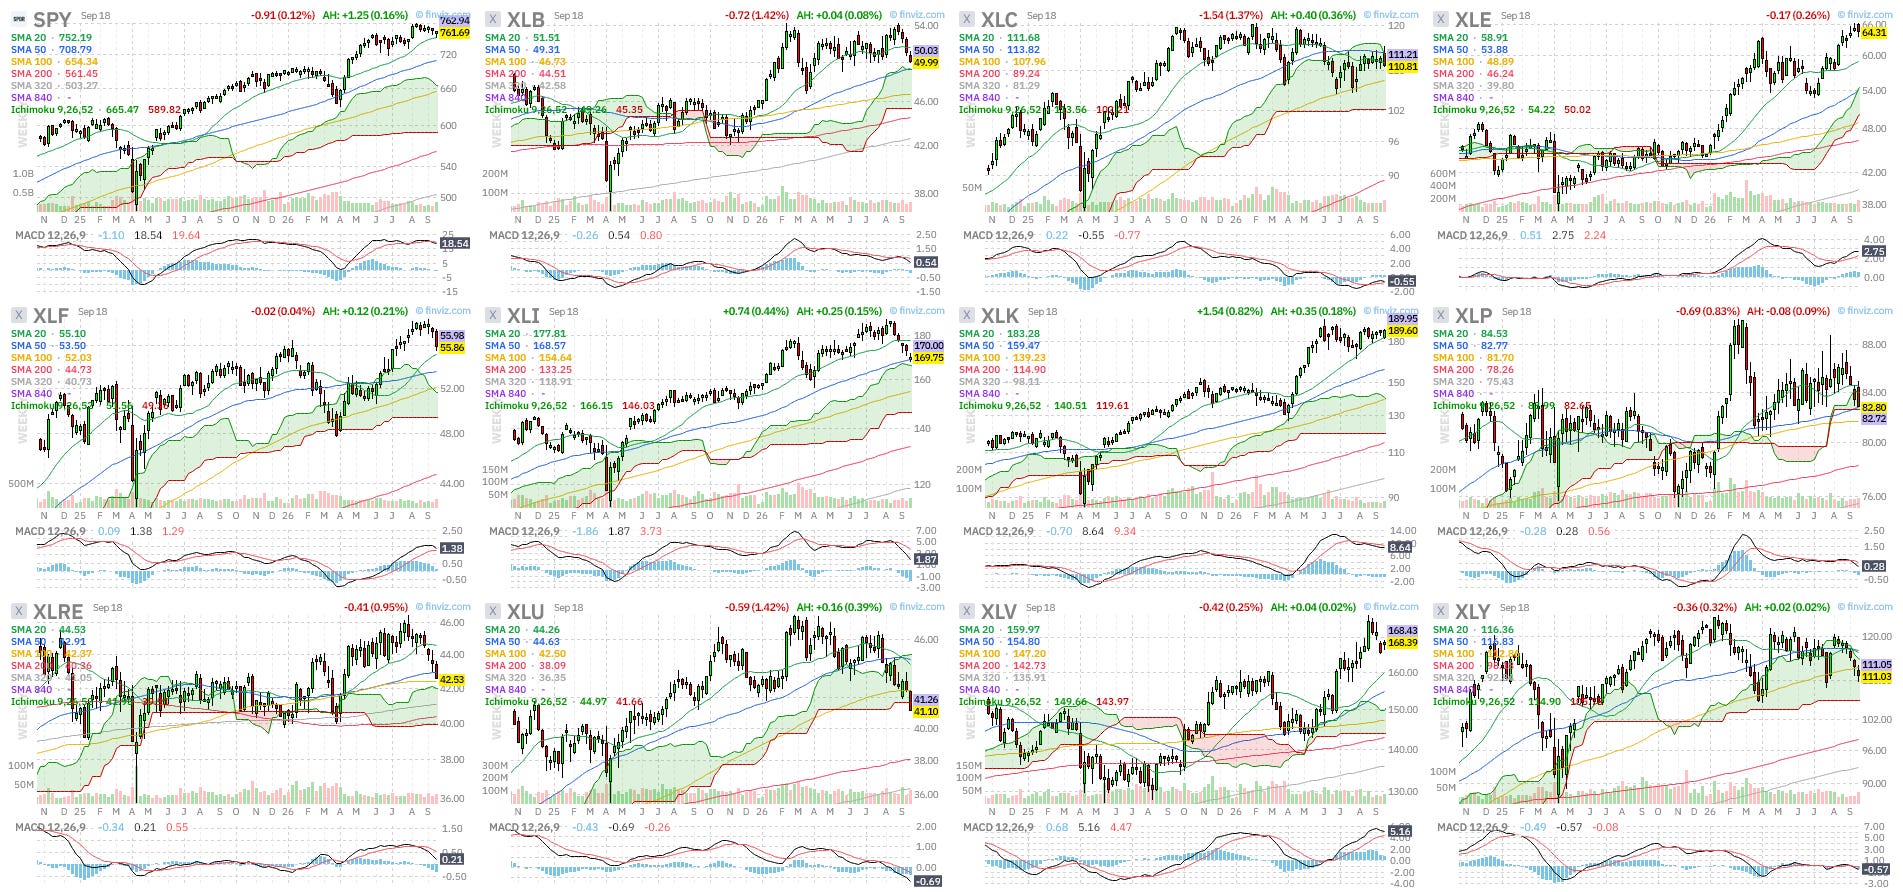
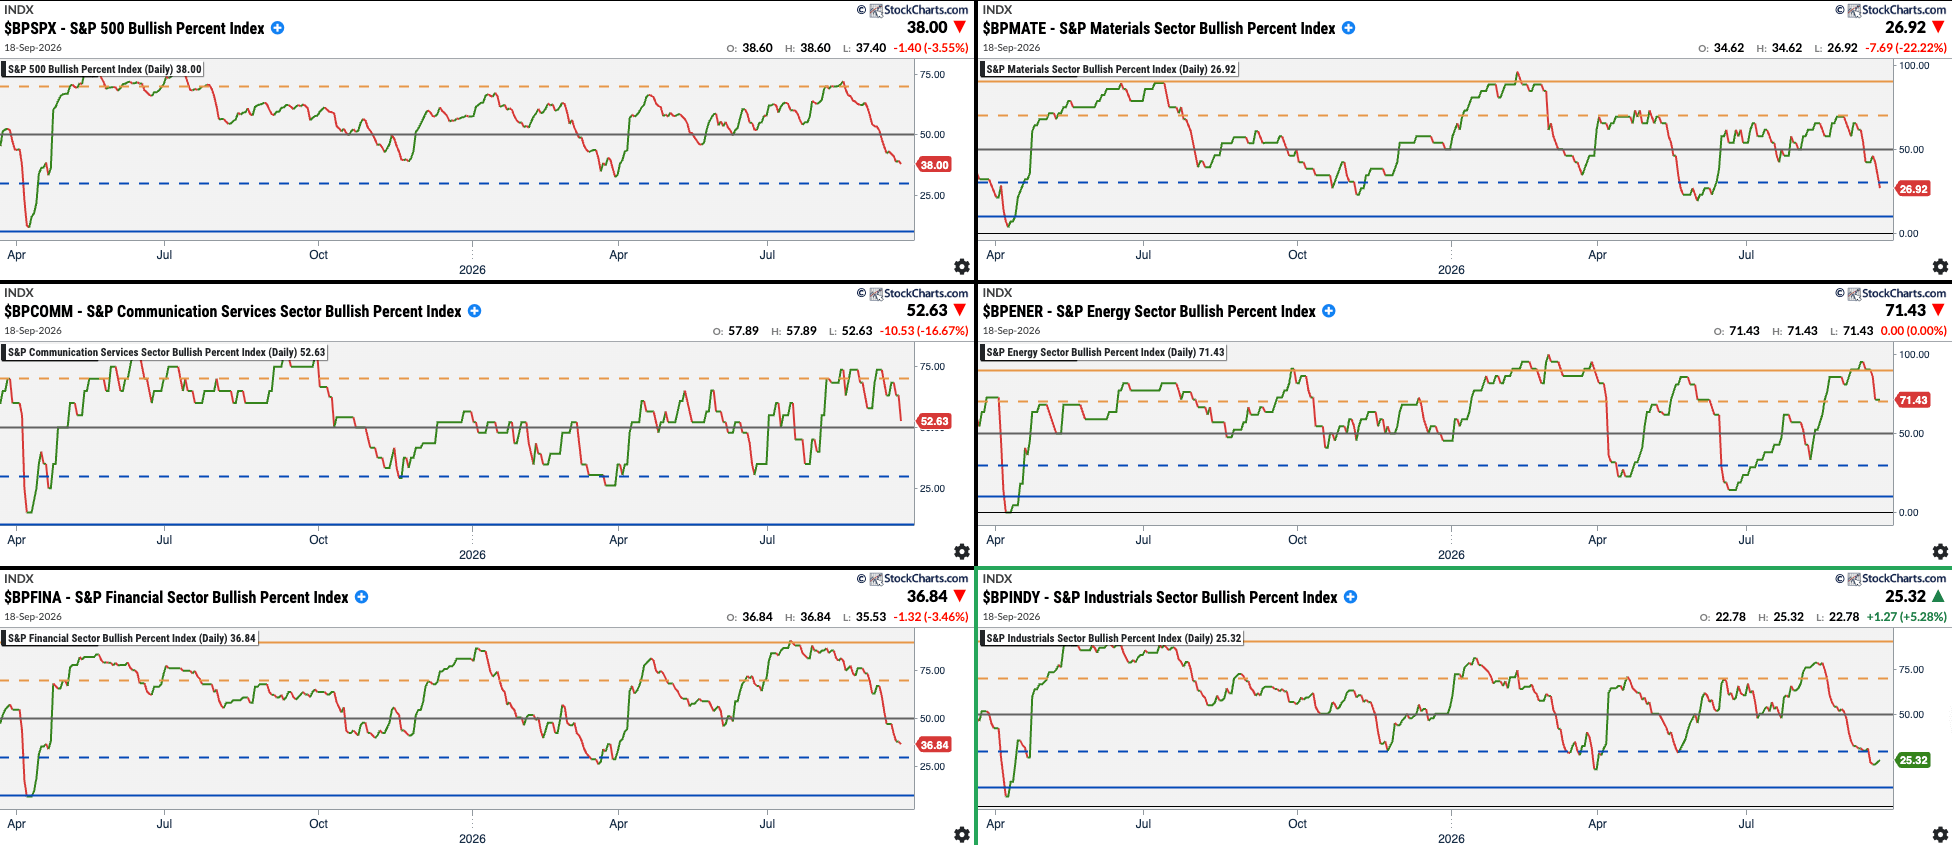
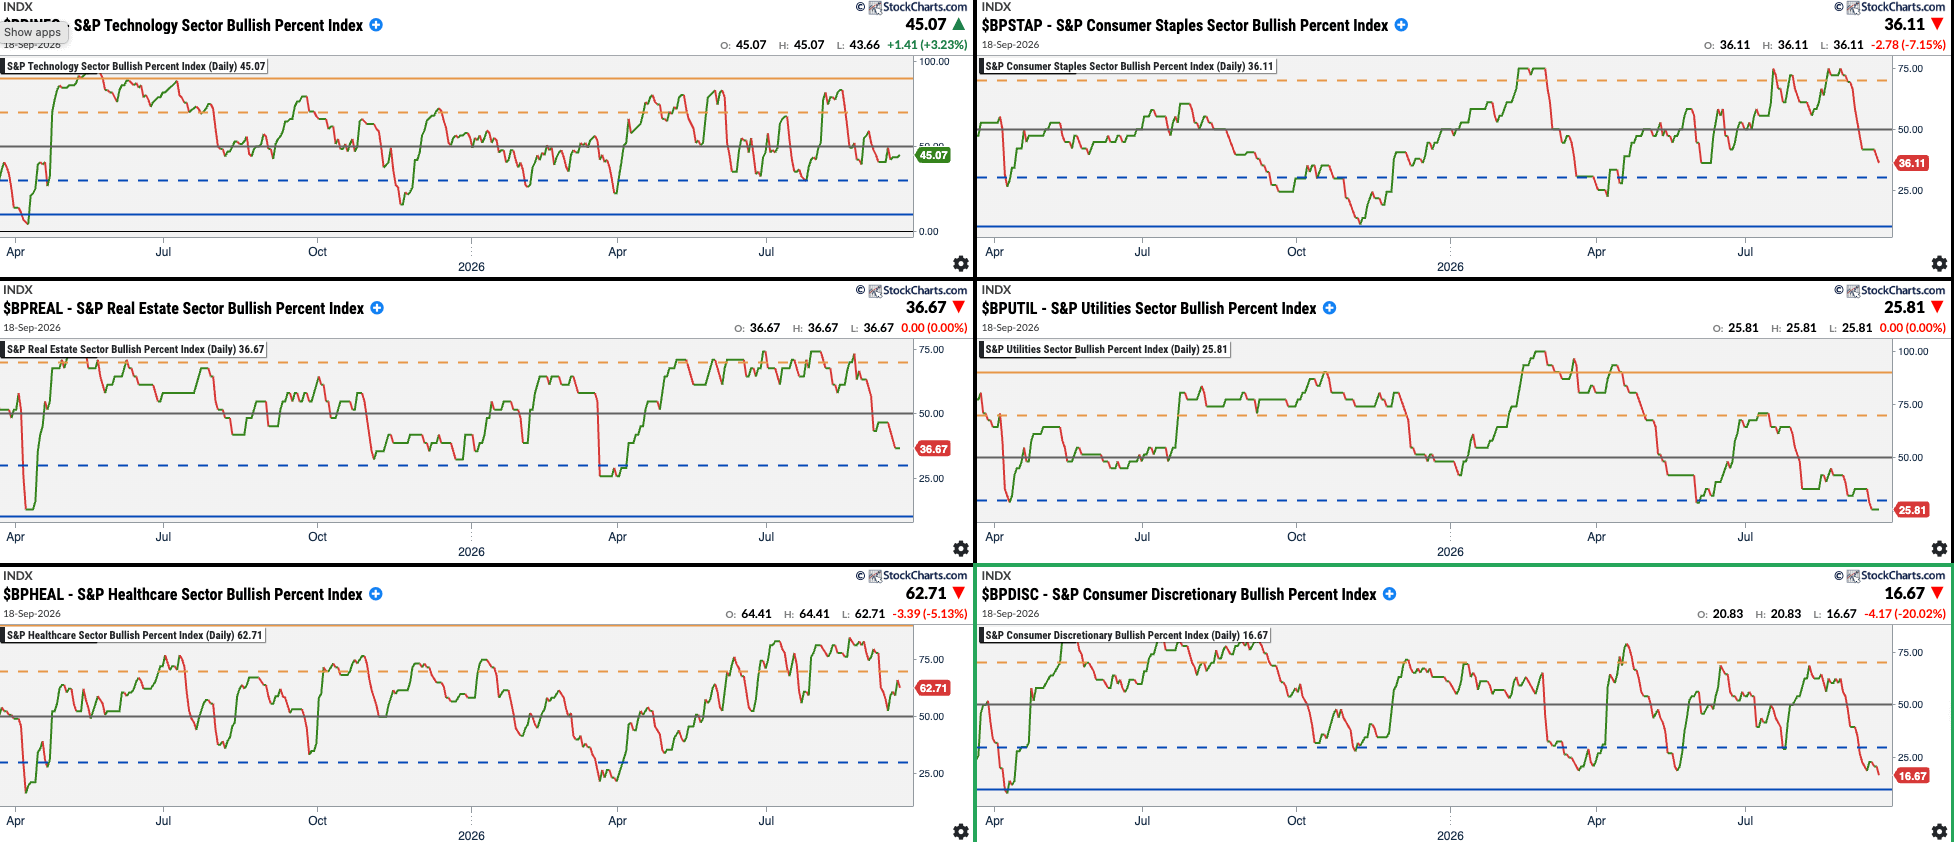
Summary:


AMAT Portfolios
Forever Portfolio

The World of Tomorrow


Last Word

I want to highlight the market action of last Friday (above). This is two days after the Fed hiked rates (Wednesday 2pm). Below, is the 5-minute chart for September 15, 16 (Fed rate day), 17, and Friday 18.
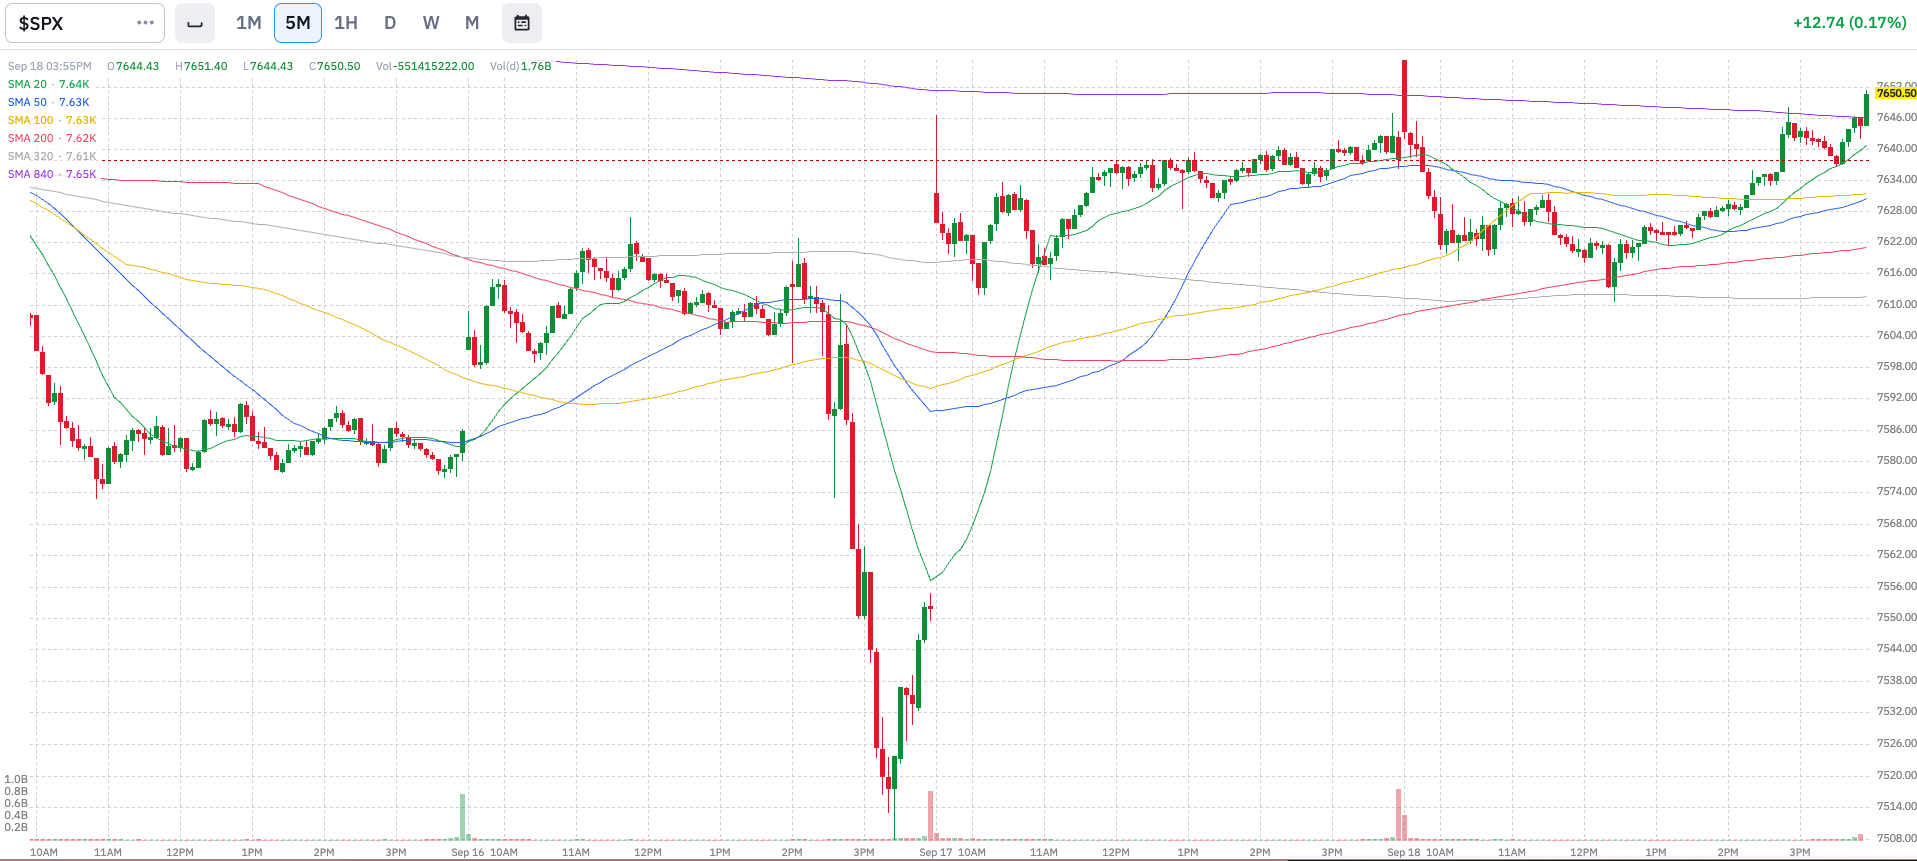
I may be not an expert, but the reaction of the market after the rate hike has been “n’importe quoi”.
Looking at not only the SPY but as well the Nasdaq, Dow Jones, and Russell…

We see how technology welcomed the hike (?) while other industries, and specially mid and small cap. dropped (logical).
Is the Nasdaq sending us a message saying that all is good and that the party continues?
Disclaimer: The content on AMAT Investing is strictly for educational and learning purposes. The author is not a licensed financial advisor and holds no formal financial education. This post does not constitute professional financial advice. All investing involves risk of loss. Always conduct your own research and consult a licensed professional before making any investment decisions.