Context: Why is it happening?
Economic Production: ISM PMI vs. SPX
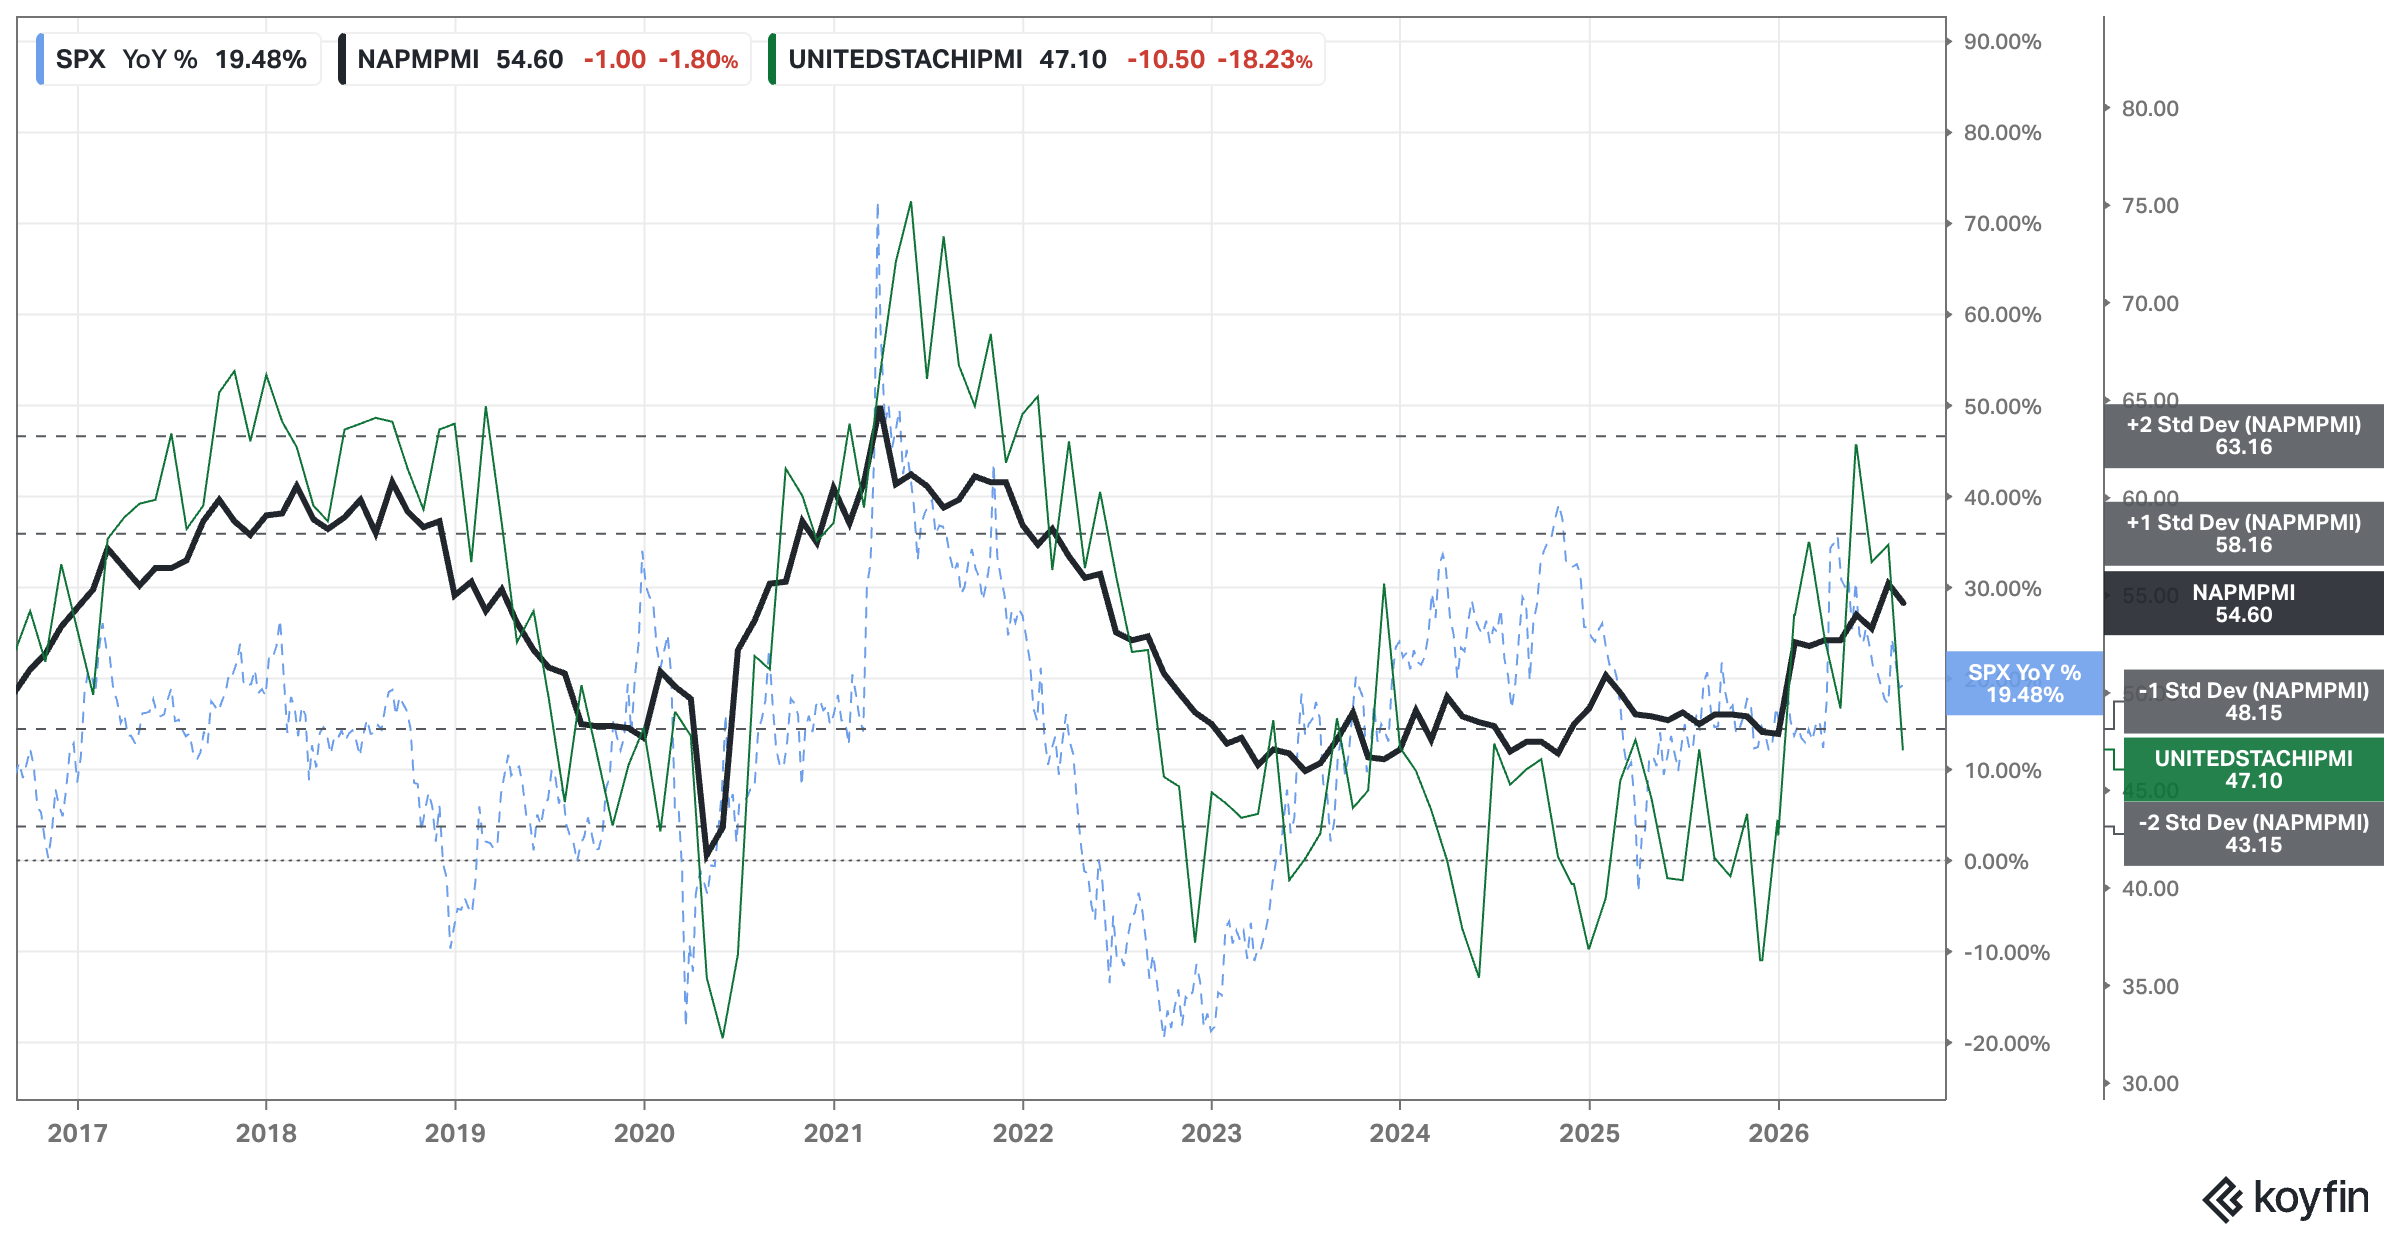
Analysis: No changes since last week.
ACH: 8
Economic Activity: Regional Banks Performance
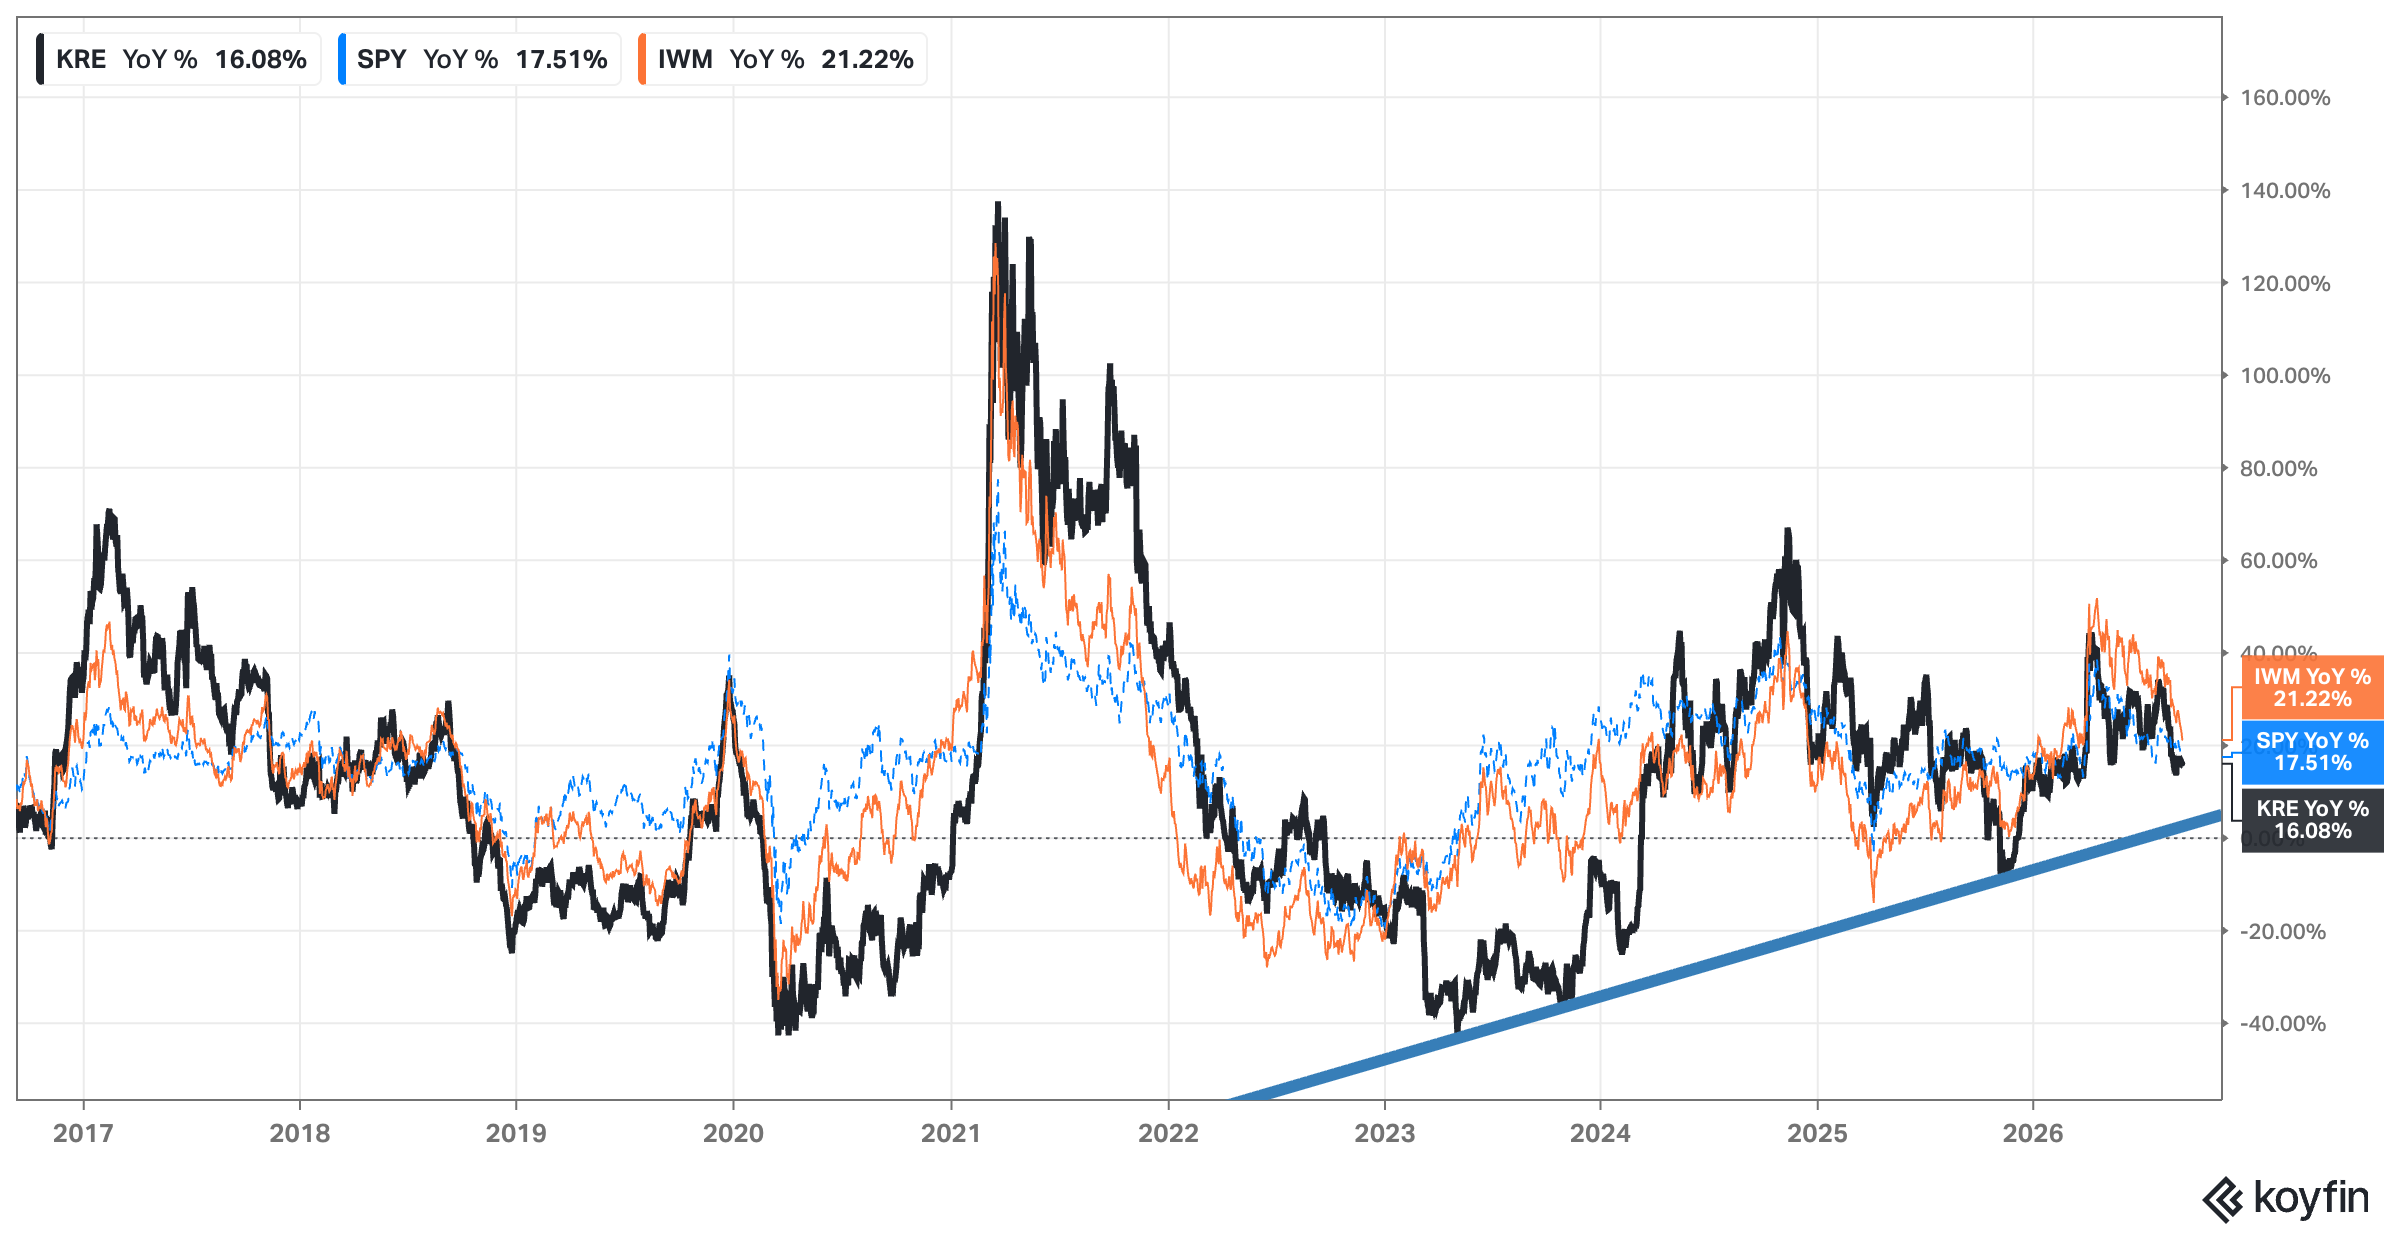
Analysis: No significant changes since last week.
ACH: 7
Interest Rates: FED, 2yr, 10yr, and 30yr Rates
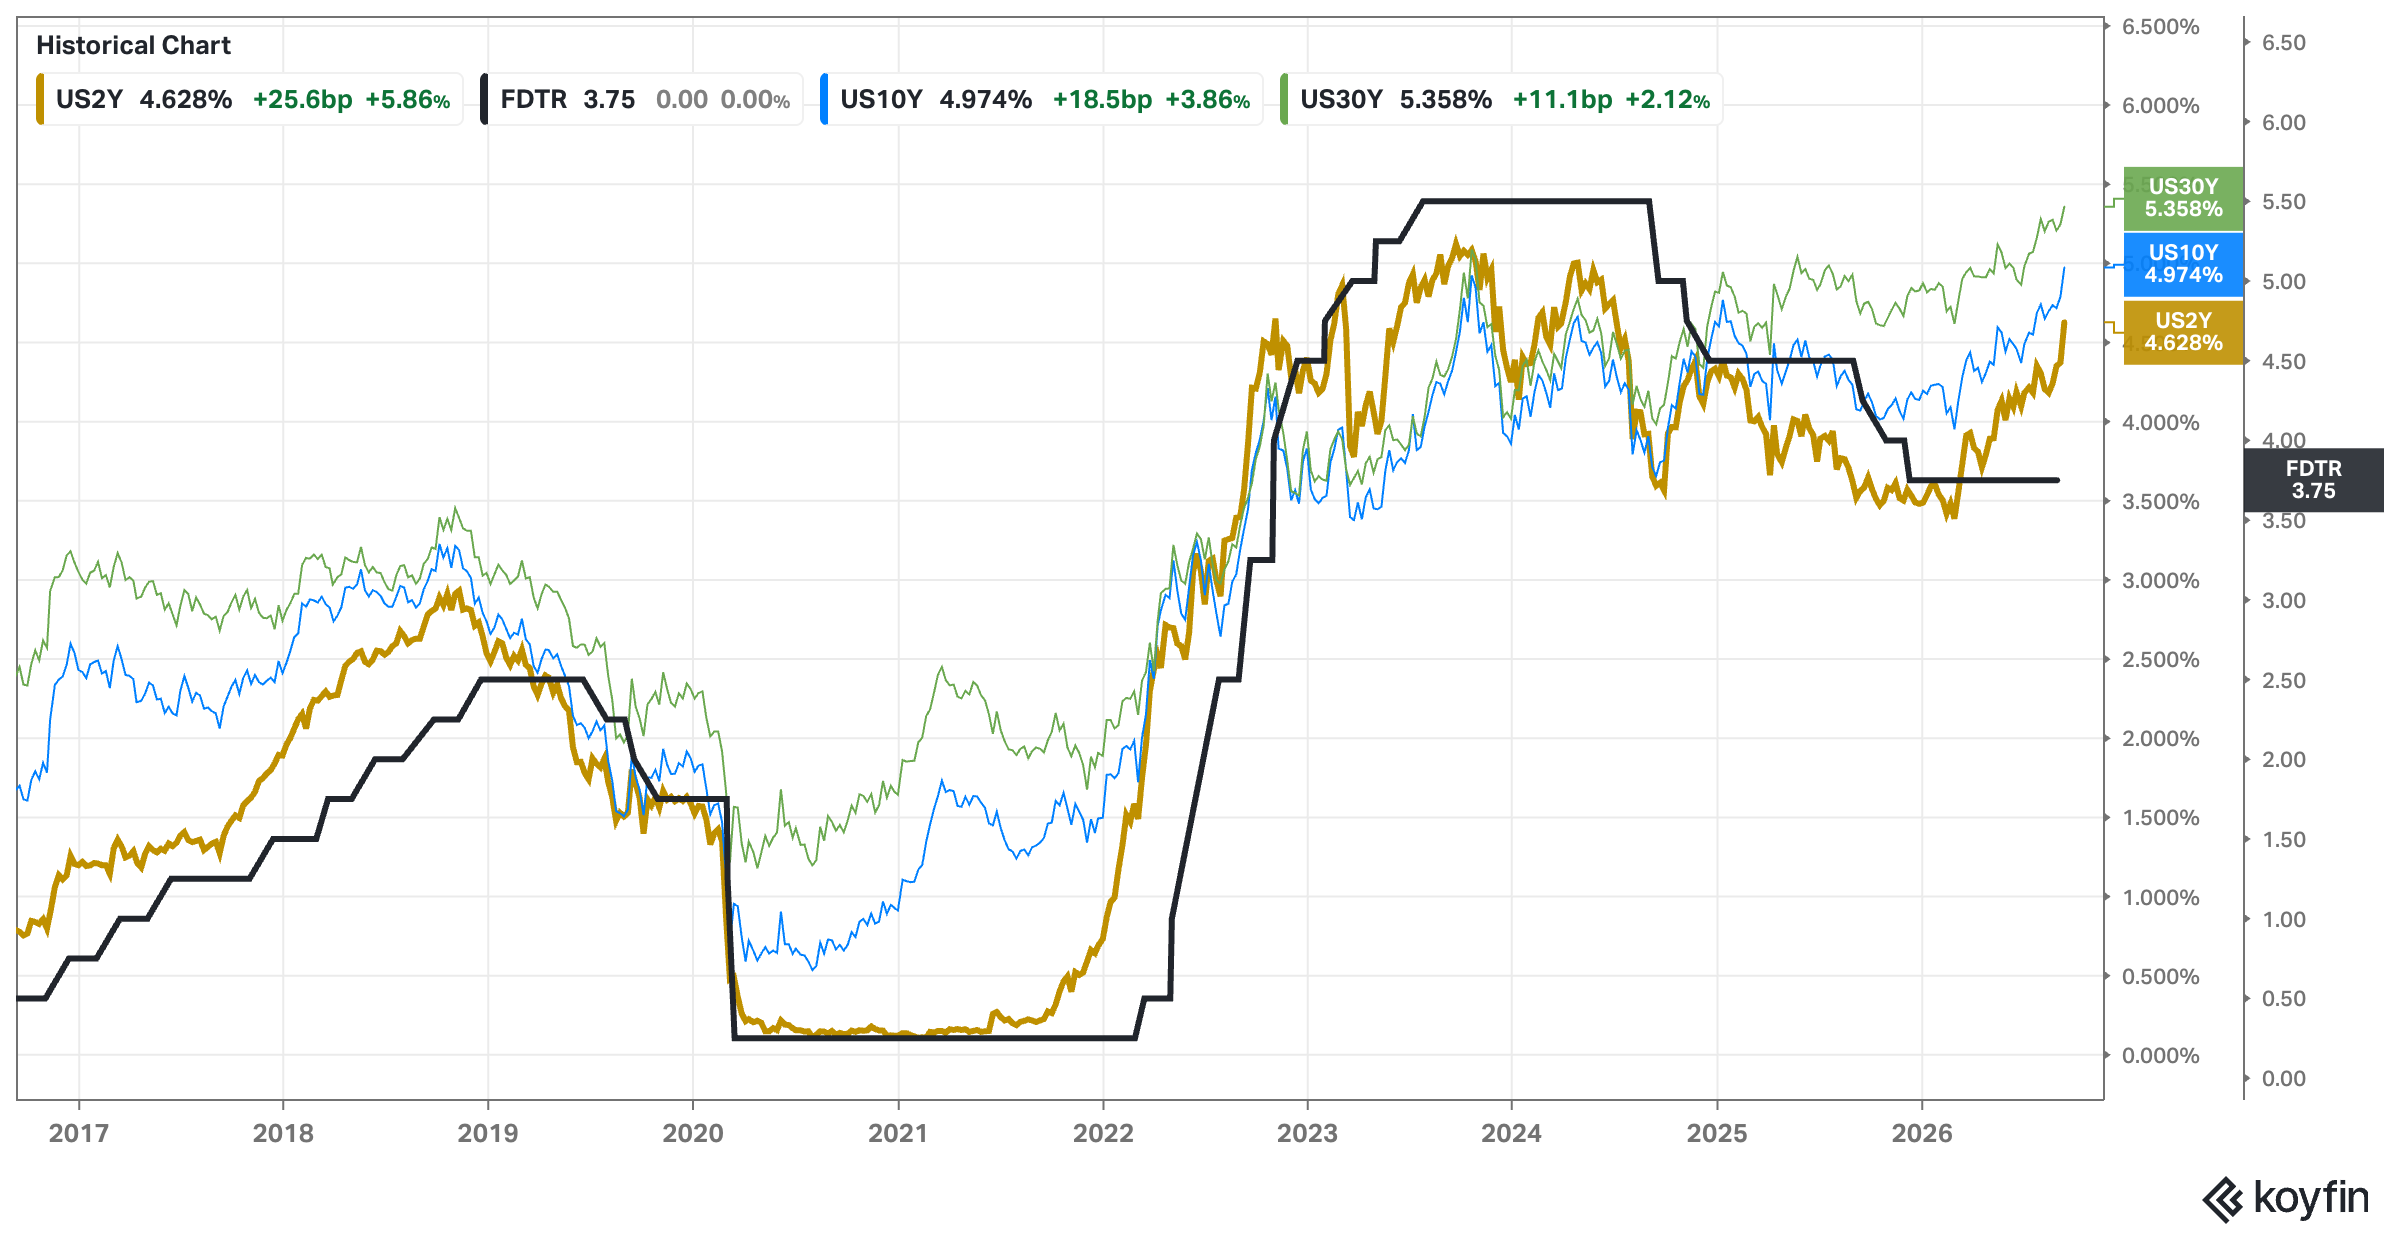
Analysis: Good job numbers meant bad news for rates with a sharp increase. PPI YoY came to a hot 5.4%, core PPI YoY printed 4.6%, and core inflation YoY stayed at 2.4%.
Note: The U.S. Bureau of Economic Analysis (BEA) has introduced a major methodological revamp to its Personal Consumption Expenditures (PCE) price index formula, slated to officially take effect and appear in the comprehensive data revision on September 30, 2026. The modifications will apply retroactively to historical data going back to 2021. Wall Street and independent economists estimate that these formula adjustments will shave roughly 0.1 to 0.3 percentage points off recent Core PCE inflation readings. Prior to the adjustment, July core PCE inflation was holding at 3.3%. The mathematical shift downward is drawing heavy scrutiny from market participants, as a lower structural inflation readout could grant the Federal Reserve more flexibility in upcoming interest rate policy decisions. Source: https://www.wsj.com/economy/central-banking/pce-inflation-data-updates-ca7bfd61
Due to this change in the favorite’s Fed inflation indicator, I’m expecting rates to stay unchanged until the new PCE numbers are released.
ACH (inverted color): 11
Indexes: What is happening?
TA: Price Action, Trend, Momentum & Volume:
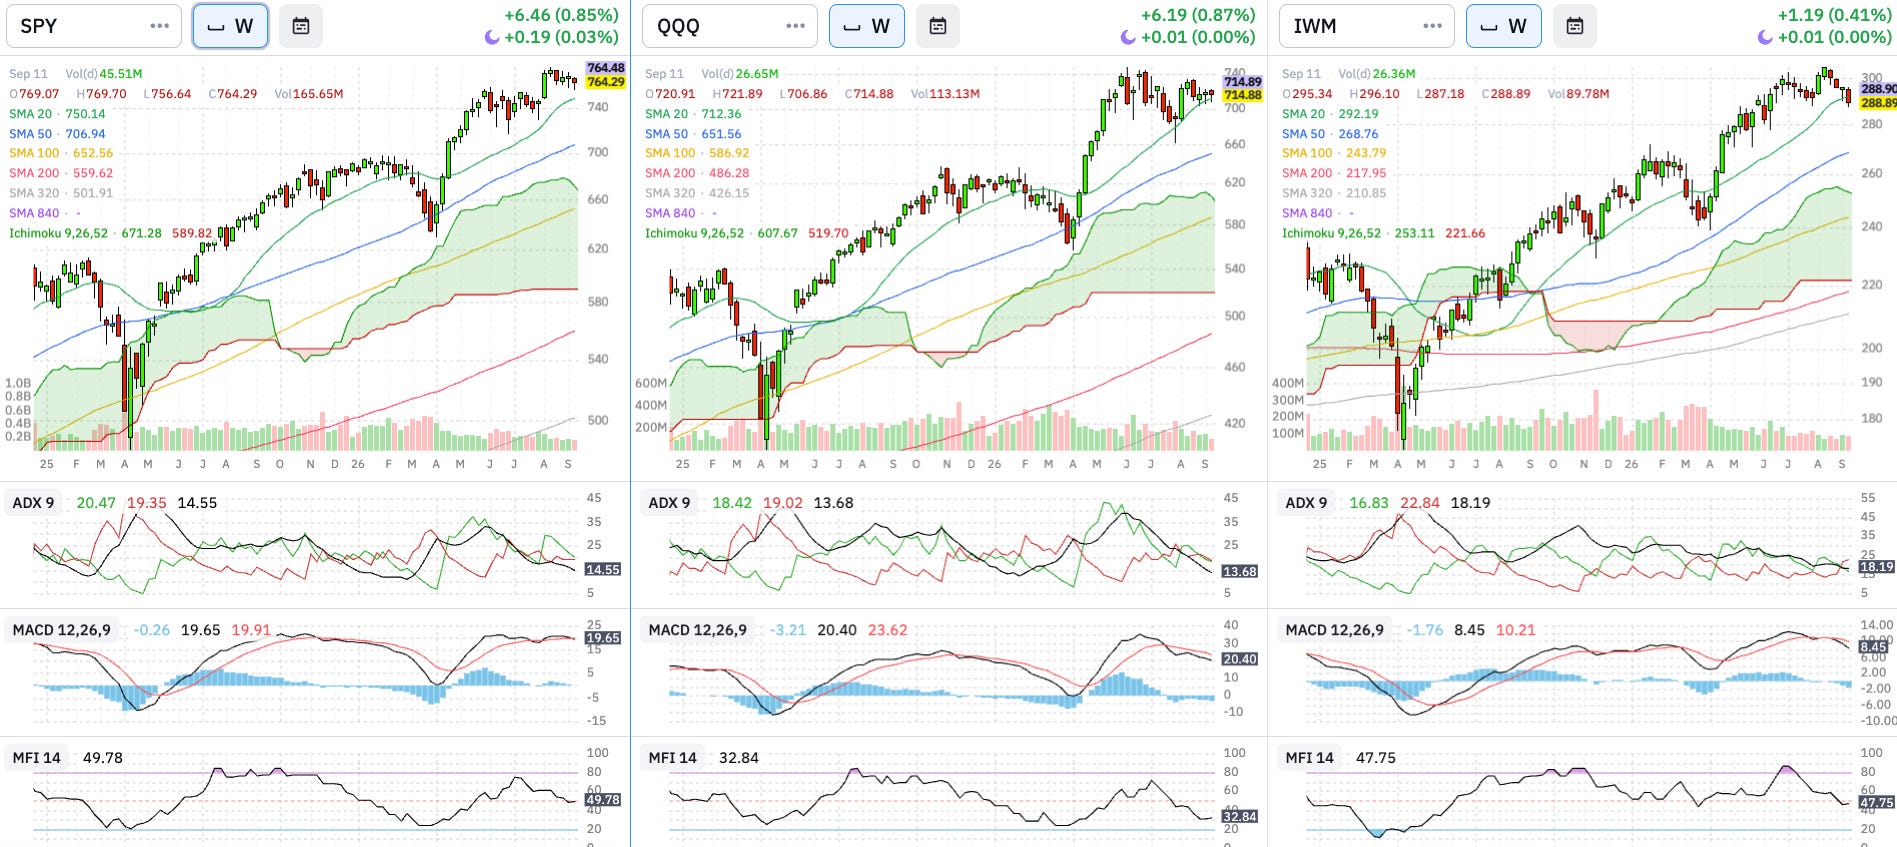
Weekly & Daily SPY, QQQ, and IWM
Technical Analysis:
Price (SMAs & Cloud): Weekly: SPY is trending lower towards its 20W SMA, QQQ found support at the same level, and IWM broke below it. Daily: SPY is bouncing betwee 20D and 50D SMAs, while QQQ is bounding between the 20D, 50D, and 100D SMAs. IWM broke below the 100D SMA. ACH: 2
Trend (ADX): Weekly: ADX weak and trend-less for SPY and QQQ, while bearish trend starts to dominate in IWM. Daily: ADX for SPY and QQQ is very weak and IWM is in a strong bearish trend. ACH: 2
Momentum (MACD): Weekly: All markets are rolling over their distribution phase into a downturn. Daily: All in bearish divergences. ACH: 3
Volume (MFI): Weekly: All indices have bearish divergences. Daily: SPY, QQQ, and IWM have no clear signals with a flat MFI. ACH: 3
Breadth: % Stocks above SMAs
Above 200 Daily SMA
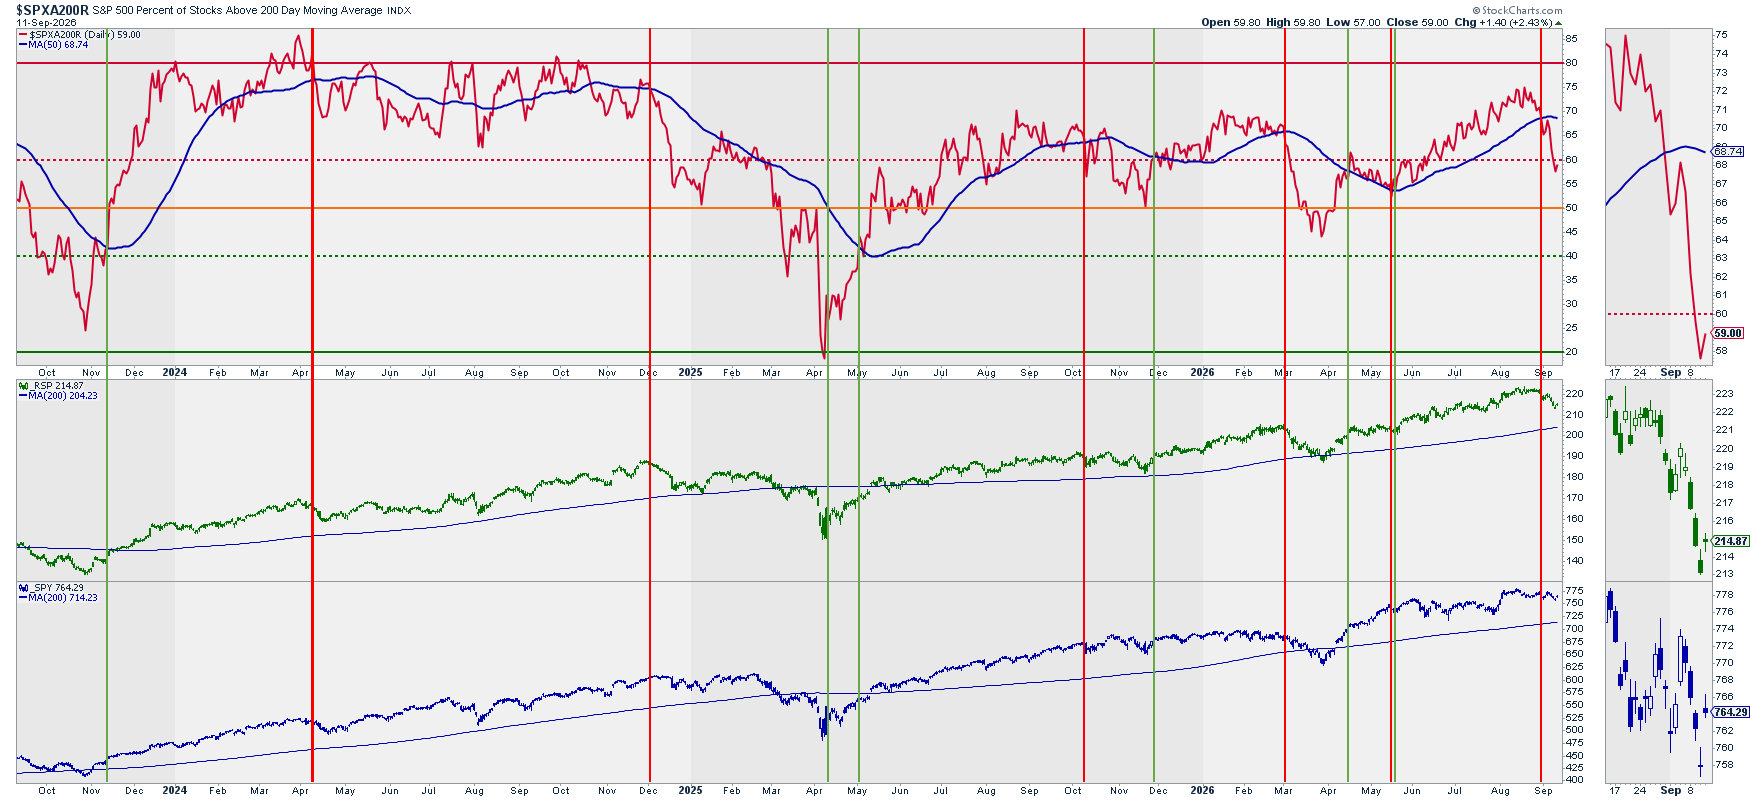
Above 20, 50, and 200 Daily SMAs vs. RSP
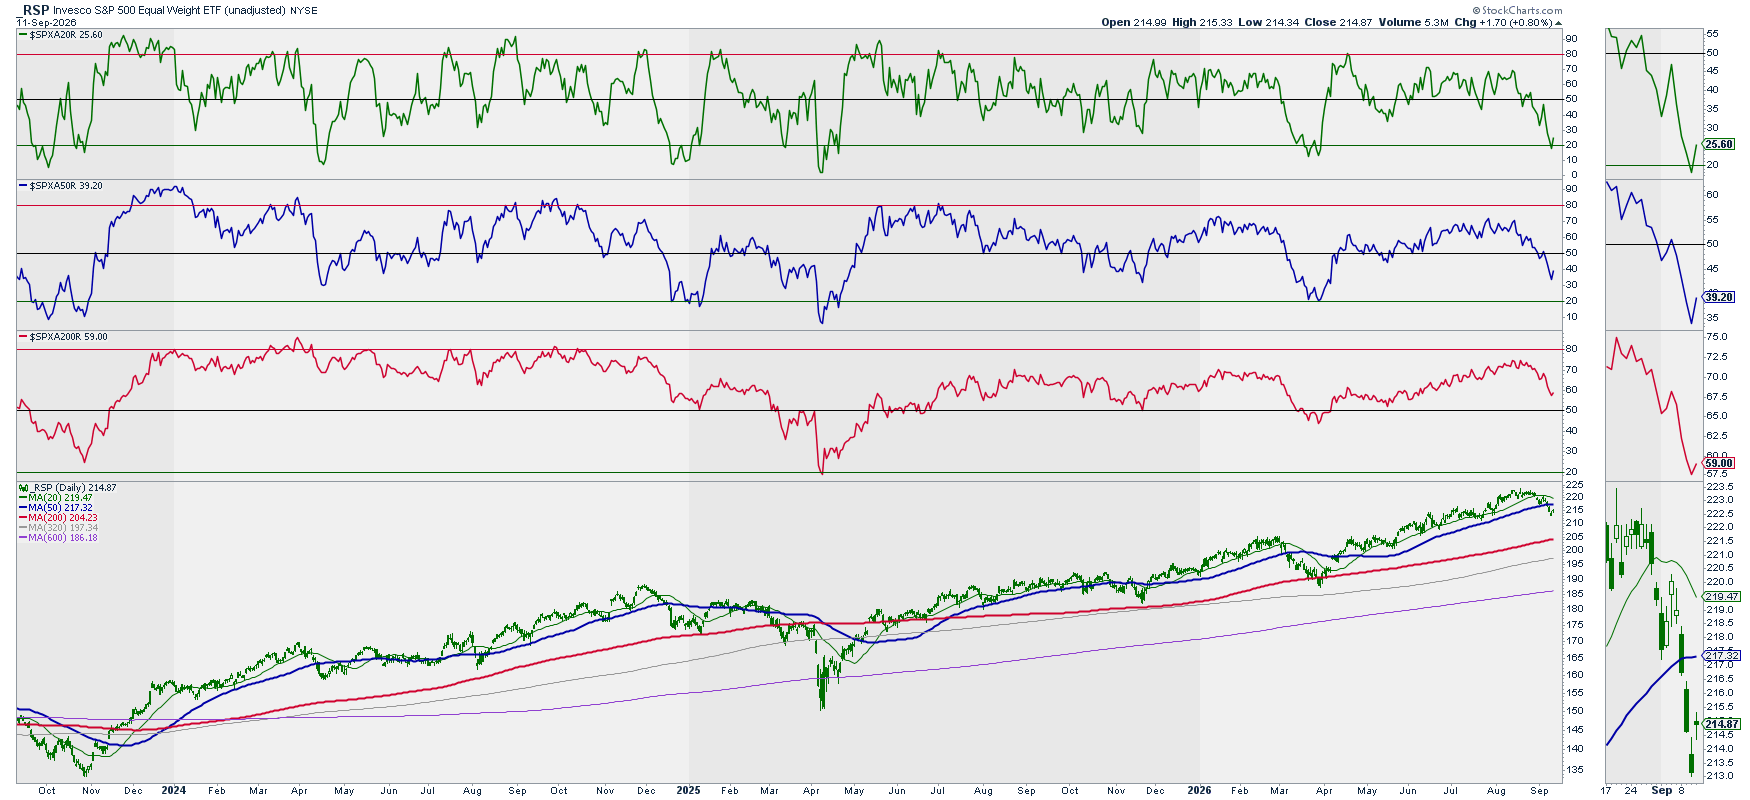
Analysis: % of stocks above their 200D SMAcrossed below the signal line. Both 20D and 50D %s are below the 50% middle line.
ACH: 3
Volatility: Ratio Low Vol. Stocks / SPY vs. RSP & SPY
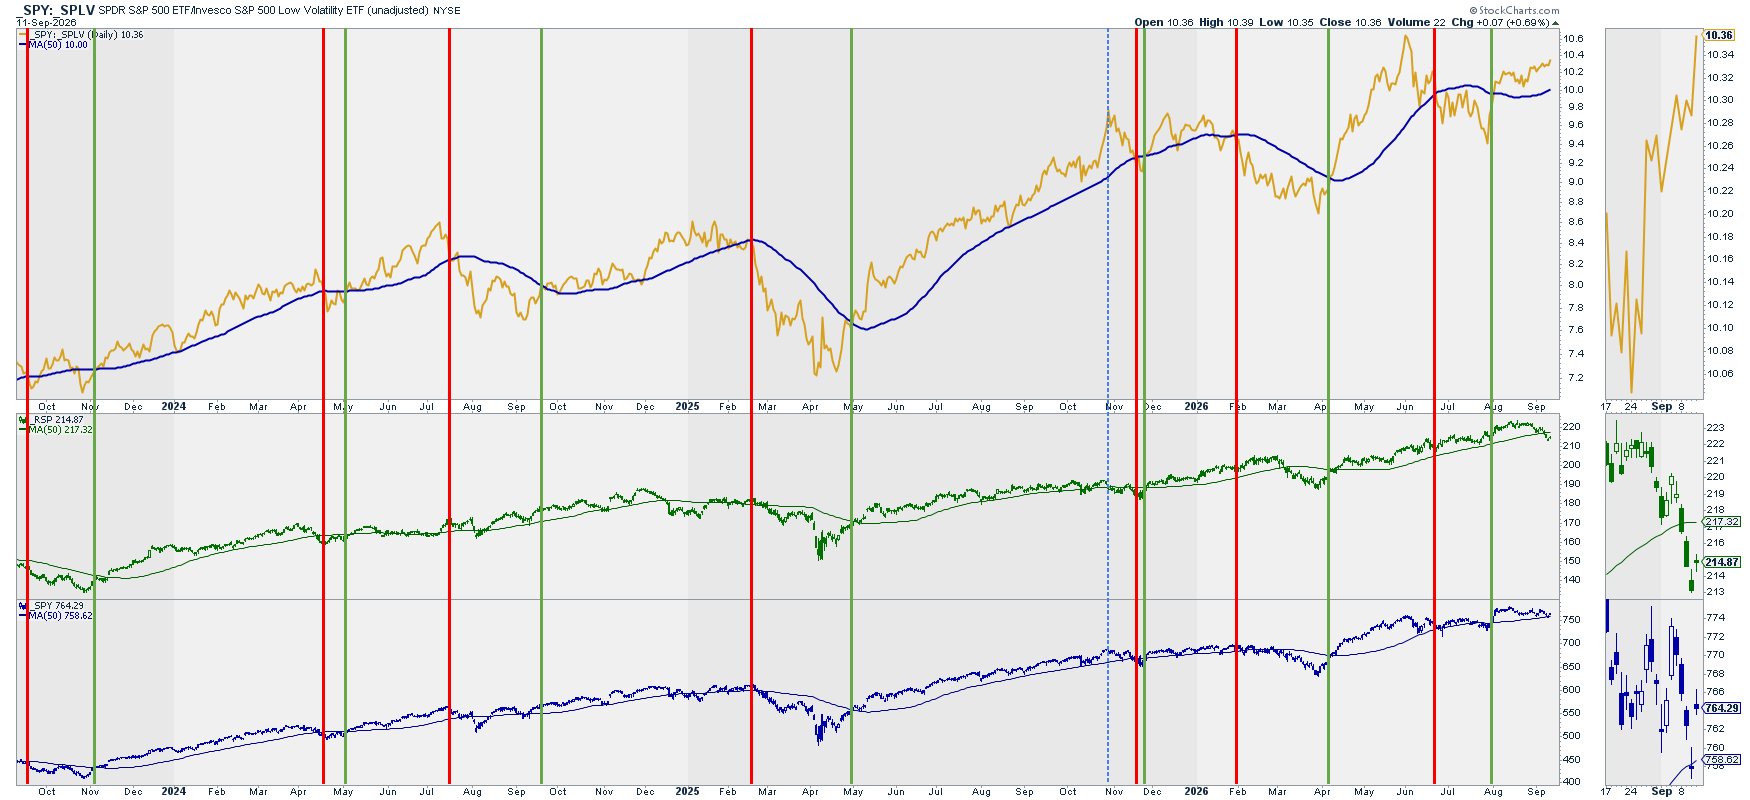
Analysis: Ratio remains above the signal line (50D SMA) and this past week has even increased its upper trend.
Note: This divergence between the volatility signal and RSP and SPY has already occurred before, for example between May and July 2024 or between December 20024 and February 2025. We can interpret with this divergence that the current bearish trend in the markets could increase in case this signal reverses its bullish trend. Until then, we shall see the current drop in the markets as shallow and short-lived.
ACH: 10
Volatility: (Inverted) VIX vs. SPY
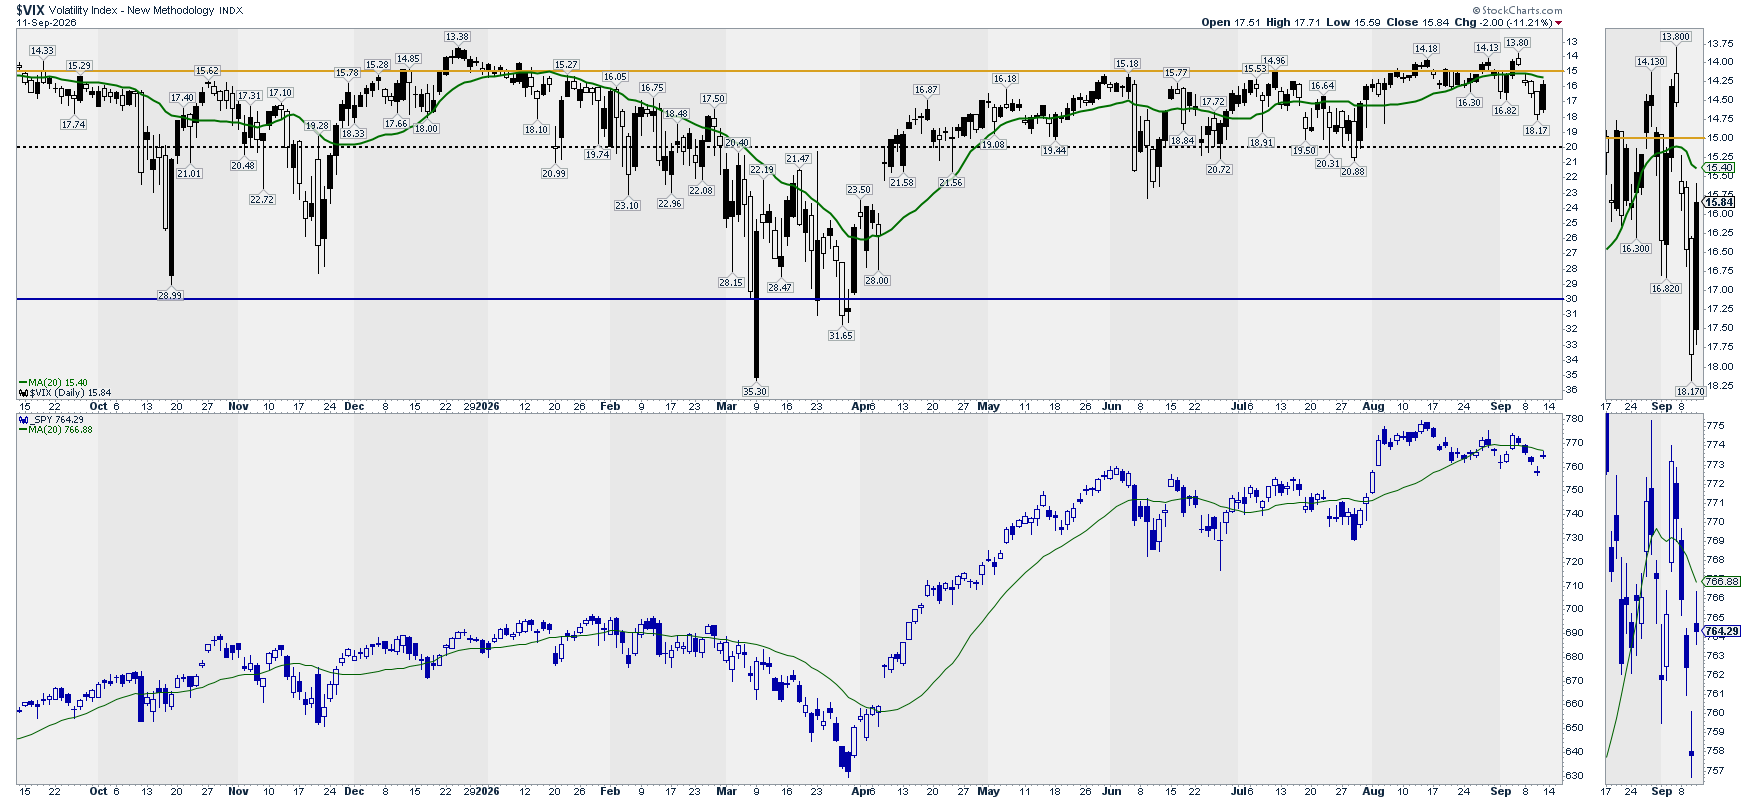
Note: This chart is mainly to detect extreme volatility situations that, once they reverse, offer great long opportunities in the market.
Analysis: Inverted VIX crossed below its moving average and may signal the start of a volatility increase. I’m setting the ACH to 1 from the previous value of 12.
ACH: 1
Options: (Inverted) Put/Call Ratio vs. SPY
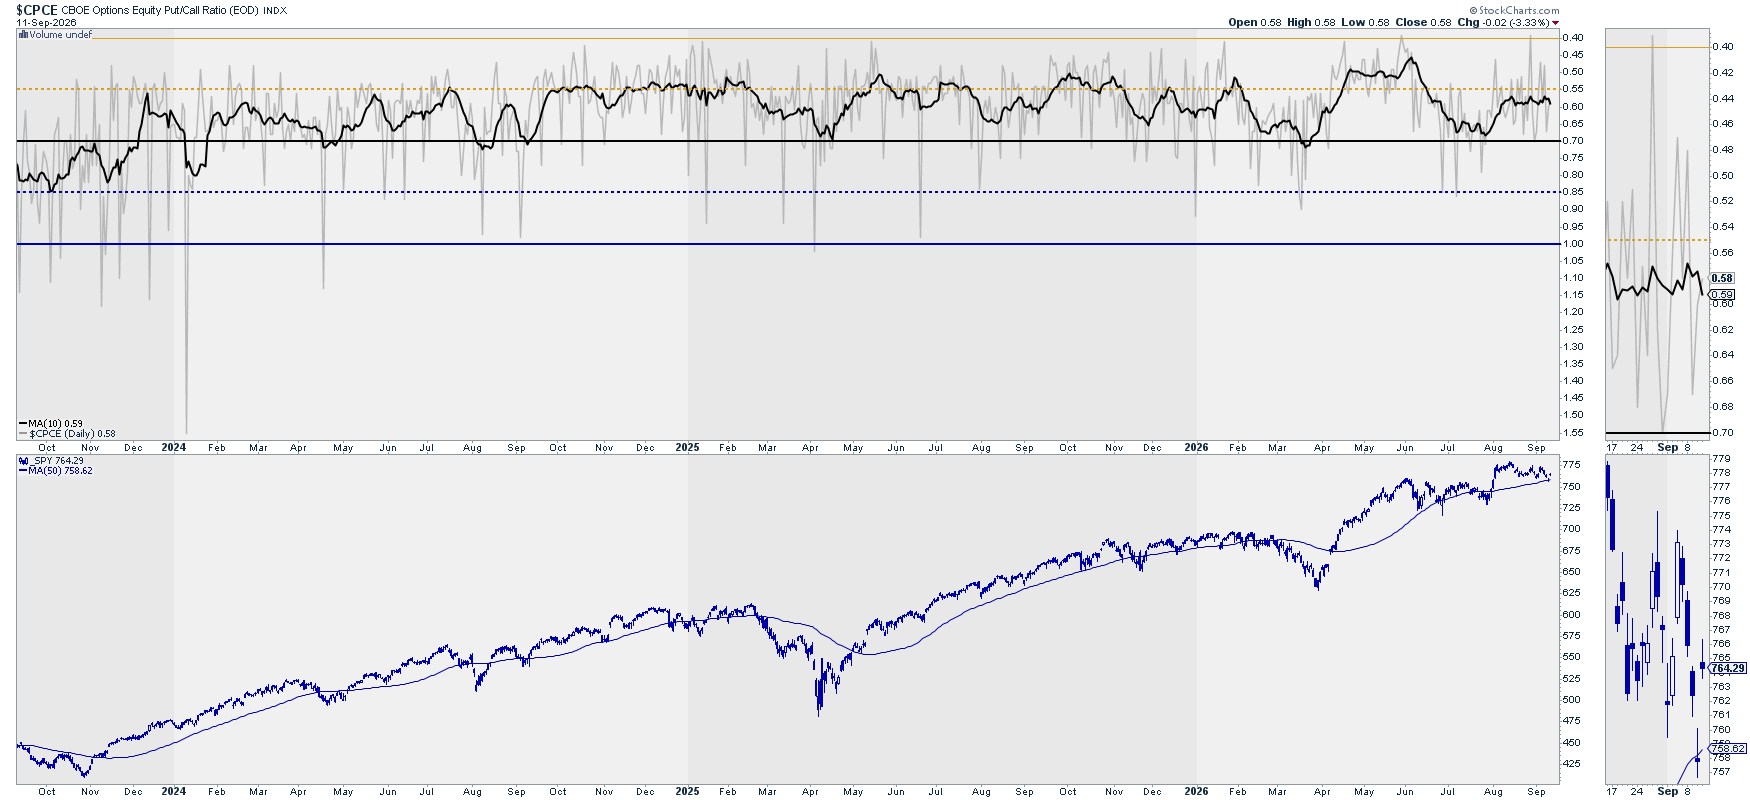
Analysis: Almost no change in P/C ratio compared to last week.
ACH: 11
Options: Gamma Exposure – SPY
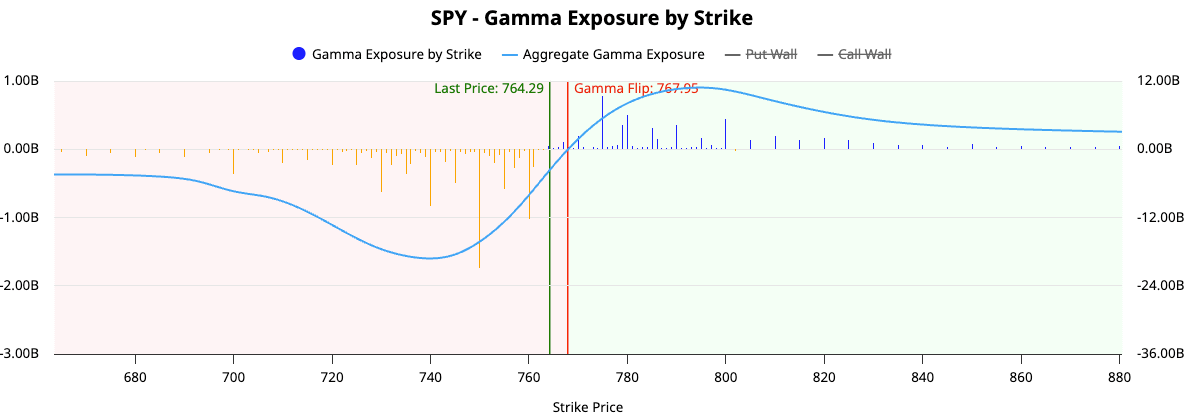
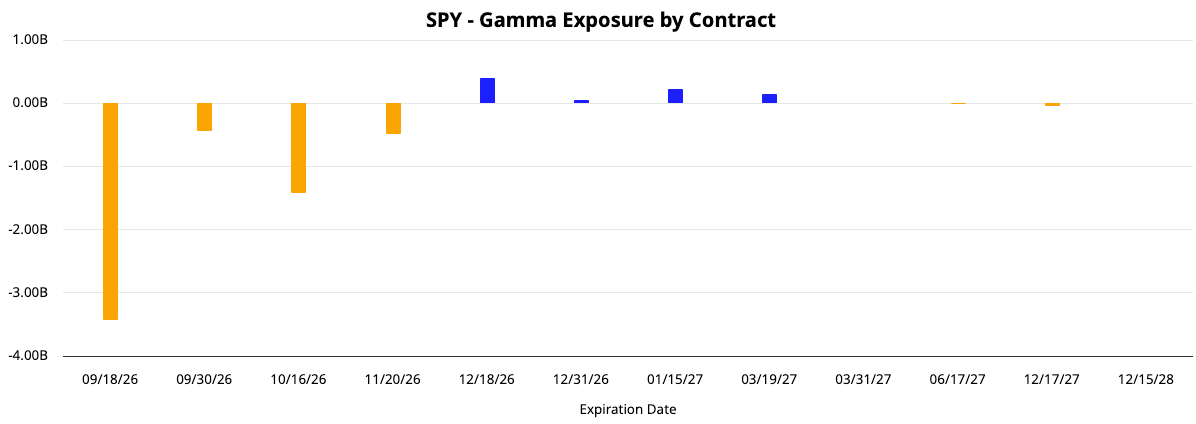
Analysis: Negative GEX for the rest of the year with a strong GEX for next opex Friday. Upper and lower GEX walls moved downwards.
Upper wall(s): 775
Lower wall(s): 750
Sectors: Where is it happening?
Sectors Rotation
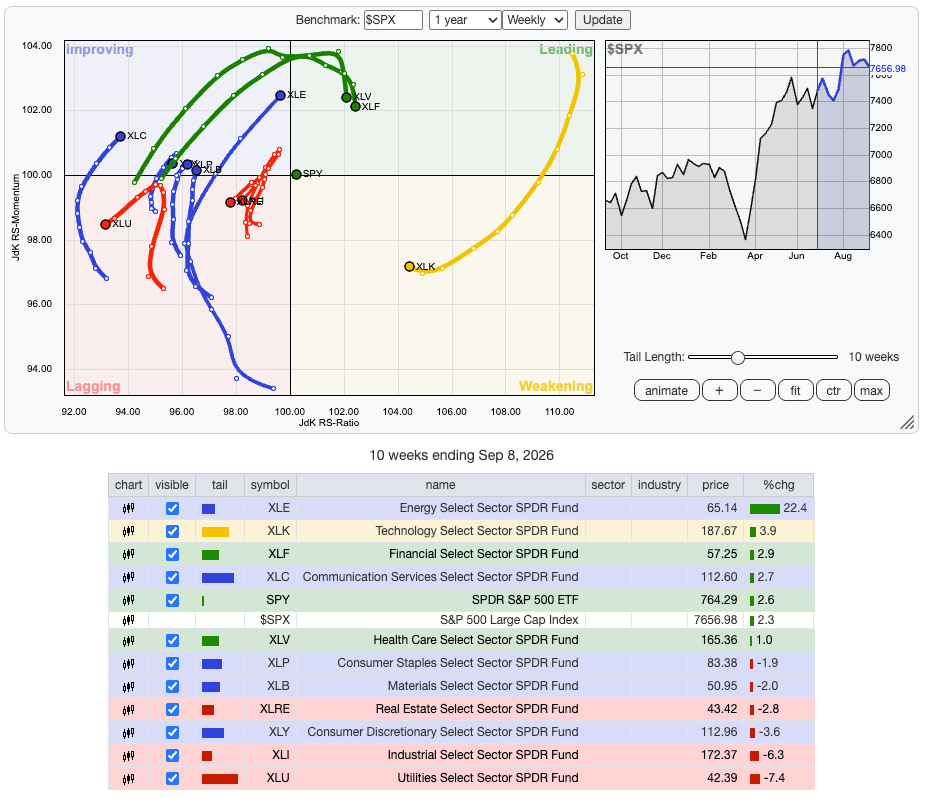
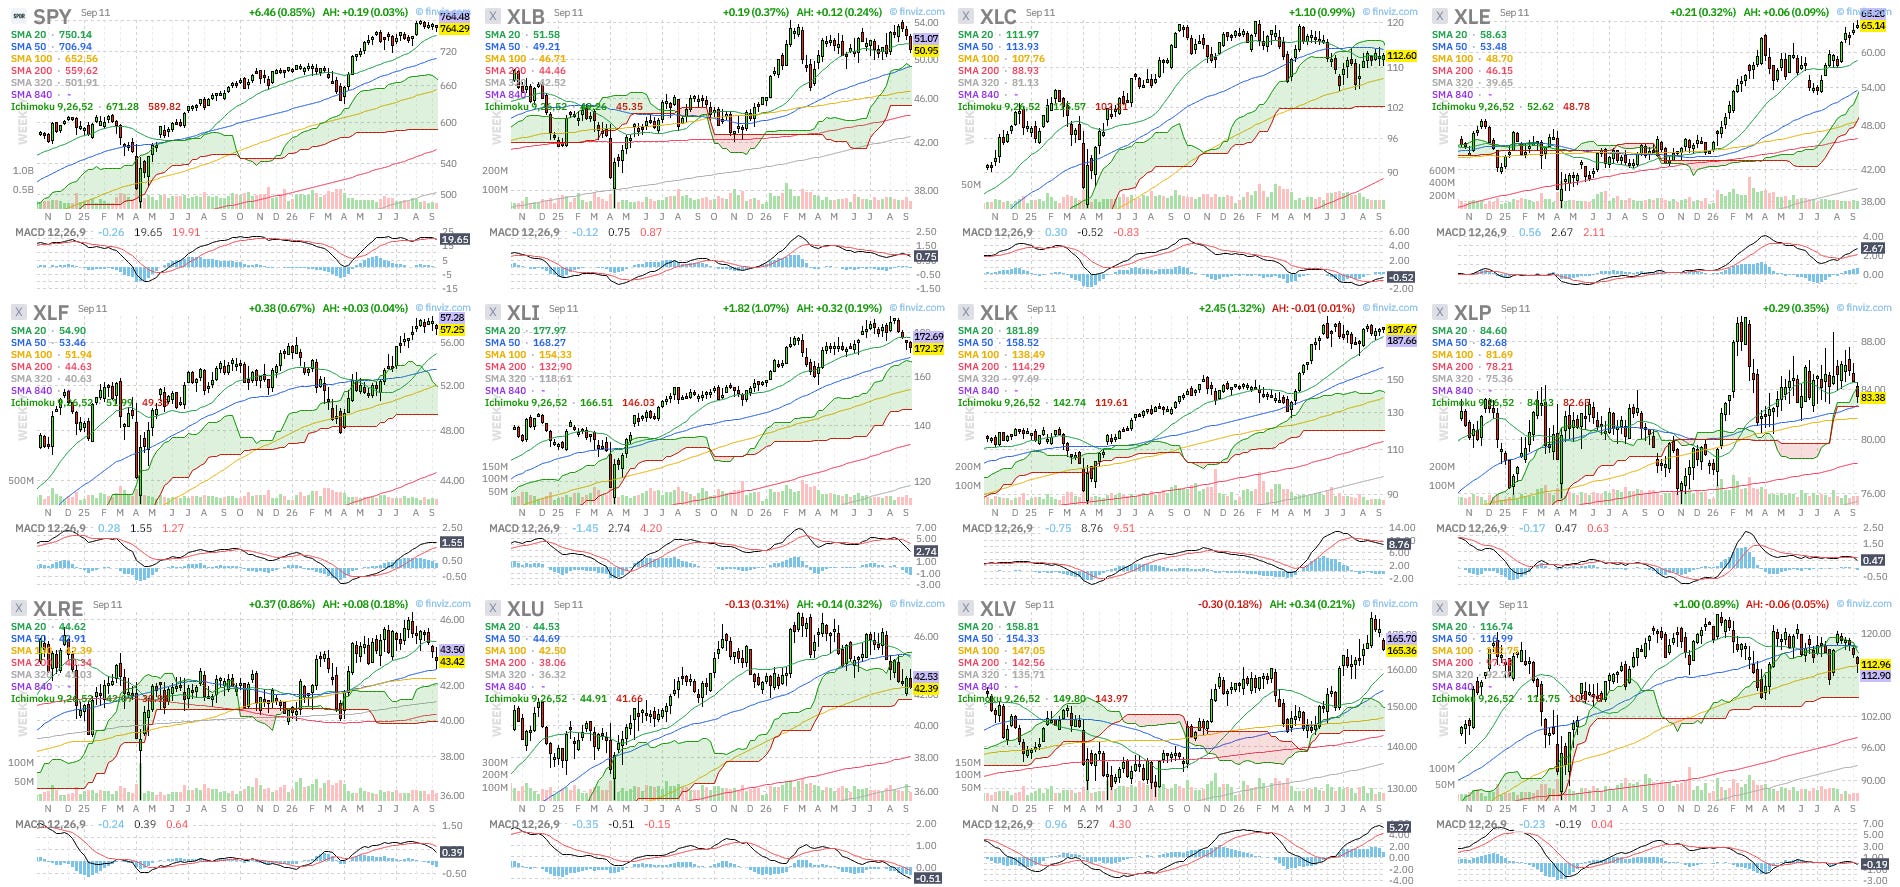
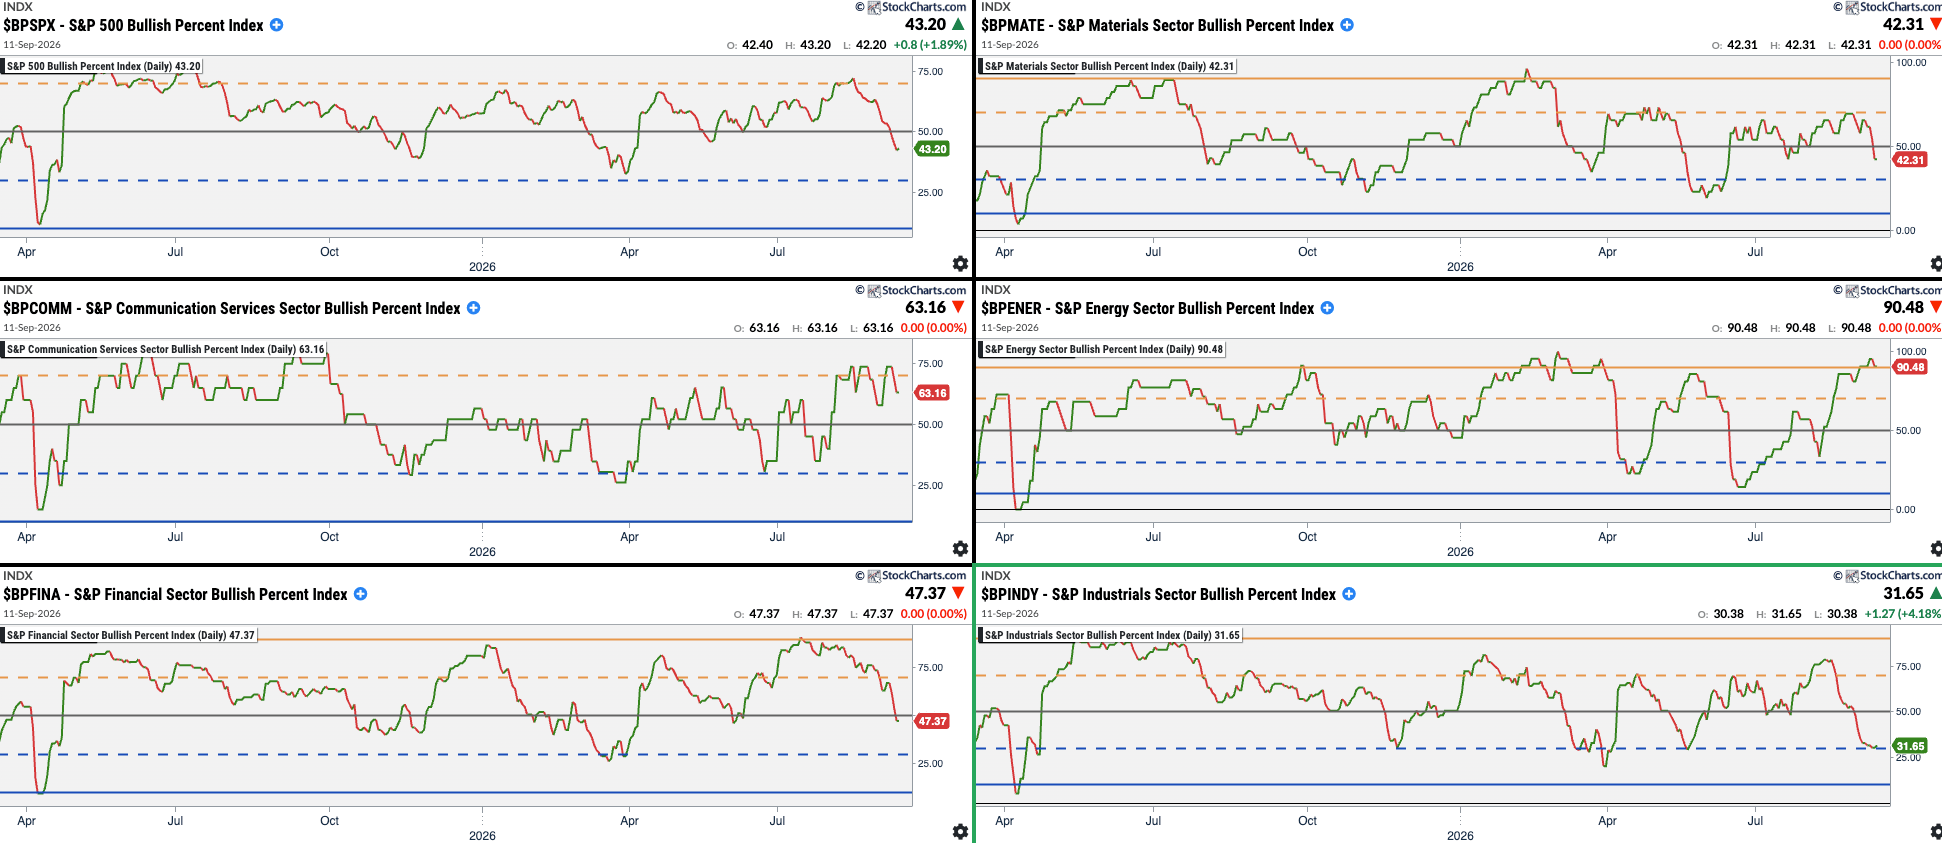
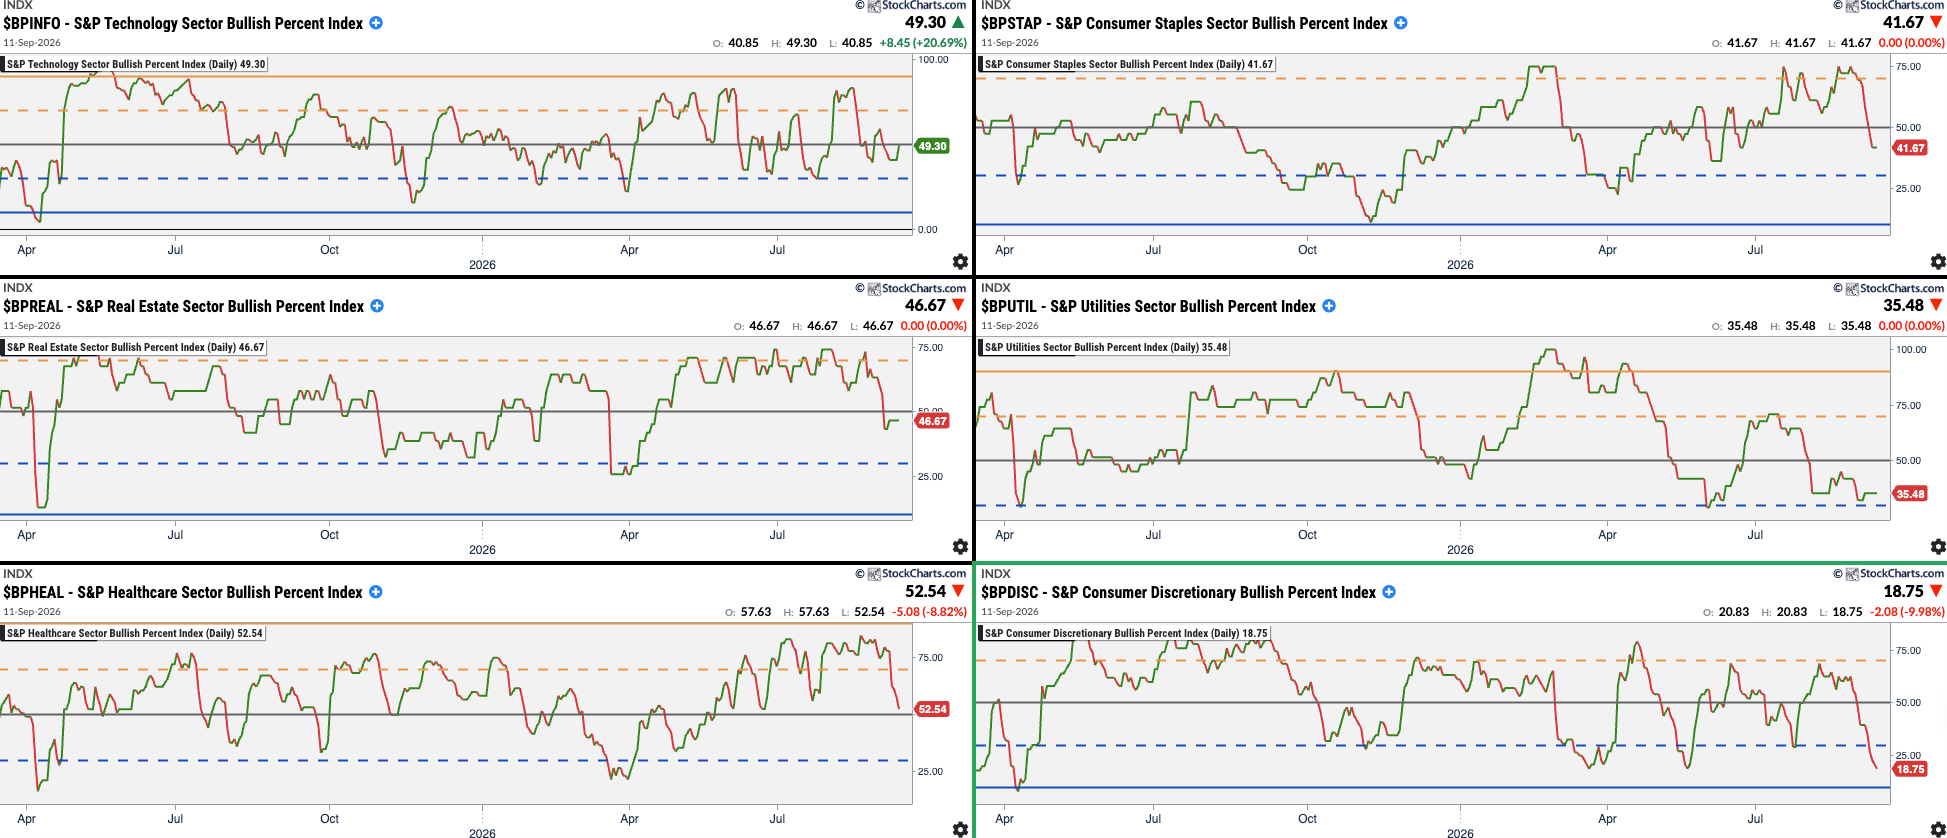
Summary:


Last Word
Last week, we saw the downturn coming and finally this week the downturn appeared. Friday recovered some of the lost territory but one isolated day will not turn a trend that easily. The market is giving us plenty of signals that the bearish pressure will remain for the time being.
Disclaimer: The content on AMAT Investing is strictly for educational and learning purposes. The author is not a licensed financial advisor and holds no formal financial education. This post does not constitute professional financial advice. All investing involves risk of loss. Always conduct your own research and consult a licensed professional before making any investment decisions.