Context: Why is it happening?
Economic Production: ISM PMI vs. SPX
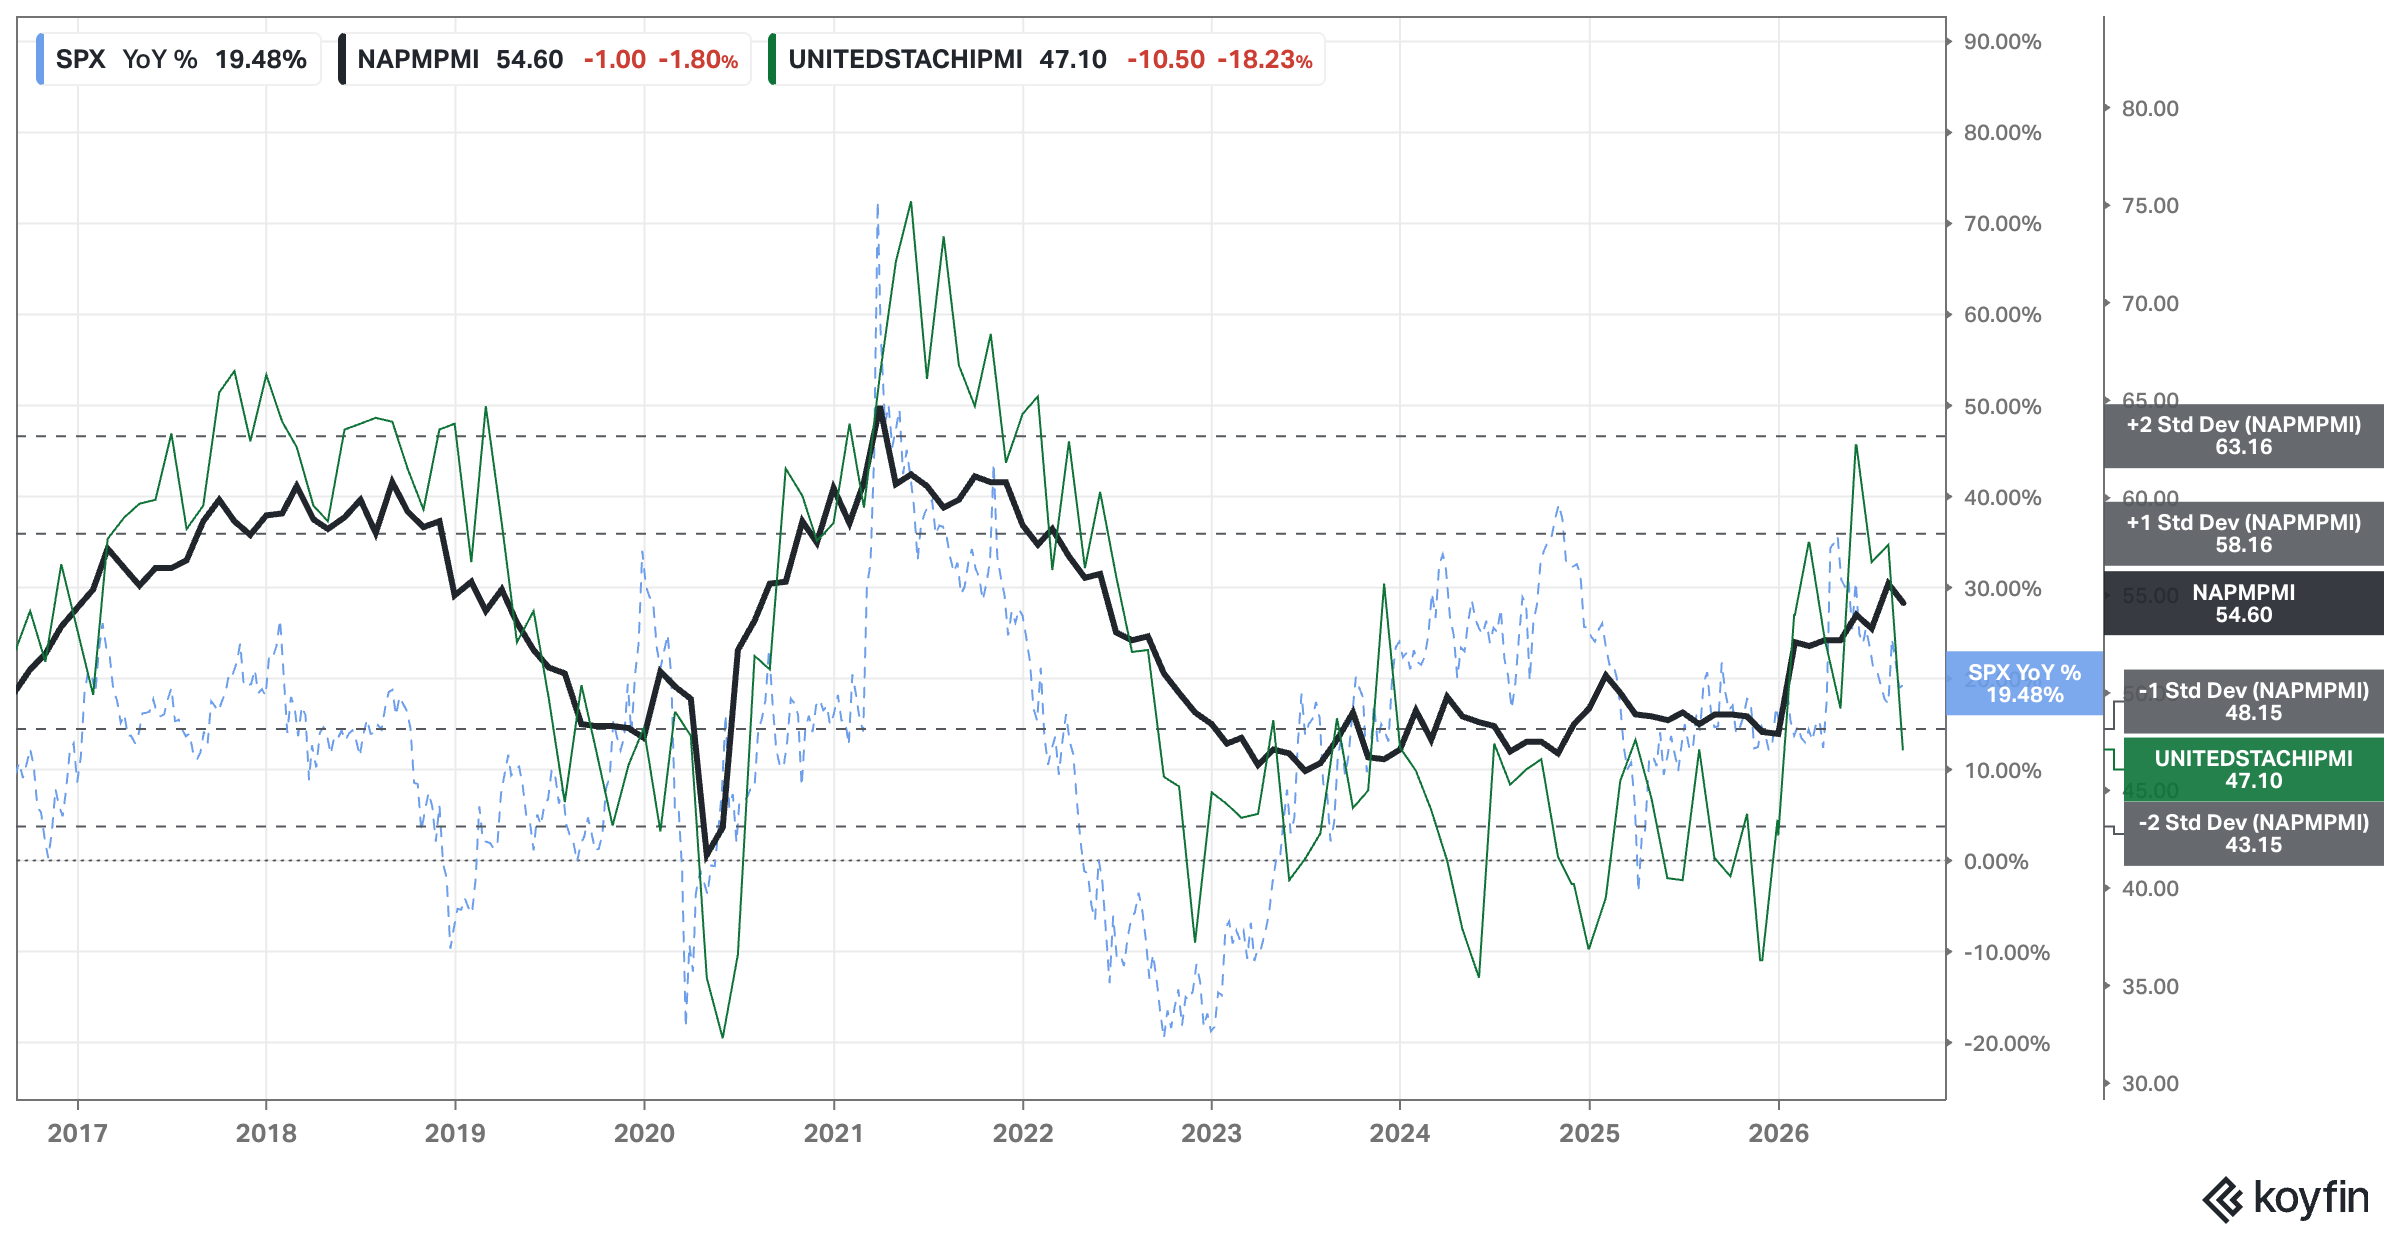
Analysis: US ISM PMI followed Chicago’s PMI. I’m lowering ACH from 9 to 8.
ACH: 8
Economic Activity: Regional Banks Performance
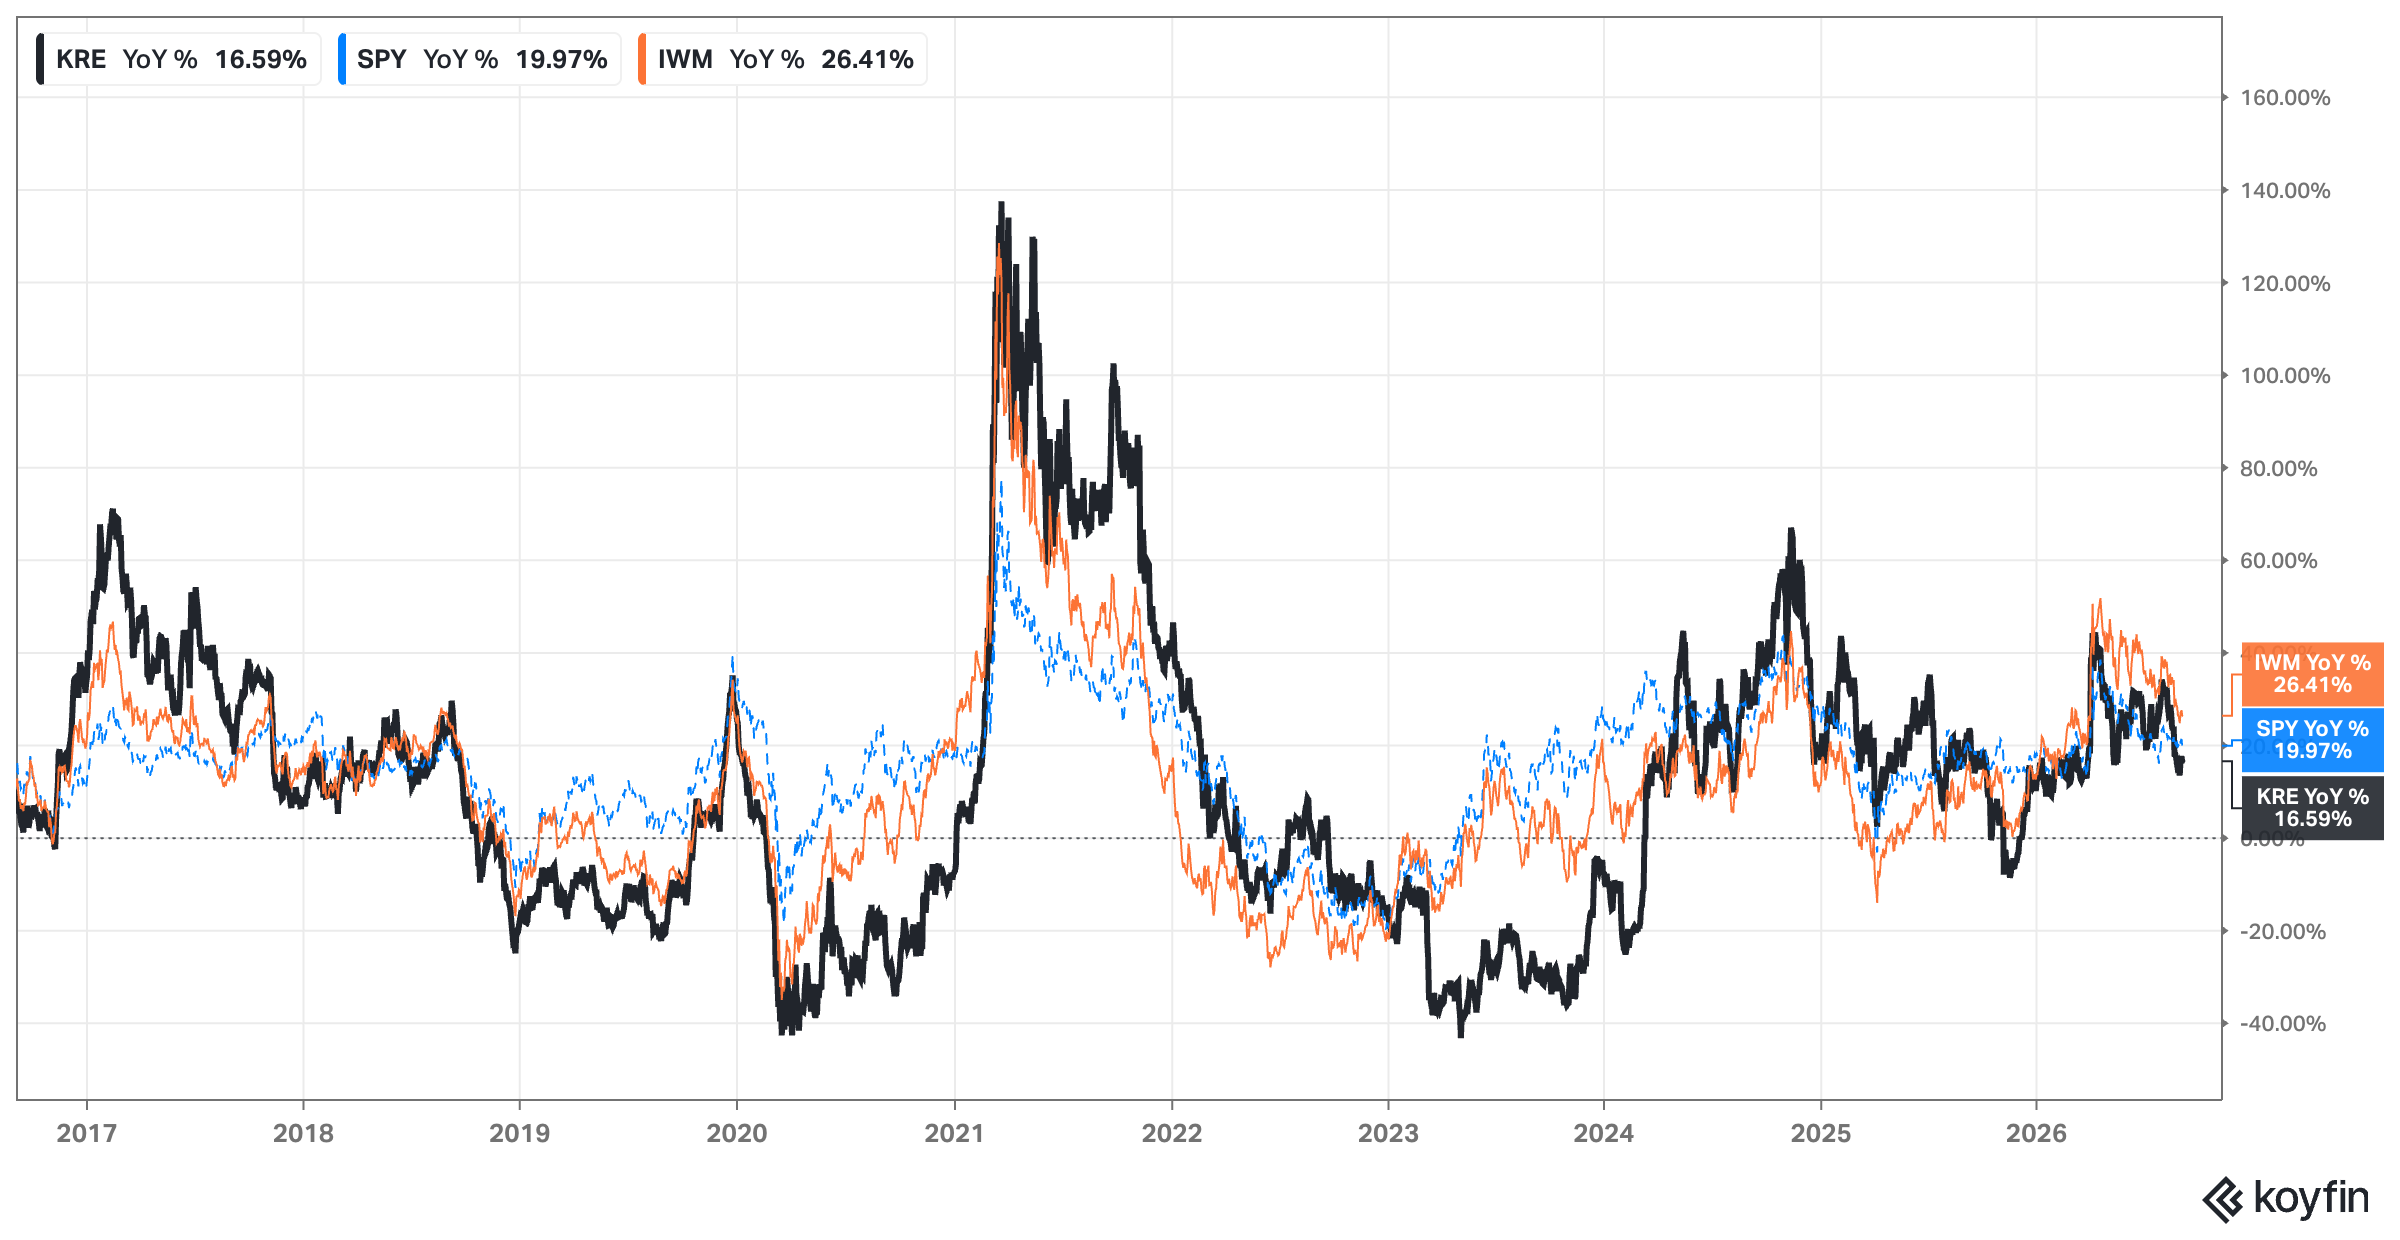
Analysis: KRE uptrend has been broken. Last week’s action seems that could mark a higher low. We will wait for a more clear vision to change the ACH.
ACH: 7
Interest Rates: FED, 2yr, 10yr, and 30yr Rates
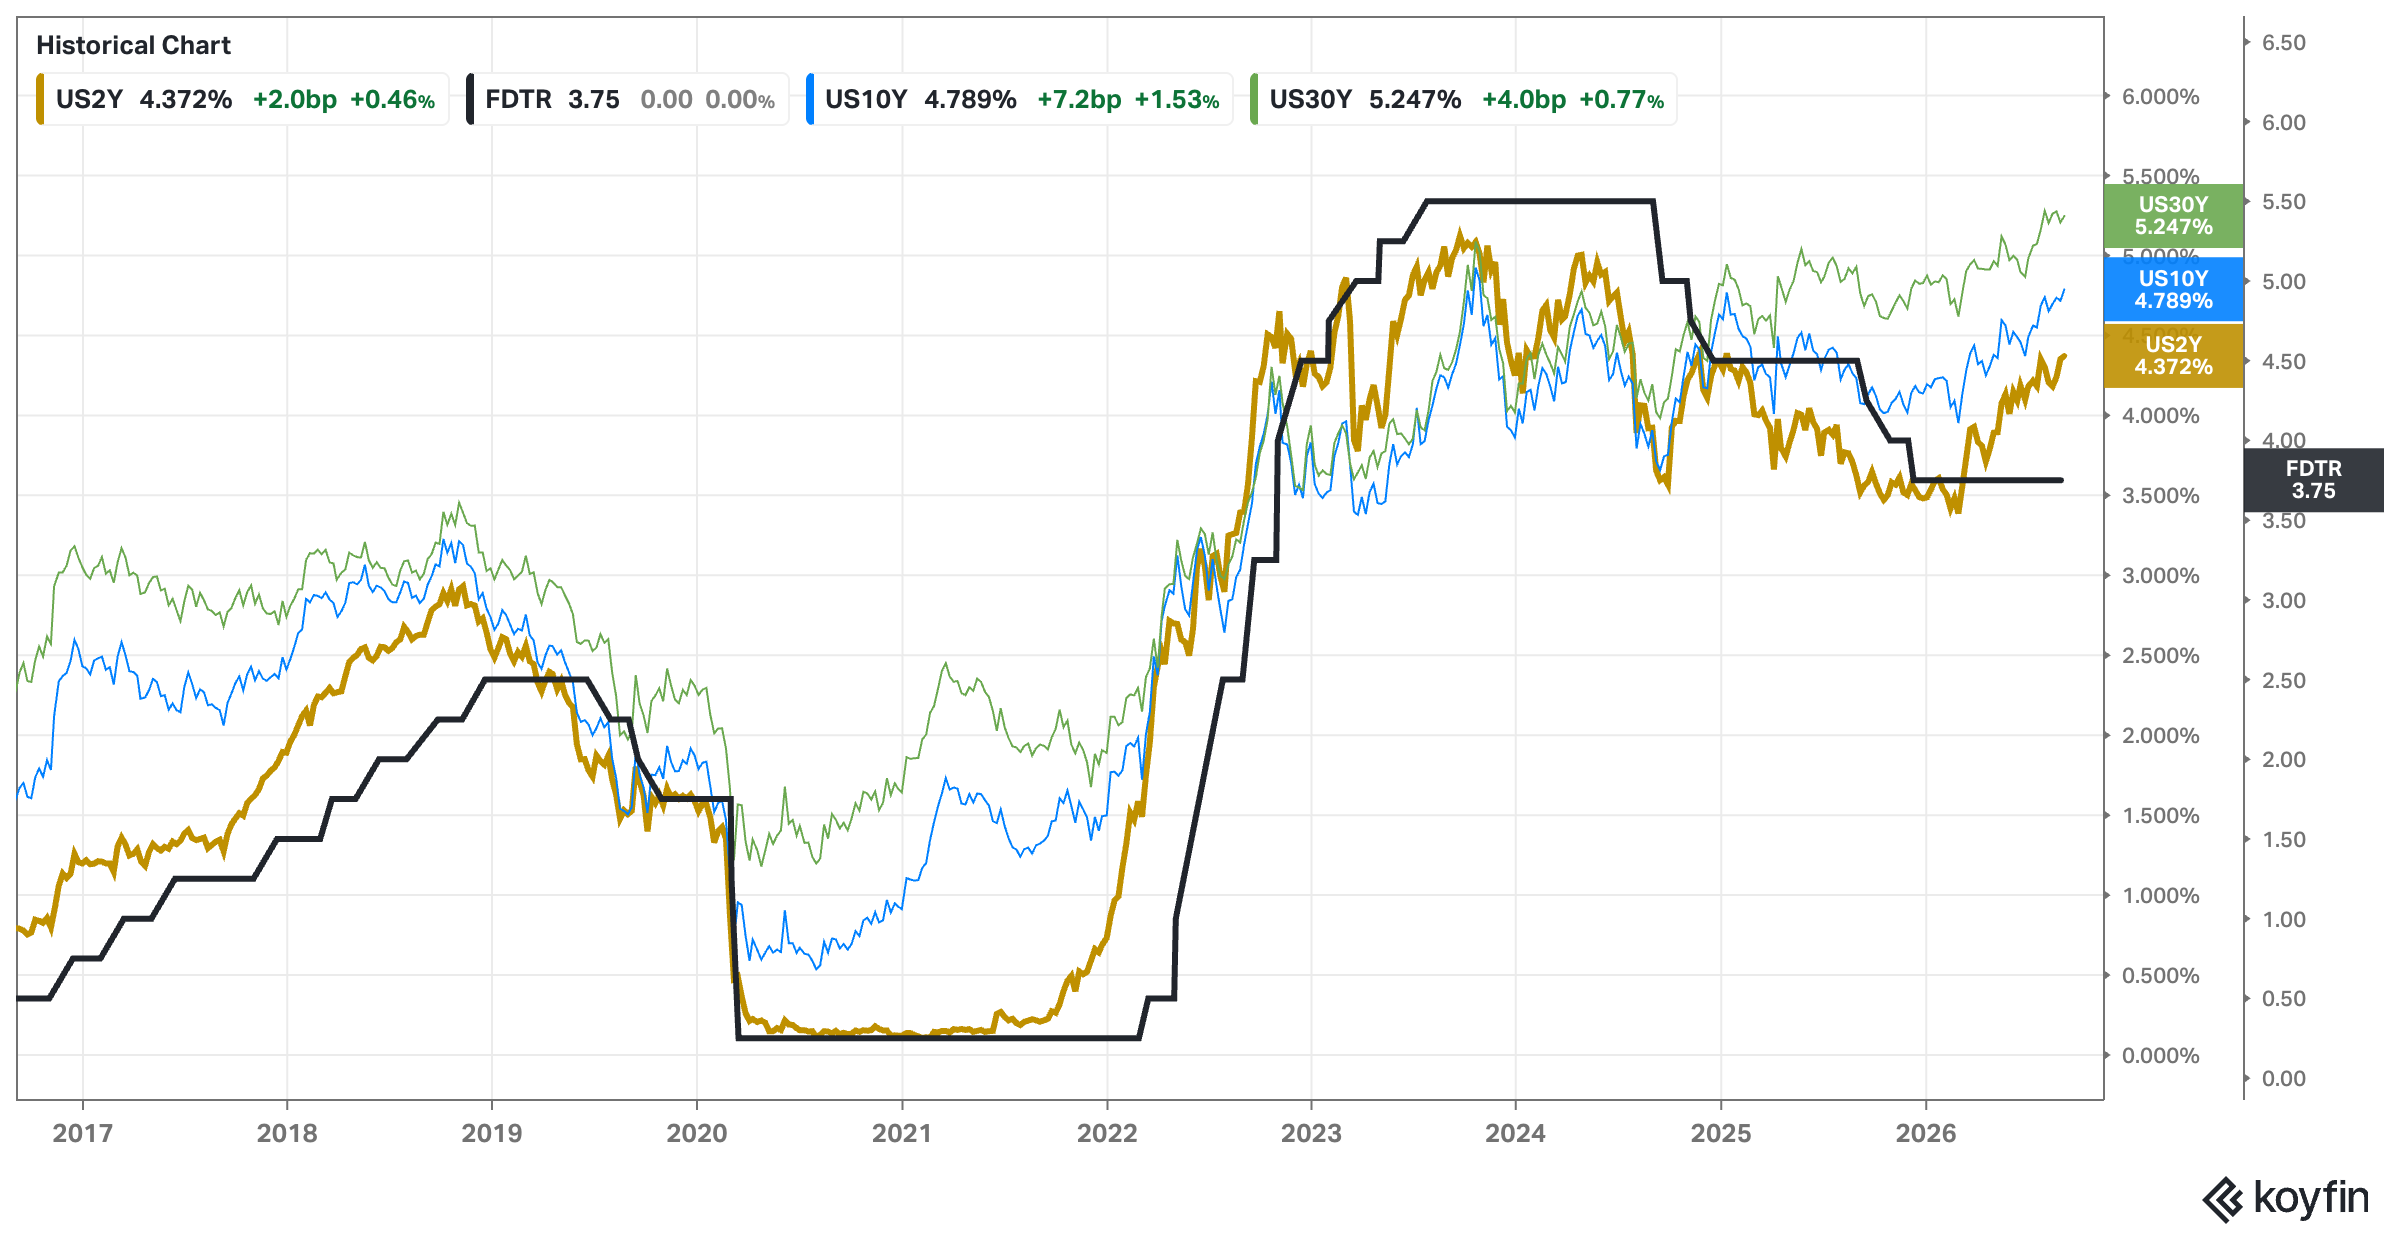
Analysis: Flat week for rates still at high levels that can even go higher.
ACH (inverted color): 11
Indexes: What is happening?
TA: Price Action, Trend, Momentum & Volume:
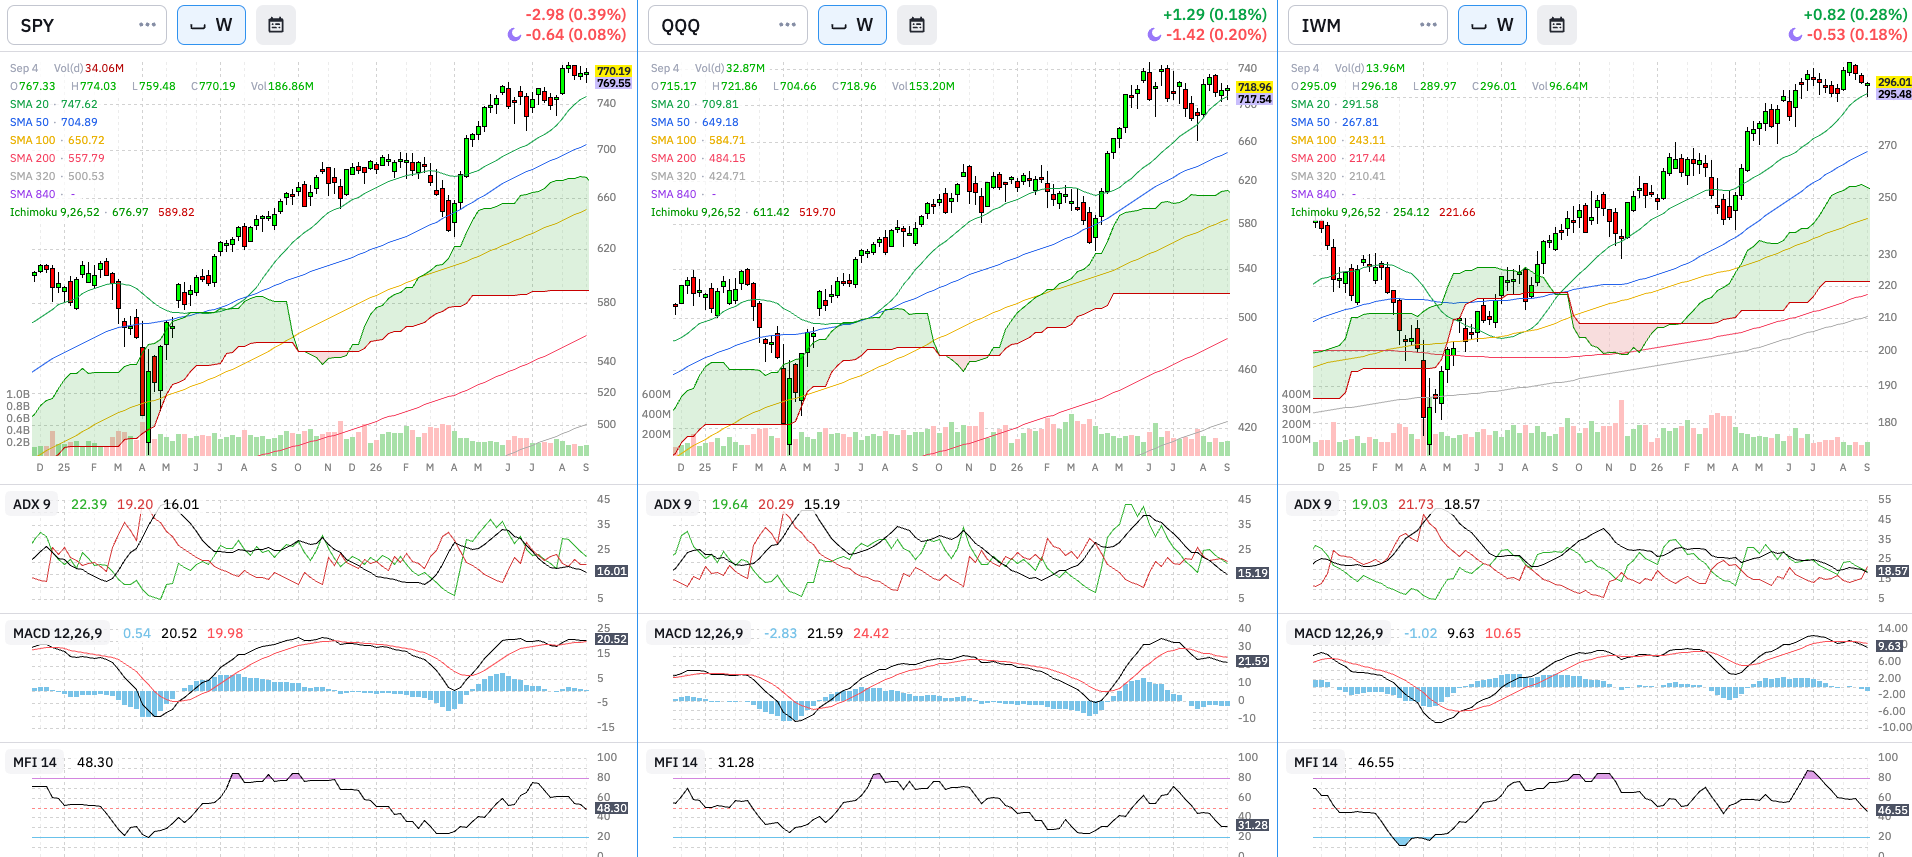
Weekly & Daily SPY, QQQ, and IWM
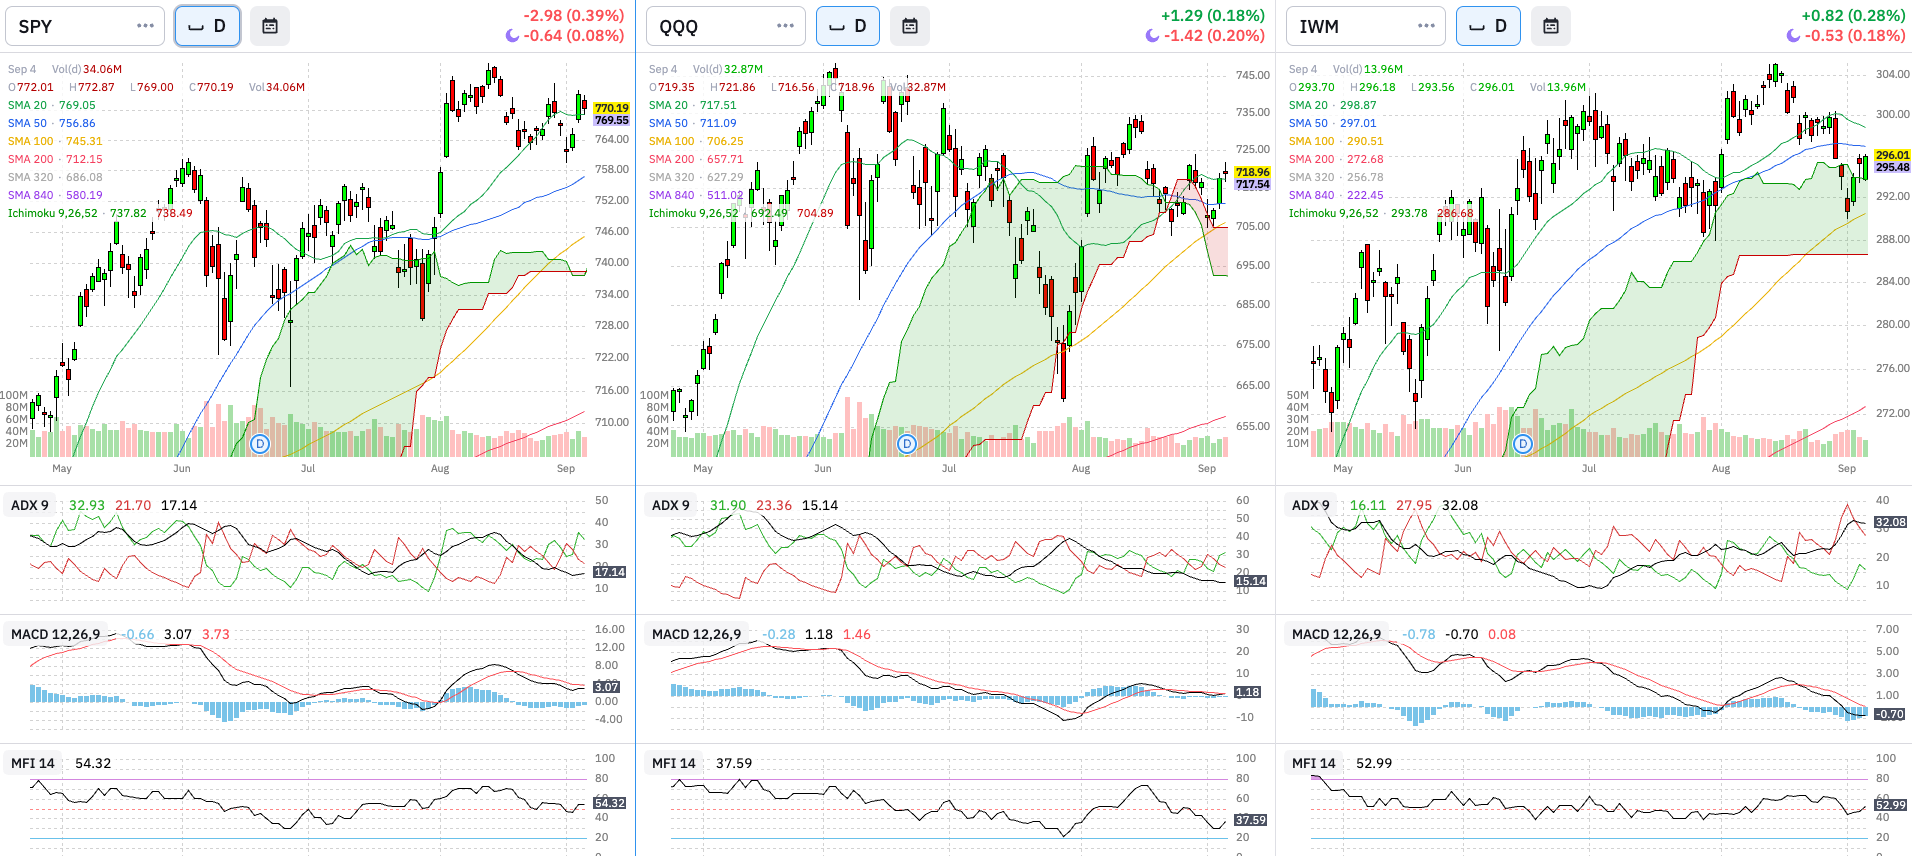
Technical Analysis:
Price (SMAs & Cloud): Weekly: All indices in an uptrend. Daily: SPY found support in the 20D SMA. QQQ crossed up and down both 20D and 50D SMAs. IWM broke below both 20D and 50D SMAs and found support in the 100D. ACH: 2
Trend (ADX): Weekly: ADX strength very weak in all markets. Daily: ADX for SPY is very weak and for IWM is strong but towards a bearish trend. ACH: 2
Momentum (MACD): Weekly: SPY at 12 o’clock, QQQ at 2 o’clock, and IWM at 1 o’clock with a bearish divergence. Daily: All in bearish divergences. ACH: 3
Volume (MFI): Weekly: All indices have bearish divergences. Daily: SPY and QQQ on downtrends. IWM has no clear signal. ACH: 3
Breadth: % Stocks above SMAs
Above 200 Daily SMA
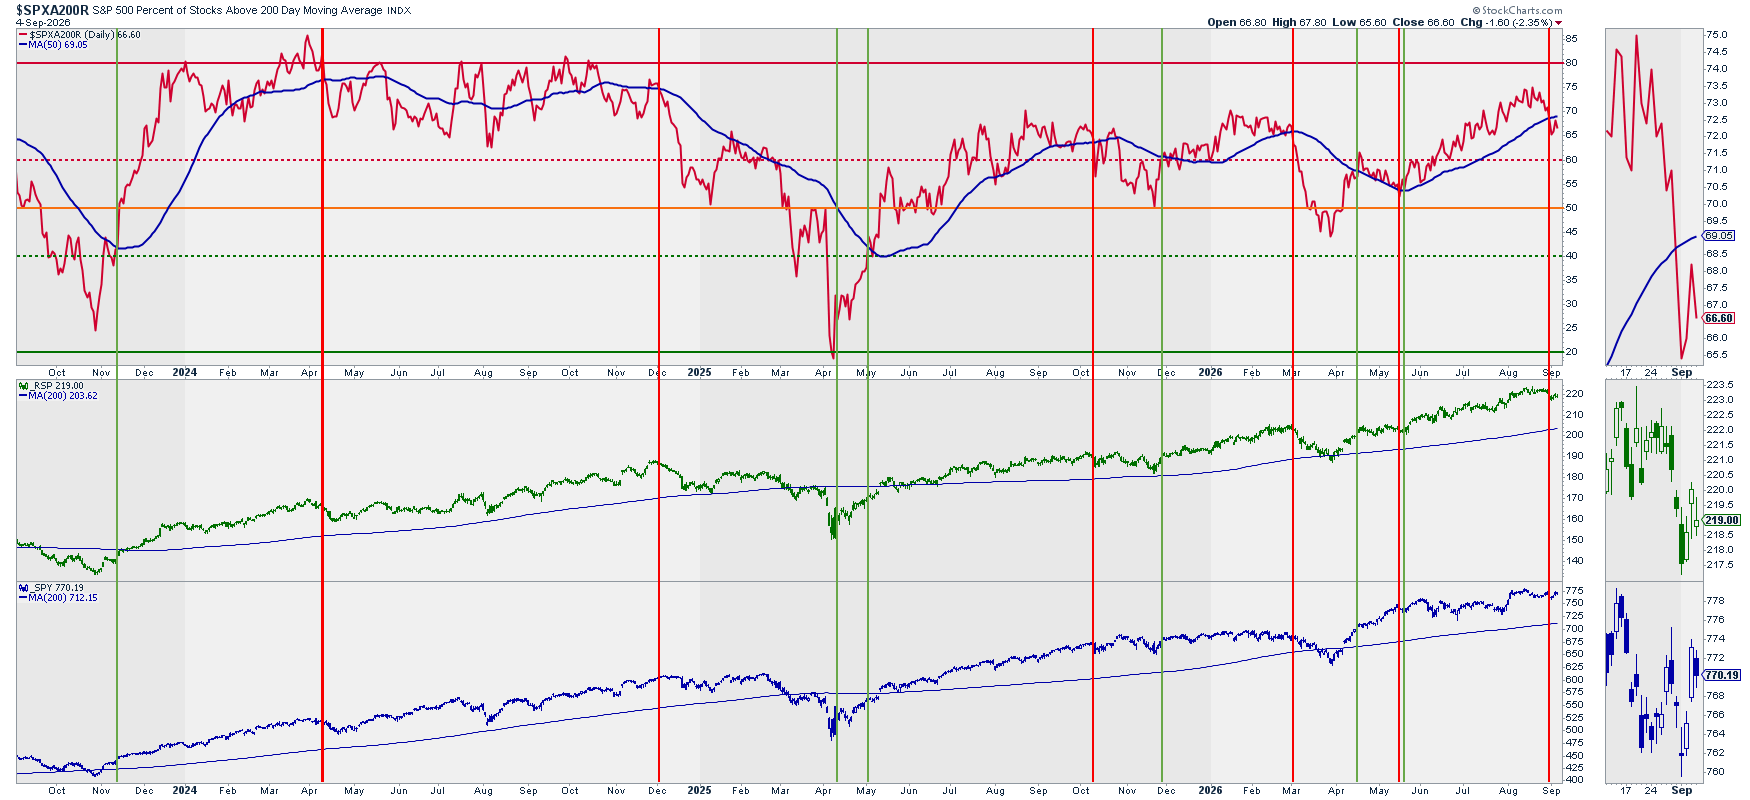
Above 20, 50, and 200 Daily SMAs vs. RSP
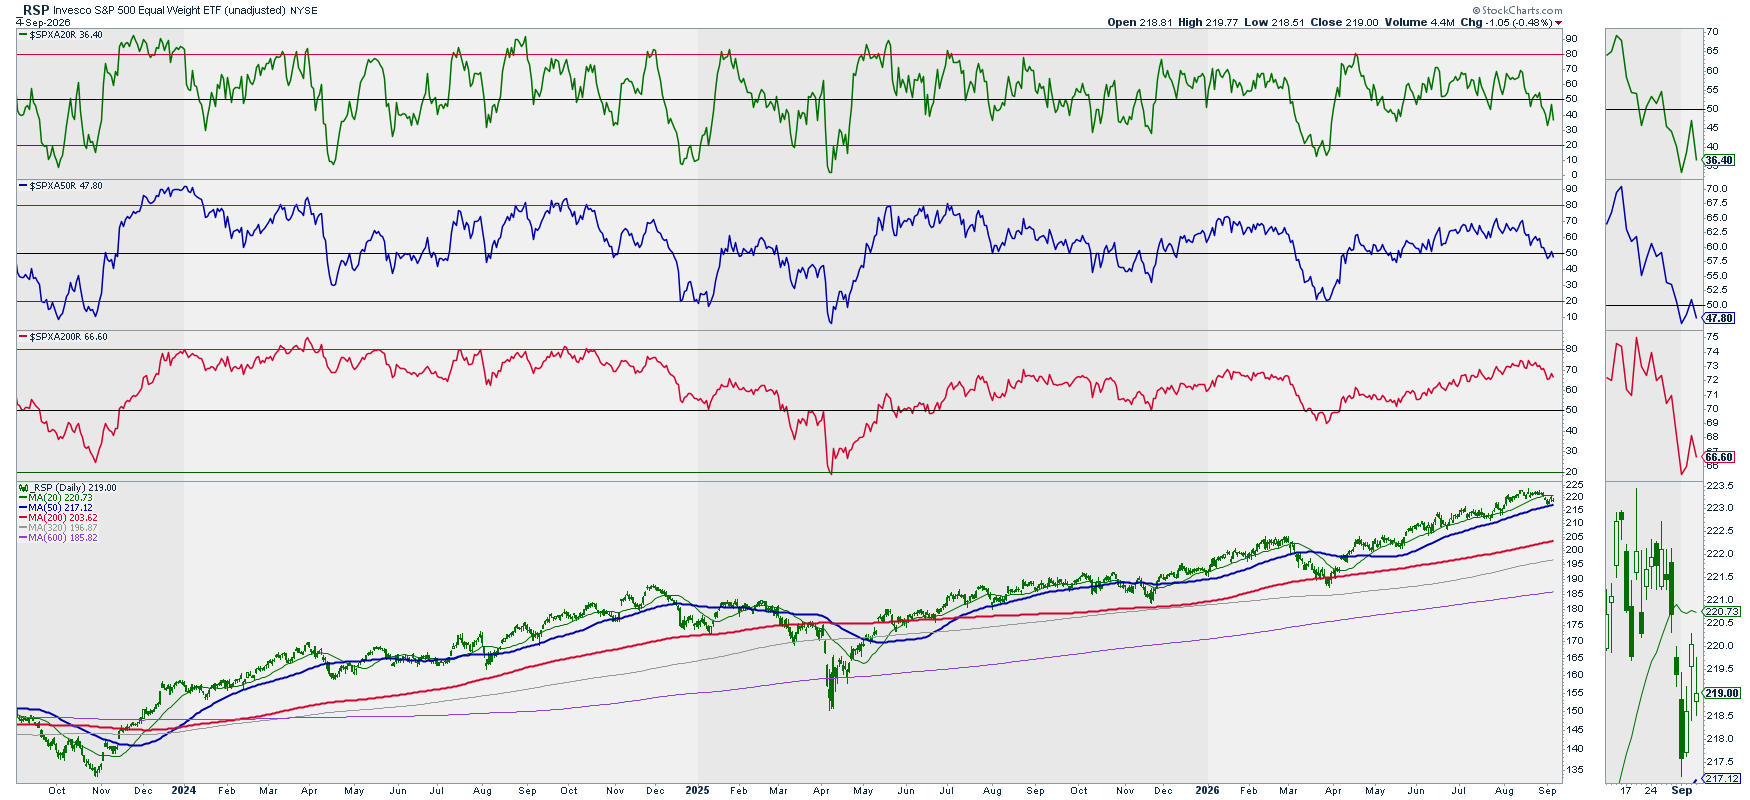
Analysis: % of stocks above their 200D SMAcrossed below the signal line. Both 20D and 50D %s are below the 50% middle line.
ACH: 3
Volatility: Ratio Low Vol. Stocks / SPY vs. RSP & SPY
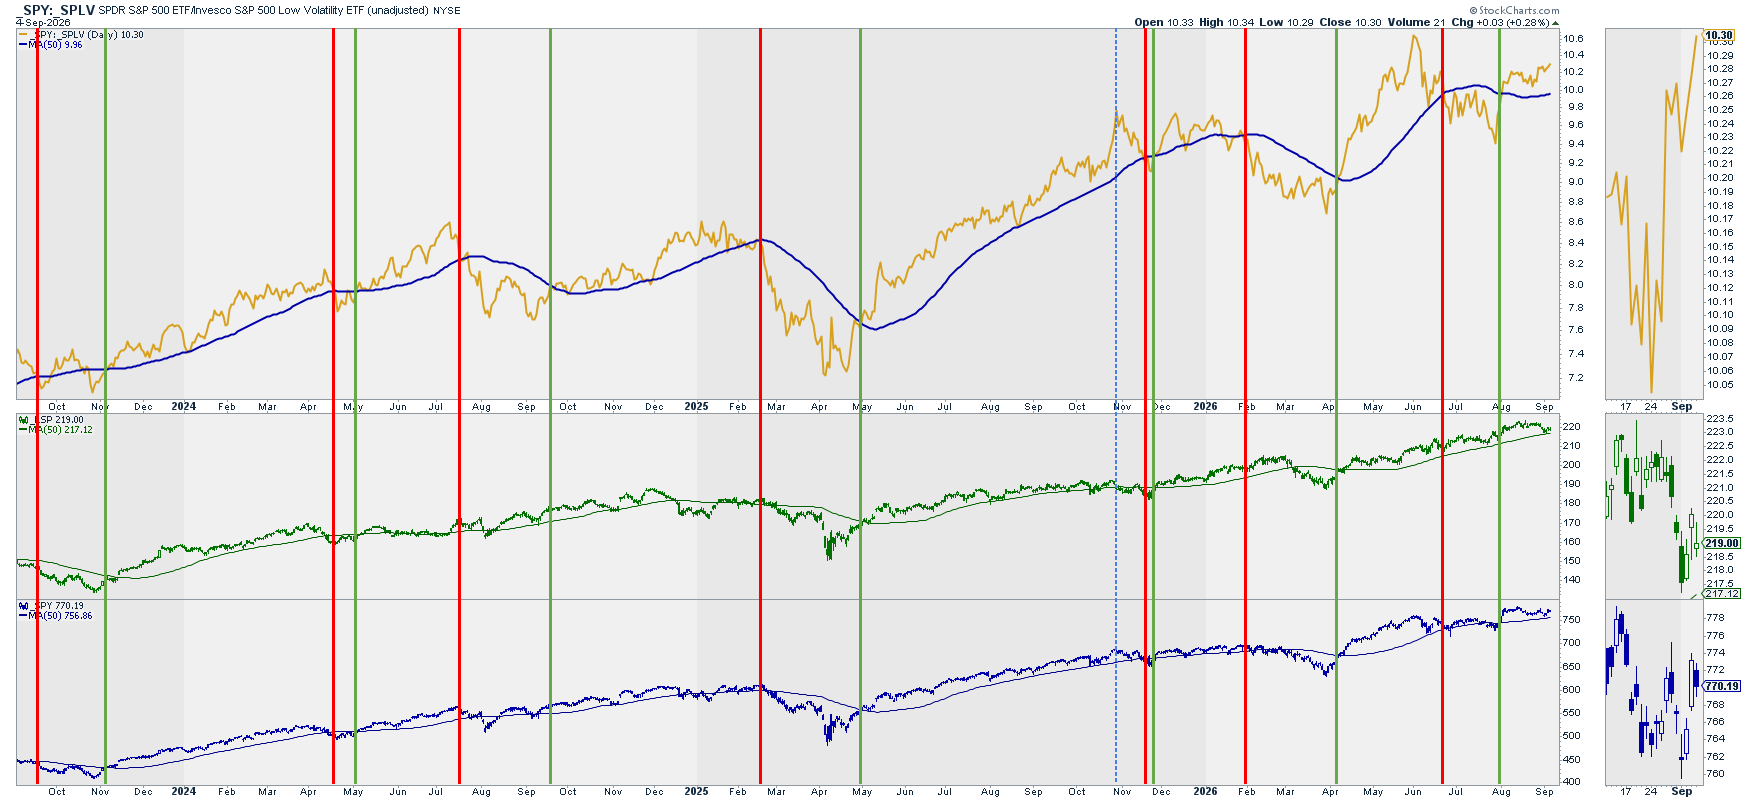
Analysis: Ratio remains above the signal line (50D SMA). We can see a bit of horizontal formation since the previous weeks.
ACH: 10
Volatility: (Inverted) VIX vs. SPY
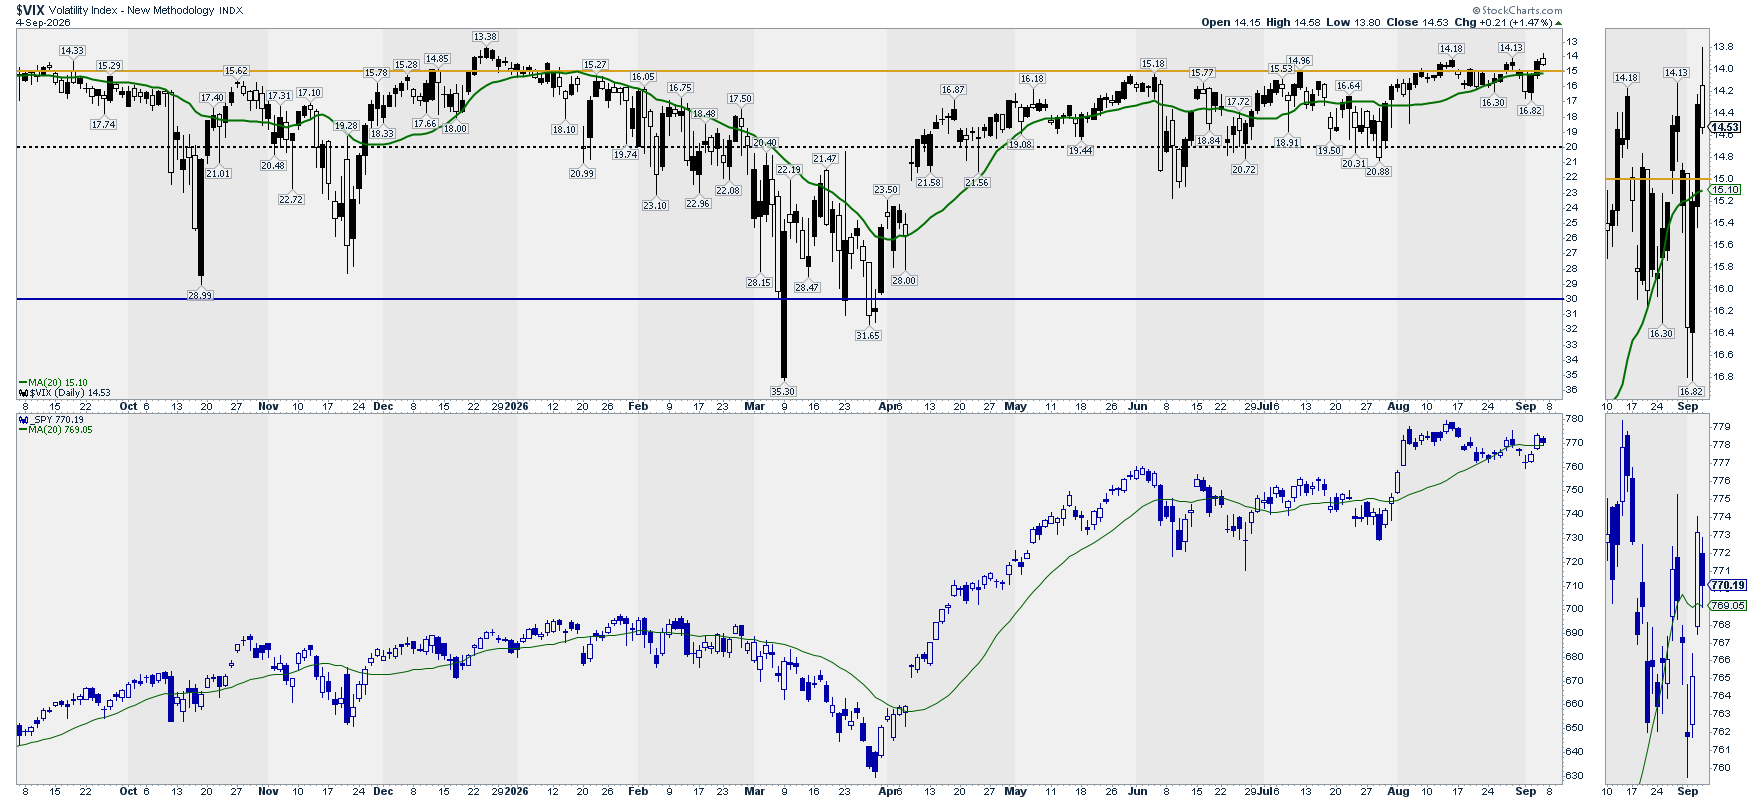
Note: This chart is mainly to detect extreme volatility situations that, once they reverse, offer great long opportunities in the market.
Analysis: Low VIX readings in quite a flat trend. There is no much signal here.
ACH: 12
Options: (Inverted) Put/Call Ratio vs. SPY
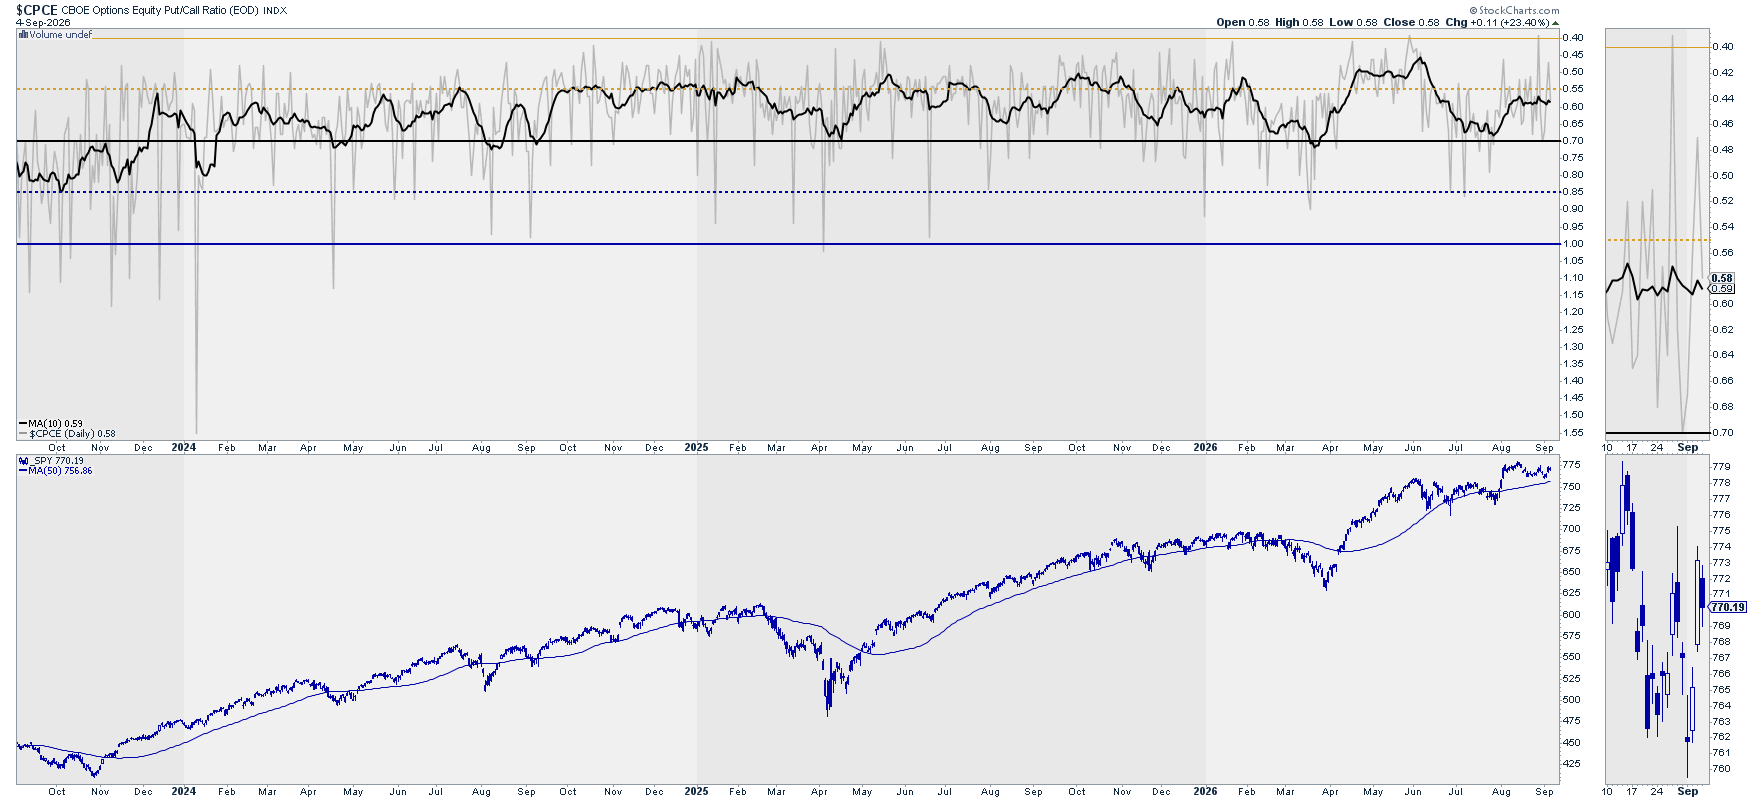
Analysis: P/C ratio quite flat at high levels. I’m moving forward the clock to 11.
ACH: 11
Options: Gamma Exposure – SPY
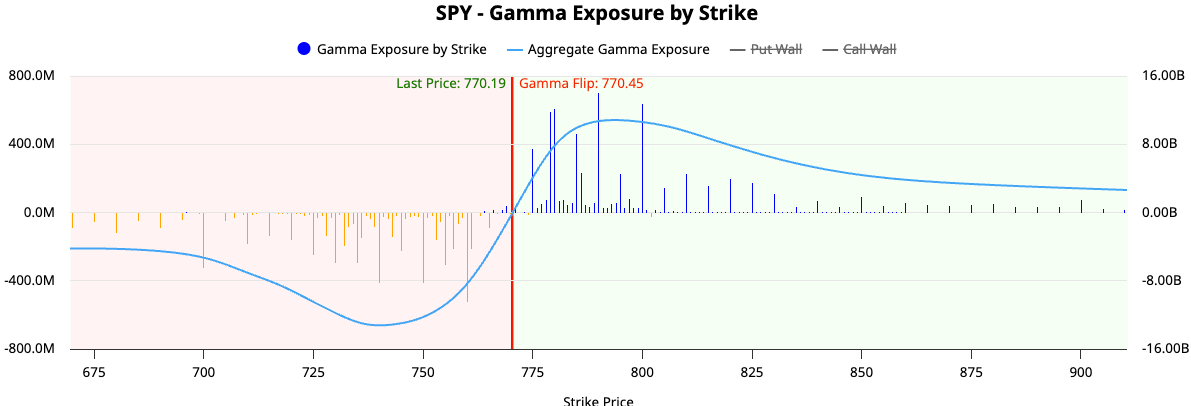
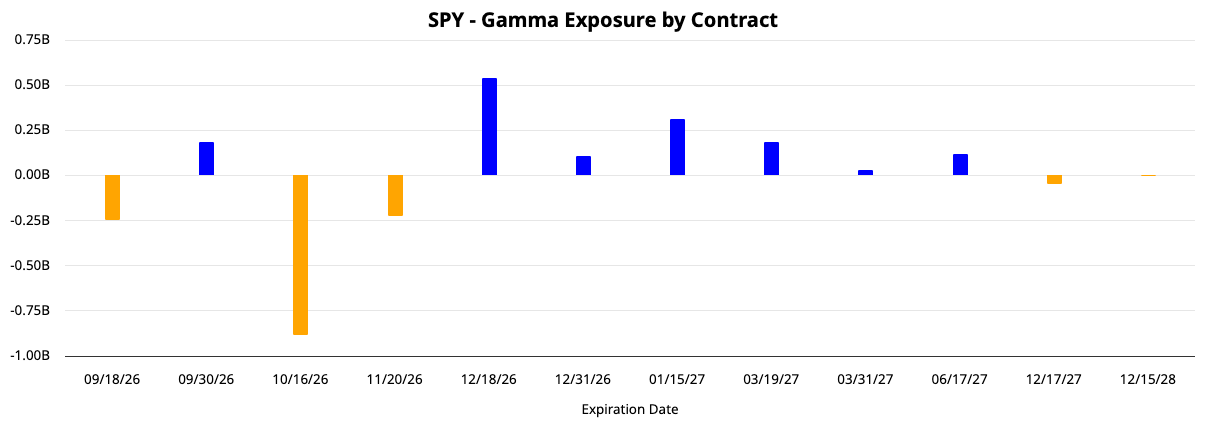
Analysis: Price at GEX flipping point. More volume at higher levels than lower. Future contracts gamma quite compress with no expiration above 1.00B of net GEX.
Upper wall(s): 780 & 800
Lower wall(s): 760
Sectors: Where is it happening?
Sectors Rotation
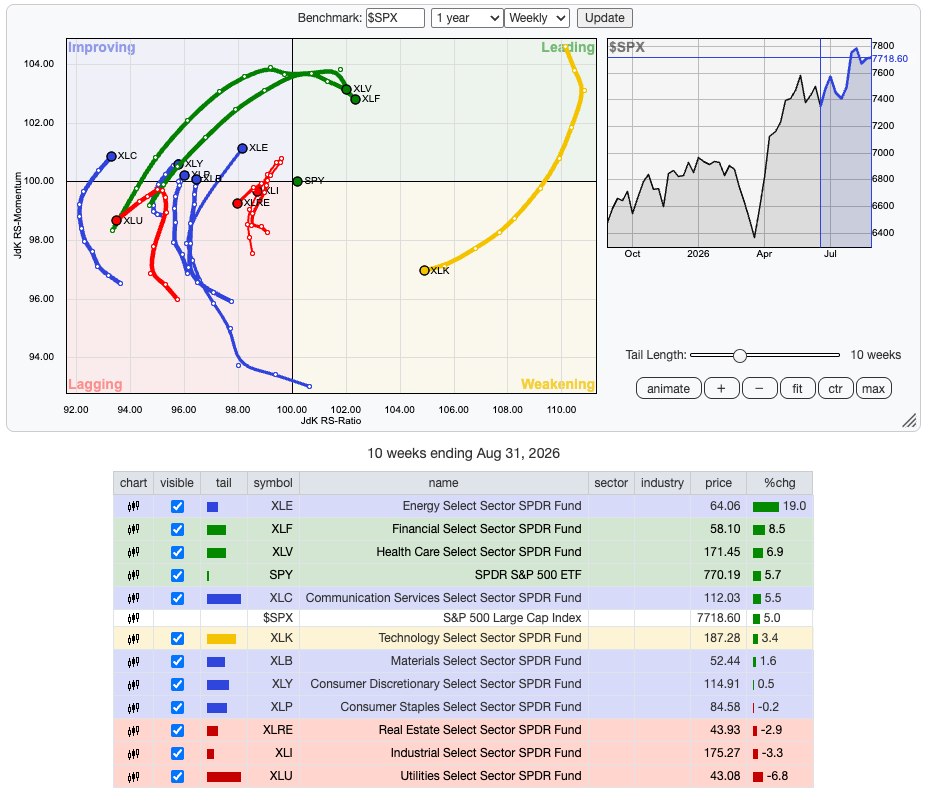
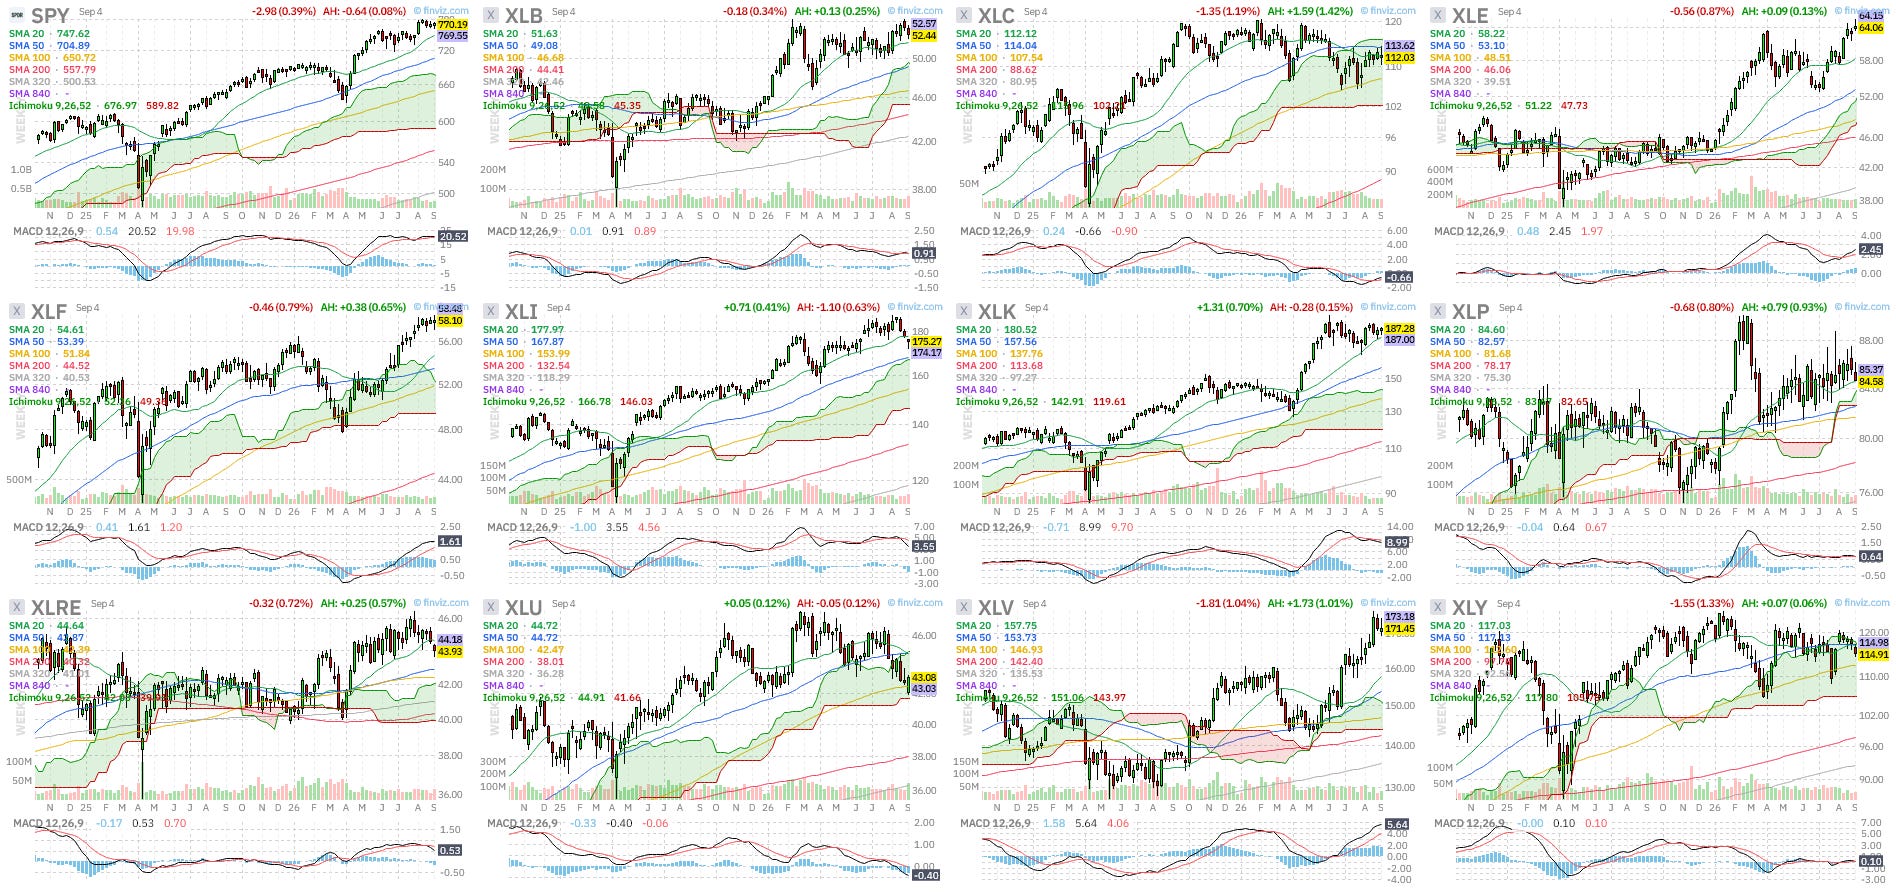
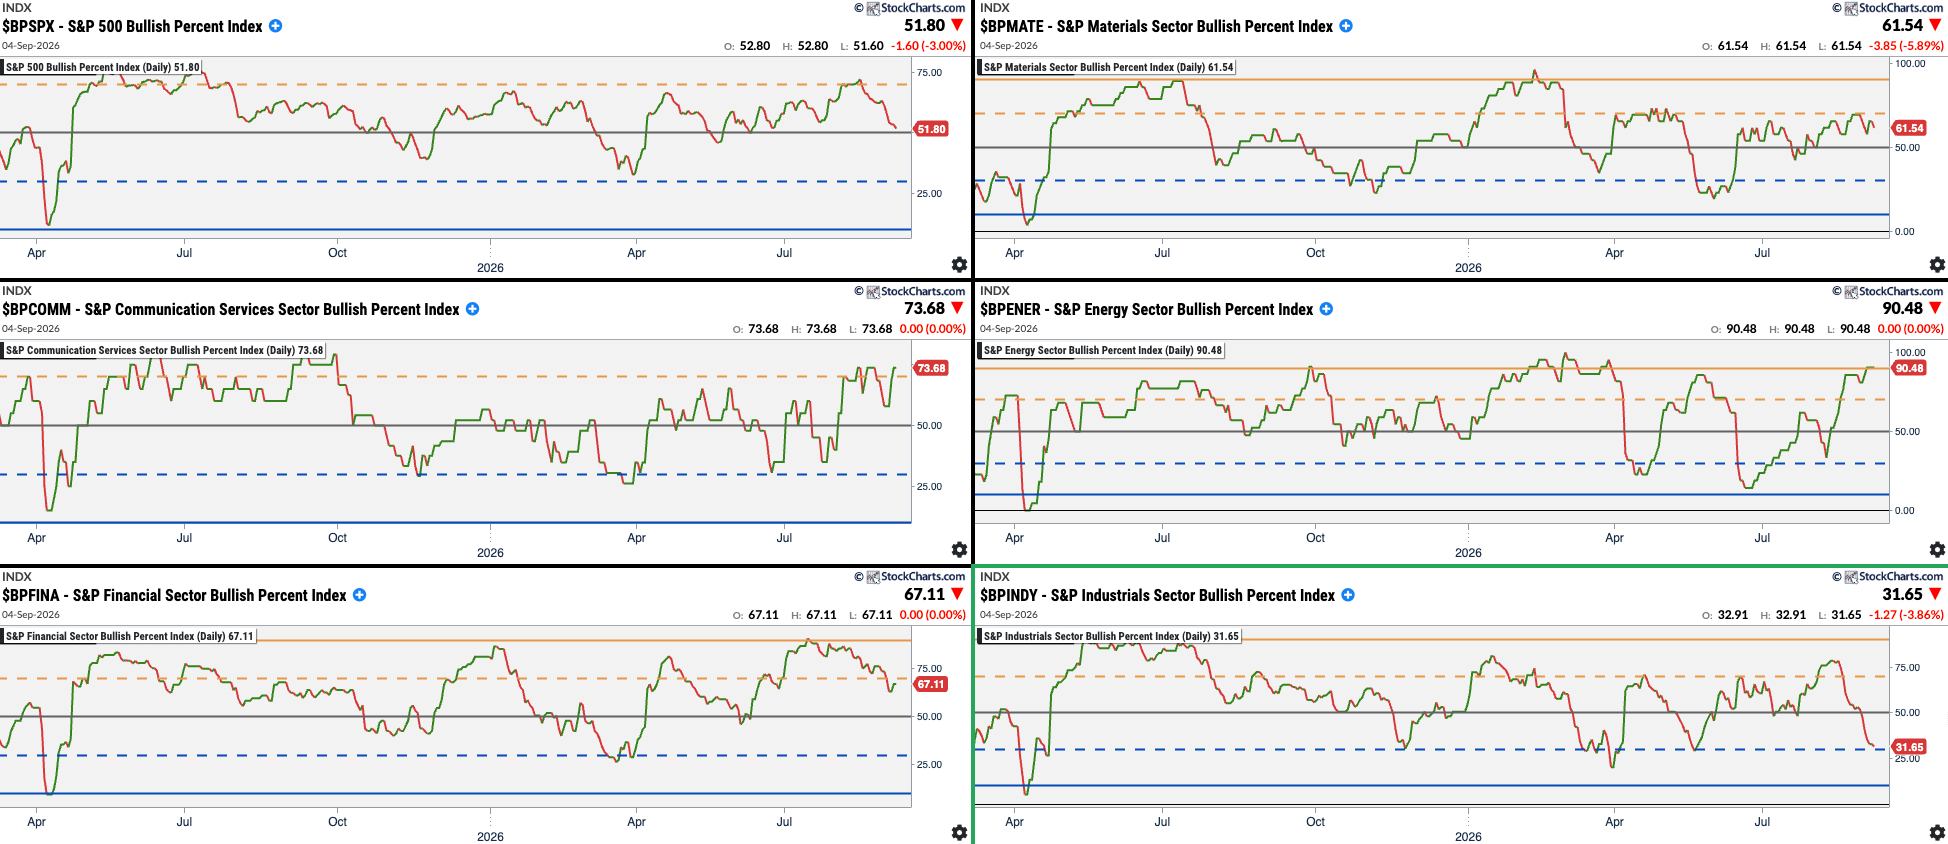
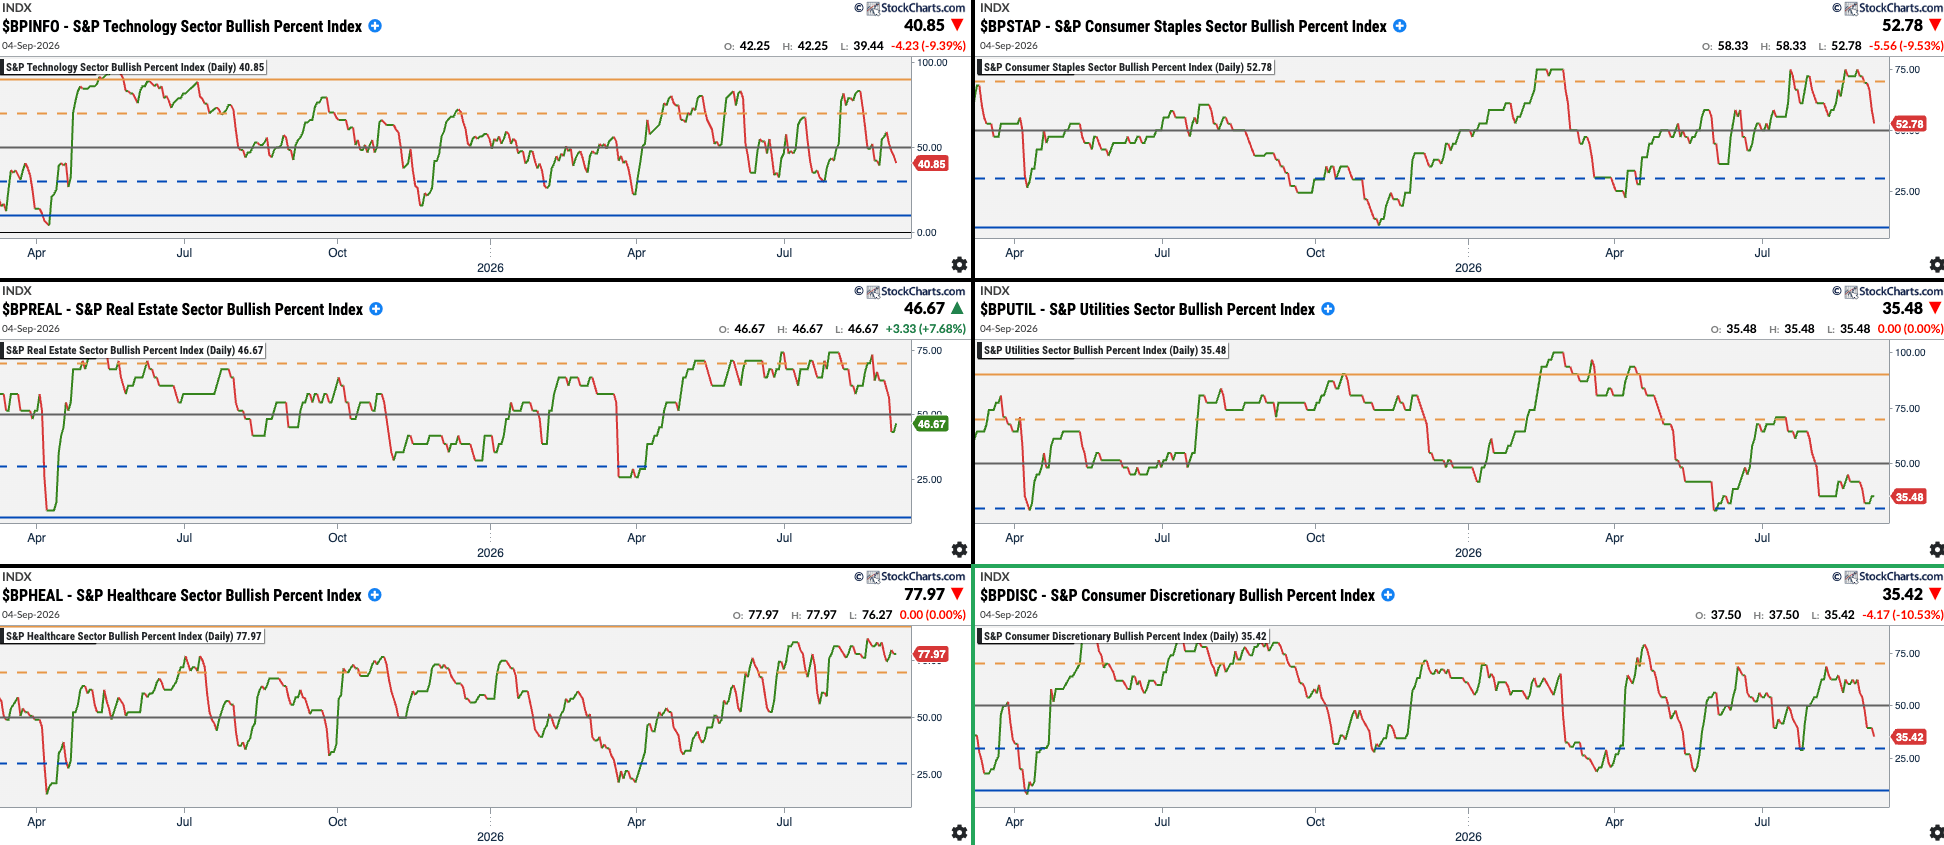
Summary:


Last Word
Clear downturn coming which shall be seen as an opportunity to buy some nice deeps. We are still early though. Let the market give us the signal that the bottom is in. By now, what the market is telling us is that the downturn is coming…
Disclaimer: The content on AMAT Investing is strictly for educational and learning purposes. The author is not a licensed financial advisor and holds no formal financial education. This post does not constitute professional financial advice. All investing involves risk of loss. Always conduct your own research and consult a licensed professional before making any investment decisions.